The same plot in 14 other libraries — JavaScript: Chart.js, D3.js, Apache ECharts, Highcharts; Python: Altair, Bokeh, lets-plot, Matplotlib, Plotly, plotnine, Pygal, Seaborn; R: ggplot2; Julia: Makie.jl. Compare all 15 side by side: Violin Plot with Overlaid Swarm Points in Python, R, Julia and JavaScript.
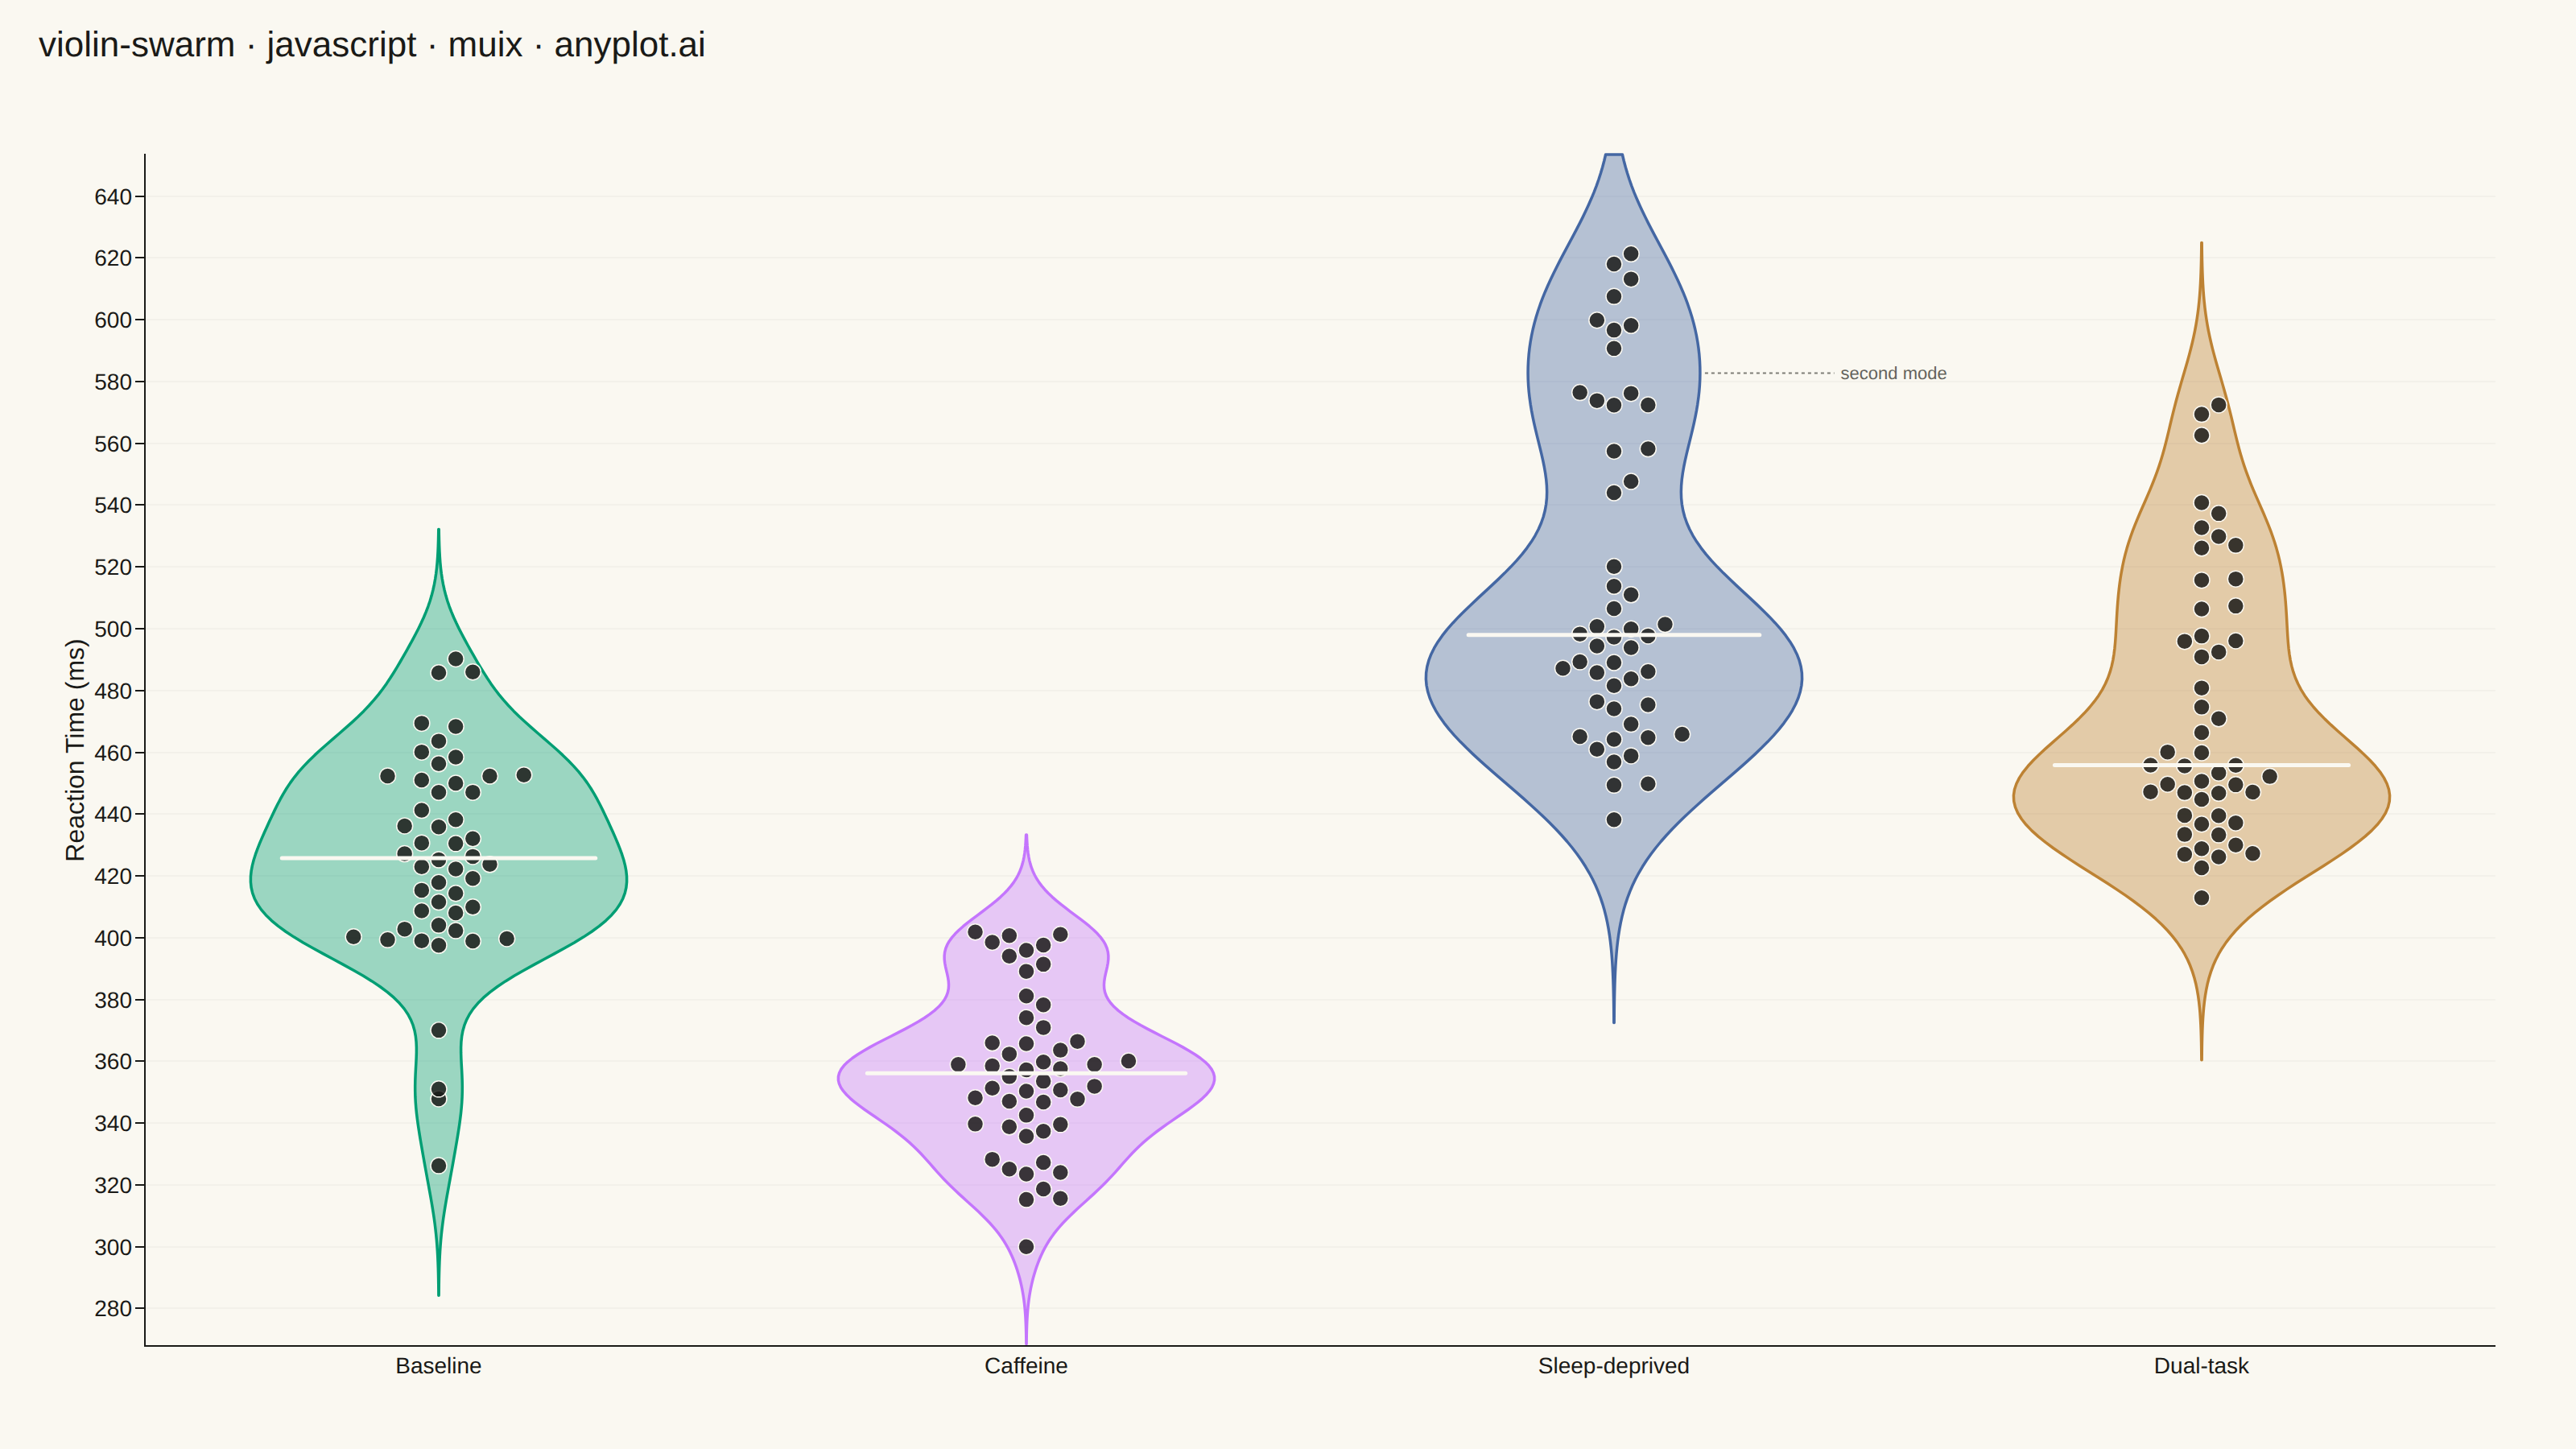
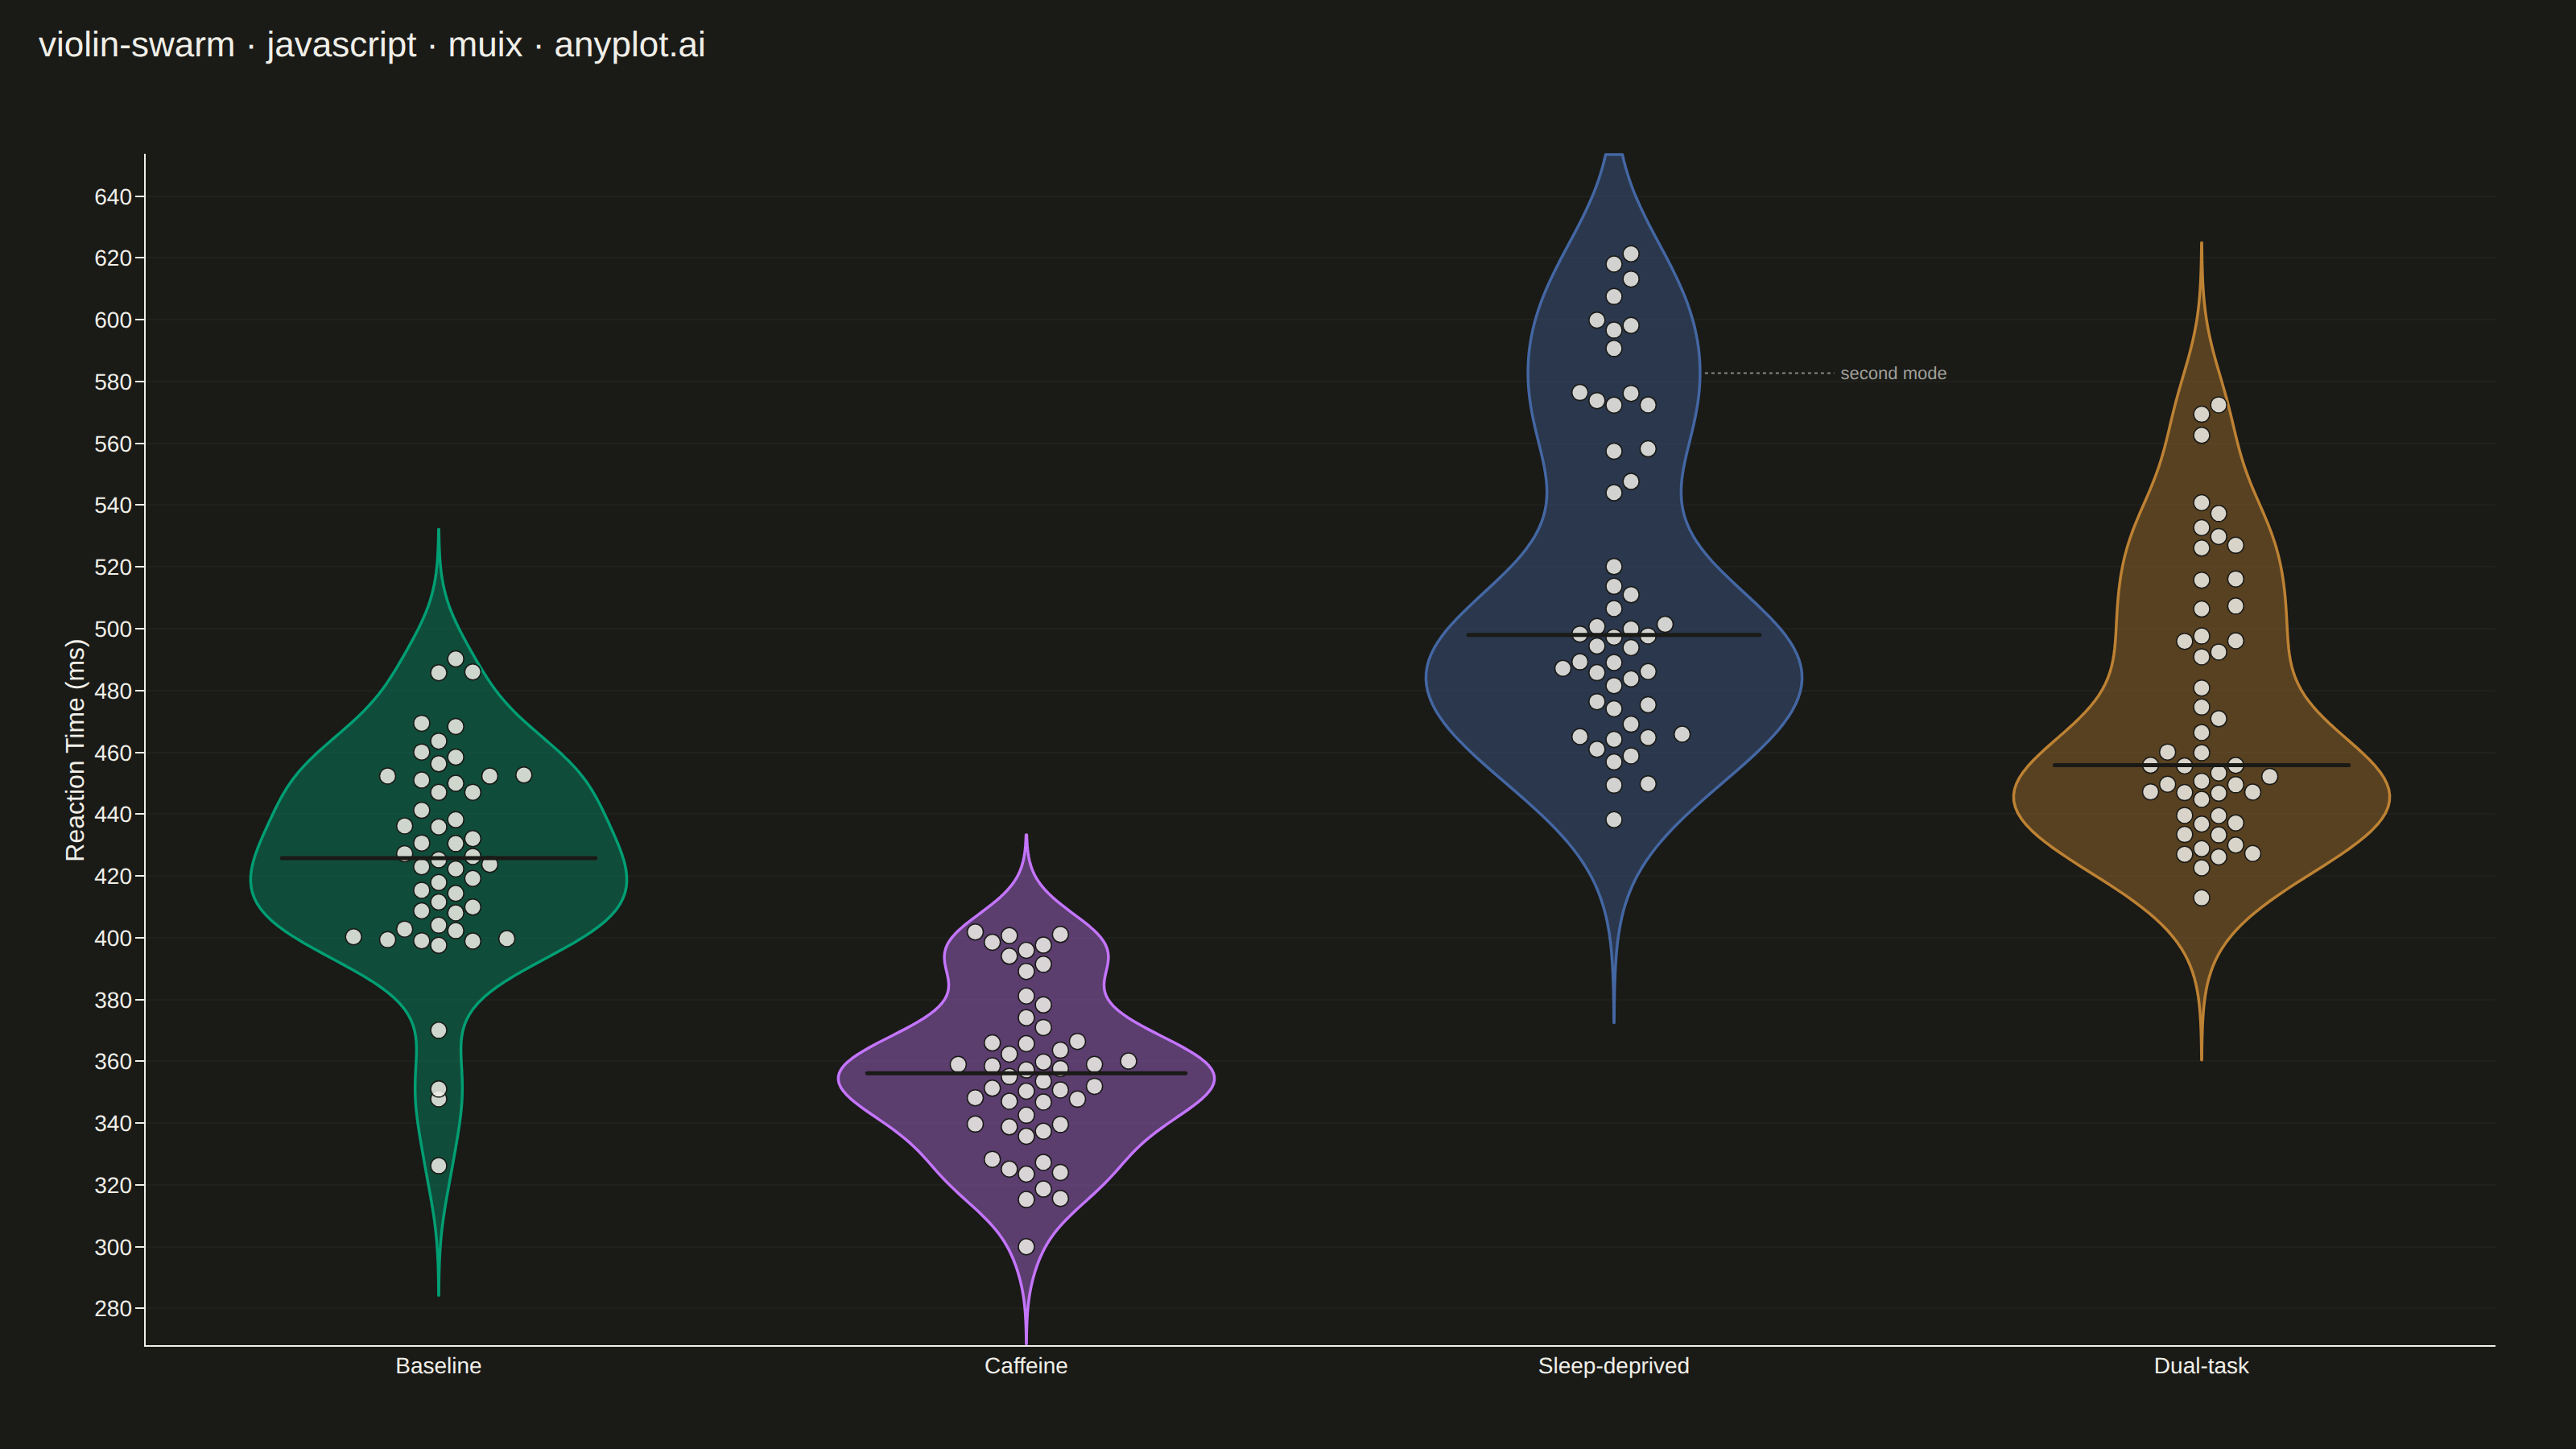
A violin plot with individual data points overlaid as a swarm plot, combining smooth kernel density estimation with raw data visibility. The violin shape shows the distribution density while the swarm points reveal actual observations, enabling viewers to see both the overall distribution pattern and individual data values simultaneously. This hybrid approach provides maximum transparency, showing exactly how many observations exist at each level while maintaining the smooth distribution visualization.
// anyplot.ai
// violin-swarm: Violin Plot with Overlaid Swarm Points
// Library: muix 7.29.1 | JavaScript 22.23.2
// Quality: 92/100 | Created: 2026-09-02
import { ChartContainer } from "@mui/x-charts/ChartContainer";
import { ChartsGrid } from "@mui/x-charts/ChartsGrid";
import { ChartsXAxis } from "@mui/x-charts/ChartsXAxis";
import { ChartsYAxis } from "@mui/x-charts/ChartsYAxis";
import { useXScale, useYScale } from "@mui/x-charts/hooks";

const t = window.ANYPLOT_TOKENS;
const TITLE = "violin-swarm · javascript · muix · anyplot.ai";
const TITLE_HEIGHT = 56;

// --- Data (in-memory, deterministic LCG — no seeded RNG in the browser) -----
function lcg(seed) {
  let state = seed;
  return () => {
    state = (state * 1664525 + 1013904223) % 4294967296;
    return state / 4294967296;
  };
}
function randomNormal(rand, mean, stdDev) {
  const u1 = Math.max(rand(), 1e-9);
  const u2 = rand();
  const z = Math.sqrt(-2 * Math.log(u1)) * Math.cos(2 * Math.PI * u2);
  return mean + z * stdDev;
}
function clamp(v, lo, hi) {
  return Math.min(hi, Math.max(lo, v));
}

const rand = lcg(42);

// Reaction time (ms) across 4 experimental conditions, 50 trials each — each
// condition shaped differently so the swarm points reveal structure (a bimodal
// split, a skewed tail) that summary stats alone would hide.
const N_PER_CONDITION = 50;
const conditions = [
  {
    name: "Baseline",
    sample: () => clamp(randomNormal(rand, 420, 35), 300, 650),
  },
  {
    name: "Caffeine",
    sample: () => clamp(randomNormal(rand, 360, 28), 300, 650),
  },
  {
    // Most trials slow down, but a subset of attention lapses spike much higher.
    name: "Sleep-deprived",
    sample: () =>
      clamp(
        rand() < 0.75
          ? randomNormal(rand, 470, 30)
          : randomNormal(rand, 590, 25),
        300,
        650,
      ),
  },
  {
    // Right-skewed: most trials cluster near a floor, with a long slow tail.
    name: "Dual-task",
    sample: () =>
      clamp(
        430 + 140 * Math.pow(rand(), 2.2) + 8 * randomNormal(rand, 0, 1),
        300,
        650,
      ),
  },
];
const categories = conditions.map((c) => c.name);
const valuesByCategory = conditions.map((c) =>
  Array.from({ length: N_PER_CONDITION }, c.sample),
);

const allValues = valuesByCategory.flat();
const dataMin = Math.min(...allValues);
const dataMax = Math.max(...allValues);
const yPad = (dataMax - dataMin) * 0.1;
const Y_MIN = dataMin - yPad;
const Y_MAX = dataMax + yPad;

// --- Gaussian KDE per condition, Silverman bandwidth, normalized to its own
// peak so violin width encodes shape, not sample count. Each violin's grid is
// clipped to its own local support (data range ± 3 bandwidths) rather than the
// shared Y_MIN..Y_MAX span — otherwise the closed path pinches to near-zero
// width far from the data and the stroke still draws a hairline all the way to
// the axis edges.
const GRID_N = 140;
function stdOf(values) {
  const m = values.reduce((a, b) => a + b, 0) / values.length;
  const variance =
    values.reduce((a, b) => a + (b - m) ** 2, 0) / (values.length - 1);
  return Math.sqrt(variance);
}
function bandwidthOf(values) {
  return 0.9 * stdOf(values) * Math.pow(values.length, -0.2);
}
function kdeAt(values, bandwidth, y) {
  return values.reduce(
    (sum, v) => sum + Math.exp(-0.5 * ((y - v) / bandwidth) ** 2),
    0,
  );
}
const bandwidthByCategory = valuesByCategory.map(bandwidthOf);
const gridByCategory = valuesByCategory.map((values, i) => {
  const bandwidth = bandwidthByCategory[i];
  const lo = Math.max(Y_MIN, Math.min(...values) - 3 * bandwidth);
  const hi = Math.min(Y_MAX, Math.max(...values) + 3 * bandwidth);
  return Array.from(
    { length: GRID_N },
    (_, k) => lo + (k * (hi - lo)) / (GRID_N - 1),
  );
});
const rawDensityByCategory = valuesByCategory.map((values, i) =>
  gridByCategory[i].map((gy) => kdeAt(values, bandwidthByCategory[i], gy)),
);
const peakByCategory = rawDensityByCategory.map((raw) => Math.max(...raw));
const densityByCategory = rawDensityByCategory.map((raw, i) =>
  raw.map((v) => v / peakByCategory[i]),
);
function densityFraction(categoryIndex, value) {
  return (
    kdeAt(
      valuesByCategory[categoryIndex],
      bandwidthByCategory[categoryIndex],
      value,
    ) / peakByCategory[categoryIndex]
  );
}

// --- Median tick (per-violin embellishment) and bimodality detection (data
// storytelling) — both derived straight from the already-computed density
// grid, no extra passes over the raw samples.
function medianOf(values) {
  const sorted = [...values].sort((a, b) => a - b);
  const mid = Math.floor(sorted.length / 2);
  return sorted.length % 2 === 0
    ? (sorted[mid - 1] + sorted[mid]) / 2
    : sorted[mid];
}
const medianByCategory = valuesByCategory.map(medianOf);

// Local maxima of the normalized density curve. Two nearby local maxima are
// only a real second mode if the valley between them dips well below both —
// a shallow-valley shoulder (e.g. plain sampling noise on an otherwise
// unimodal normal) is merged away instead of flagged. That valley-depth
// check is what separates the genuinely bimodal Sleep-deprived condition
// from the merely lumpy KDE of the other, unimodal conditions.
function findPeaks(grid, density, minHeight, minSeparation, valleyRatio) {
  const raw = [];
  for (let k = 1; k < density.length - 1; k += 1) {
    if (
      density[k] >= minHeight &&
      density[k] >= density[k - 1] &&
      density[k] >= density[k + 1]
    ) {
      raw.push({ idx: k, value: grid[k], height: density[k] });
    }
  }
  const merged = [];
  raw.forEach((p) => {
    const close = merged.find(
      (m) => Math.abs(m.value - p.value) < minSeparation,
    );
    if (!close) merged.push(p);
    else if (p.height > close.height) Object.assign(close, p);
  });
  merged.sort((a, b) => a.idx - b.idx);

  let changed = true;
  while (changed && merged.length > 1) {
    changed = false;
    for (let i = 0; i < merged.length - 1; i += 1) {
      const a = merged[i];
      const b = merged[i + 1];
      let valley = Infinity;
      for (let k = a.idx; k <= b.idx; k += 1) {
        valley = Math.min(valley, density[k]);
      }
      if (valley / Math.min(a.height, b.height) > valleyRatio) {
        merged.splice(a.height >= b.height ? i + 1 : i, 1);
        changed = true;
        break;
      }
    }
  }
  return merged;
}
const peaksByCategory = gridByCategory.map((grid, i) =>
  findPeaks(grid, densityByCategory[i], 0.25, 2 * bandwidthByCategory[i], 0.85),
);

// --- Beeswarm packing, width-limited to the violin's own density envelope at
// that value — points spread horizontally but never cross the violin boundary.
// Collisions are resolved in on-screen pixels for even spacing regardless of
// the value axis' scale.
const MARKER_RADIUS = 5;
const MARKER_DIAMETER_PX = MARKER_RADIUS * 2 + 1.5;

function layoutSwarm(categoryIndex, pxPerValue, violinHalfWidthPx) {
  const sorted = [...valuesByCategory[categoryIndex]].sort((a, b) => a - b);
  const placed = [];

  sorted.forEach((value) => {
    const maxOffset = Math.max(
      0,
      densityFraction(categoryIndex, value) * violinHalfWidthPx - MARKER_RADIUS,
    );
    const nearby = placed.filter(
      (p) => Math.abs((value - p.value) * pxPerValue) < MARKER_DIAMETER_PX,
    );

    let offsetPx = 0;
    if (nearby.length > 0) {
      const step = MARKER_DIAMETER_PX * 0.92;
      let found = false;
      for (let k = 0; k < 200 && !found; k += 1) {
        const candidate =
          k === 0
            ? 0
            : (k % 2 === 1 ? Math.ceil(k / 2) : -Math.ceil(k / 2)) * step;
        if (Math.abs(candidate) > maxOffset) continue;
        const clear = nearby.every(
          (p) =>
            Math.hypot(
              candidate - p.offsetPx,
              (value - p.value) * pxPerValue,
            ) >=
            MARKER_DIAMETER_PX * 0.95,
        );
        if (clear) {
          offsetPx = candidate;
          found = true;
        }
      }
      if (!found) offsetPx = clamp(offsetPx, -maxOffset, maxOffset);
    }
    placed.push({ value, offsetPx });
  });

  return placed;
}

// The community package (7.29.1) has no violin/swarm component. A custom SVG
// layer positioned via the chart's own band/linear scale hooks reproduces one
// while staying entirely within the community ChartContainer surface — the
// documented "composition" technique for chart types MUI X doesn't ship.
function ViolinSwarm() {
  const xScale = useXScale();
  const yScale = useYScale();
  const bandwidth = xScale.bandwidth();
  const violinHalfWidthPx = bandwidth * 0.4;
  const pxPerValue = Math.abs(yScale(Y_MAX) - yScale(Y_MIN)) / (Y_MAX - Y_MIN);

  return (
    <g>
      {categories.map((cat, i) => {
        const color = t.palette[i % t.palette.length];
        const center = xScale(cat) + bandwidth / 2;
        const density = densityByCategory[i];
        const catGrid = gridByCategory[i];
        const leftSide = catGrid.map(
          (gy, k) => `${center - density[k] * violinHalfWidthPx},${yScale(gy)}`,
        );
        const rightSide = catGrid
          .map(
            (gy, k) =>
              `${center + density[k] * violinHalfWidthPx},${yScale(gy)}`,
          )
          .reverse();
        const violinPath = `M${leftSide.join(" L")} L${rightSide.join(" L")} Z`;
        const swarm = layoutSwarm(i, pxPerValue, violinHalfWidthPx);

        // Median tick: a short contrasting bar spanning most of the local
        // density envelope, the standard violin-plot embellishment for
        // reading off central tendency without the swarm's raw noise.
        const median = medianByCategory[i];
        const medianHalfWidth =
          densityFraction(i, median) * violinHalfWidthPx * 0.85;
        const medianY = yScale(median);

        // Bimodal callout: when the density curve has a second surviving
        // peak, tag the smaller mode with a short leader + label so the
        // shape the swarm already shows gets called out explicitly.
        const peaks = peaksByCategory[i];
        const isBimodal = peaks.length > 1;
        const minorPeak = isBimodal
          ? [...peaks].sort((a, b) => a.height - b.height)[0]
          : null;

        return (
          <g key={cat}>
            <path
              d={violinPath}
              fill={color}
              fillOpacity={0.38}
              stroke={color}
              strokeWidth={1.75}
              strokeLinejoin="round"
            />
            {swarm.map((p) => (
              <circle
                key={`${cat}-${p.value.toFixed(3)}`}
                cx={center + p.offsetPx}
                cy={yScale(p.value)}
                r={MARKER_RADIUS}
                fill={t.ink}
                fillOpacity={0.85}
                stroke={t.pageBg}
                strokeWidth={0.75}
              />
            ))}
            <line
              x1={center - medianHalfWidth}
              x2={center + medianHalfWidth}
              y1={medianY}
              y2={medianY}
              stroke={t.pageBg}
              strokeWidth={2.5}
              strokeLinecap="round"
            />
            {minorPeak && (
              <g>
                <line
                  x1={center + violinHalfWidthPx * minorPeak.height + 3}
                  x2={center + violinHalfWidthPx + 20}
                  y1={yScale(minorPeak.value)}
                  y2={yScale(minorPeak.value)}
                  stroke={t.inkSoft}
                  strokeWidth={1}
                  strokeDasharray="2,2"
                  opacity={0.7}
                />
                <text
                  x={center + violinHalfWidthPx + 24}
                  y={yScale(minorPeak.value)}
                  dy="0.32em"
                  fontSize={11}
                  fill={t.inkSoft}
                  opacity={0.85}
                >
                  second mode
                </text>
              </g>
            )}
          </g>
        );
      })}
    </g>
  );
}

export default function Chart() {
  const chartHeight = window.ANYPLOT_SIZE.height - TITLE_HEIGHT;

  return (
    <div
      style={{
        width: window.ANYPLOT_SIZE.width,
        height: window.ANYPLOT_SIZE.height,
      }}
    >
      <div
        style={{
          height: TITLE_HEIGHT,
          lineHeight: `${TITLE_HEIGHT}px`,
          paddingLeft: 24,
          fontSize: 22,
          fontWeight: 500,
          color: t.ink,
        }}
      >
        {TITLE}
      </div>
      <ChartContainer
        width={window.ANYPLOT_SIZE.width}
        height={chartHeight}
        series={[]}
        skipAnimation
        margin={{ top: 40, right: 50, bottom: 64, left: 90 }}
        xAxis={[
          {
            id: "conditions",
            data: categories,
            scaleType: "band",
            tickLabelStyle: { fontSize: 14 },
          },
        ]}
        yAxis={[
          {
            id: "reactionTime",
            min: Y_MIN,
            max: Y_MAX,
            label: "Reaction Time (ms)",
            labelStyle: { fontSize: 16 },
            tickLabelStyle: { fontSize: 14 },
            // tickFontSize sizes only the axis-label clearance gap (legacy prop,
            // overridden visually by tickLabelStyle.fontSize above) — bumped so
            // the rotated axis label doesn't collide with the tick numbers.
            tickFontSize: 22,
          },
        ]}
      >
        <ChartsGrid
          horizontal
          sx={{
            "& .MuiChartsGrid-line": {
              stroke: t.grid,
              opacity: 0.2,
            },
          }}
        />
        <ViolinSwarm />
        <ChartsXAxis axisId="conditions" disableTicks />
        <ChartsYAxis axisId="reactionTime" />
      </ChartContainer>
    </div>
  );
}
Runnable source as JSON, for any HTTP client: https://api.anyplot.ai/specs/violin-swarm/muix/code. Any spec id and library id listed in llms-full.txt fit the same URL shape; every URL below is complete and callable.
{
  "spec_id": "violin-swarm",
  "language": "javascript",
  "library": "muix",
  "page": "https://anyplot.ai/violin-swarm/javascript/muix",
  "hub": "https://anyplot.ai/violin-swarm",
  "code_json": "https://api.anyplot.ai/specs/violin-swarm/muix/code",
  "spec_json": "https://api.anyplot.ai/specs/violin-swarm",
  "render_light_png": "https://storage.googleapis.com/anyplot-images/plots/violin-swarm/javascript/muix/plot-light.png",
  "render_dark_png": "https://storage.googleapis.com/anyplot-images/plots/violin-swarm/javascript/muix/plot-dark.png",
  "interactive_light_html": "https://storage.googleapis.com/anyplot-images/plots/violin-swarm/javascript/muix/plot-light.html",
  "interactive_dark_html": "https://storage.googleapis.com/anyplot-images/plots/violin-swarm/javascript/muix/plot-dark.html",
  "quality_score": 92.0,
  "license": "MIT",
  "guide": "https://anyplot.ai/llms.txt"
}
Part of Violin Plot with Overlaid Swarm Points on anyplot.ai.