The same plot in 14 other libraries — JavaScript: Chart.js, D3.js, Apache ECharts, MUI X Charts; Python: Altair, Bokeh, lets-plot, Matplotlib, Plotly, plotnine, Pygal, Seaborn; R: ggplot2; Julia: Makie.jl. Compare all 15 side by side: Violin Plot with Overlaid Swarm Points in Python, R, Julia and JavaScript.
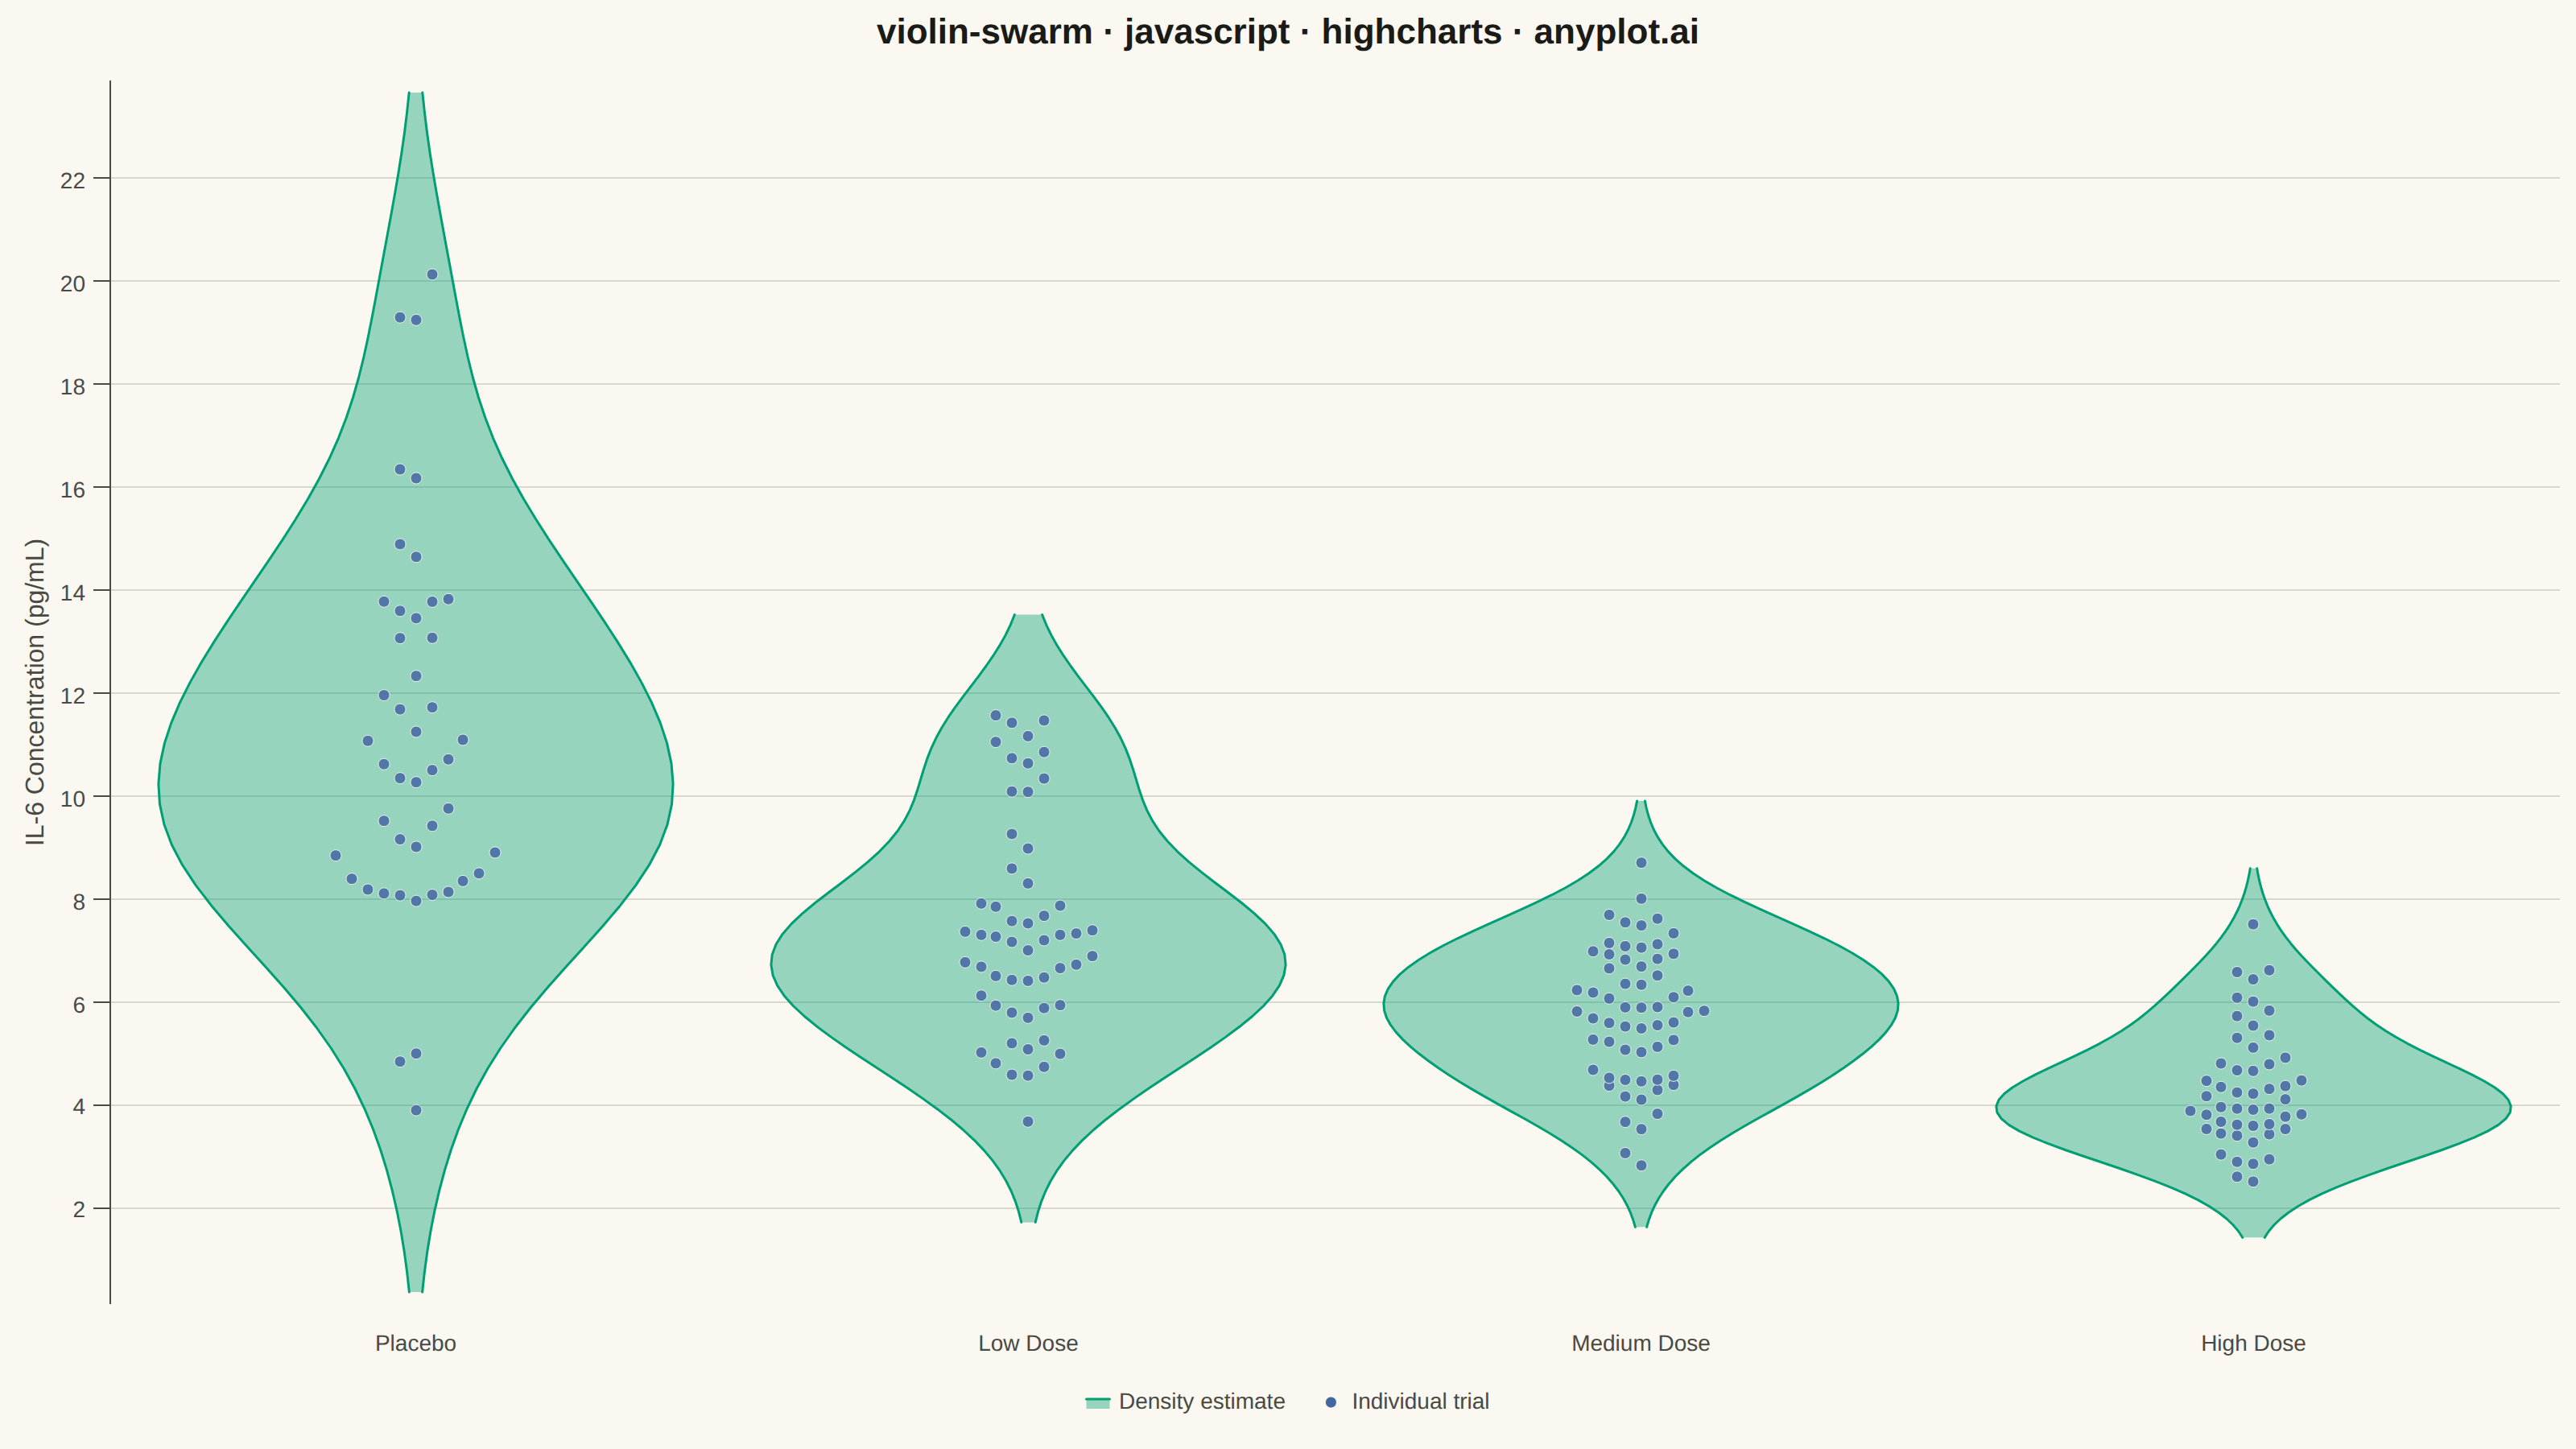
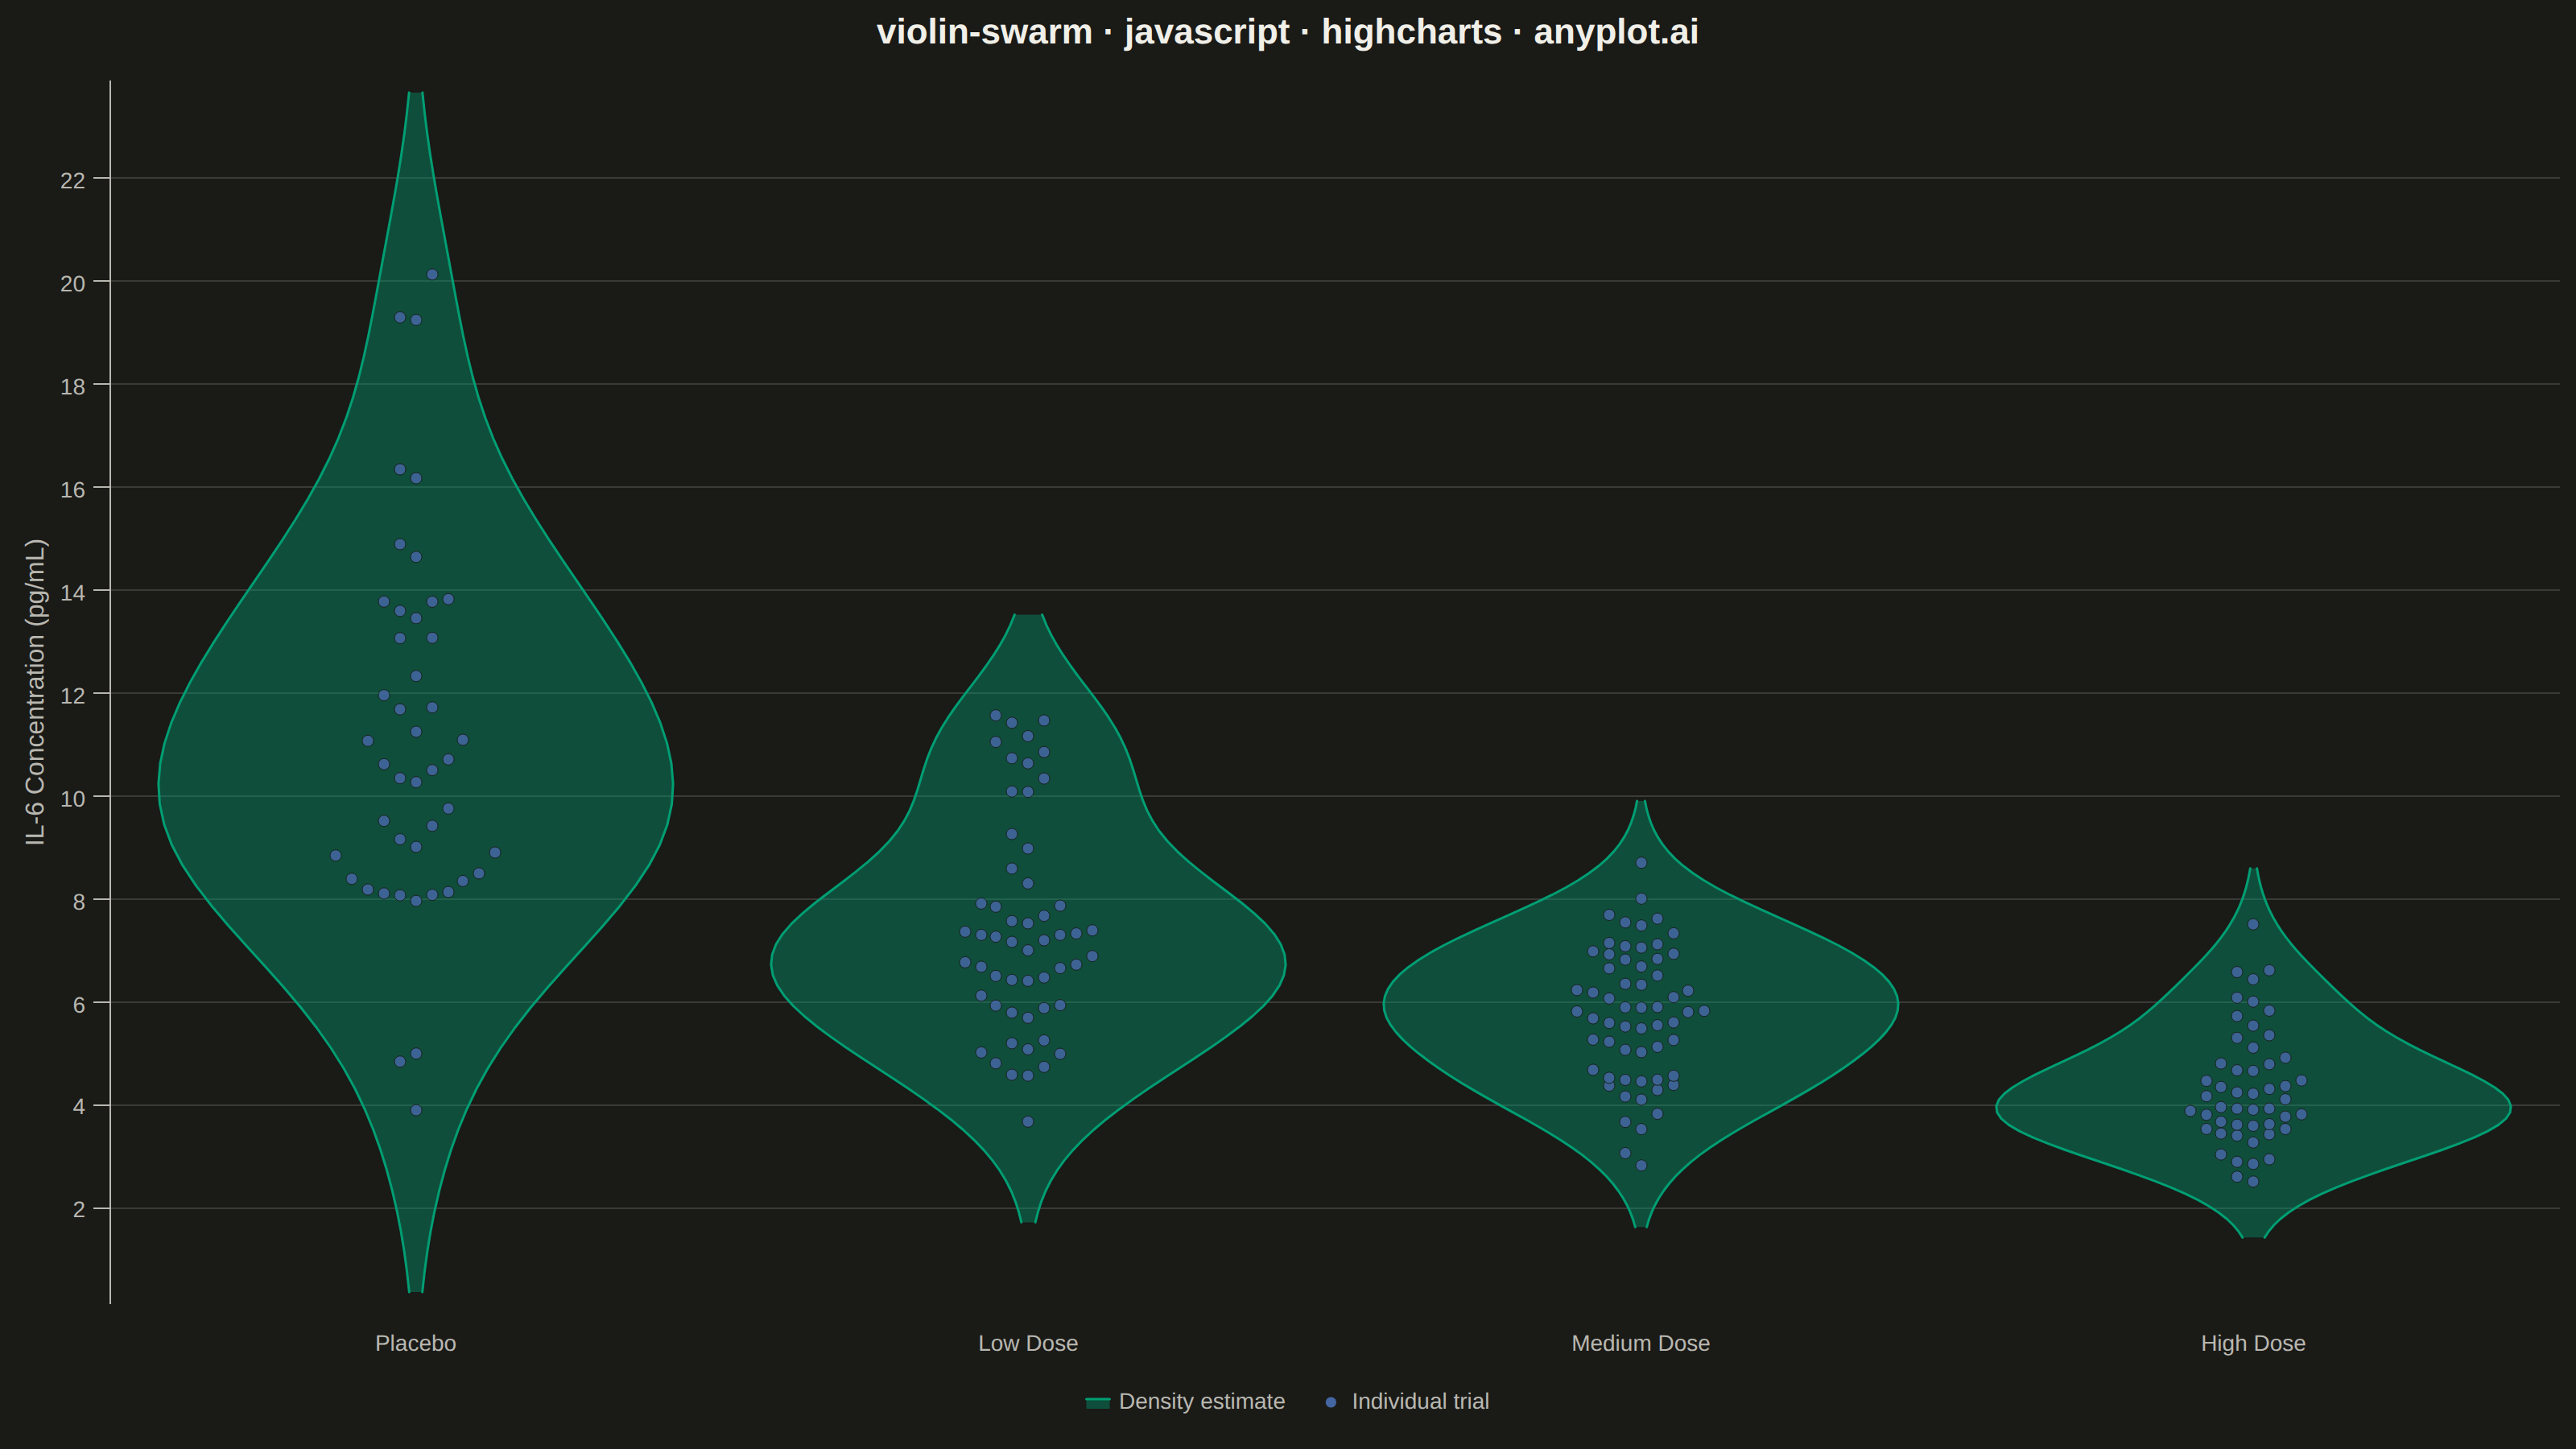
A violin plot with individual data points overlaid as a swarm plot, combining smooth kernel density estimation with raw data visibility. The violin shape shows the distribution density while the swarm points reveal actual observations, enabling viewers to see both the overall distribution pattern and individual data values simultaneously. This hybrid approach provides maximum transparency, showing exactly how many observations exist at each level while maintaining the smooth distribution visualization.
// anyplot.ai
// violin-swarm: Violin Plot with Overlaid Swarm Points
// Library: highcharts 12.6.0 | JavaScript 22.23.2
// Quality: 84/100 | Created: 2026-09-02

const t = window.ANYPLOT_TOKENS;

// --- Deterministic PRNG (LCG) + Box-Muller normal sampler -------------------
function makeLcg(seed) {
  let state = seed;
  return function next() {
    state = (state * 1664525 + 1013904223) % 4294967296;
    return state / 4294967296;
  };
}

function makeNormalSampler(seed) {
  const rand = makeLcg(seed);
  return function normal() {
    const u1 = Math.max(rand(), 1e-9);
    const u2 = rand();
    return Math.sqrt(-2 * Math.log(u1)) * Math.cos(2 * Math.PI * u2);
  };
}

// --- Data: IL-6 biomarker concentration (pg/mL) across a dose-response trial
// Log-normal draws give the right-skewed shape typical of biomarker assays.
const groups = [
  { name: "Placebo", n: 45, mu: 2.3, sigma: 0.35 },
  { name: "Low Dose", n: 55, mu: 2.0, sigma: 0.3 },
  { name: "Medium Dose", n: 60, mu: 1.7, sigma: 0.28 },
  { name: "High Dose", n: 50, mu: 1.4, sigma: 0.25 },
];

const normal = makeNormalSampler(42);
groups.forEach((group) => {
  group.values = Array.from({ length: group.n }, () =>
    Math.exp(group.mu + group.sigma * normal())
  );
});

// --- Gaussian KDE ------------------------------------------------------------
function stdDev(values) {
  const mean = values.reduce((a, b) => a + b, 0) / values.length;
  const variance =
    values.reduce((a, v) => a + (v - mean) ** 2, 0) / (values.length - 1);
  return Math.sqrt(variance);
}

function kernelDensity(values, gridPoints, bandwidth) {
  const norm = 1 / (values.length * bandwidth * Math.sqrt(2 * Math.PI));
  return gridPoints.map((g) => {
    let sum = 0;
    for (const v of values) {
      const u = (g - v) / bandwidth;
      sum += Math.exp(-0.5 * u * u);
    }
    return sum * norm;
  });
}

const VIOLIN_HALF_WIDTH = 0.42;
const GRID_SIZE = 60;

groups.forEach((group, index) => {
  const values = group.values;
  const bandwidth = 1.4 * stdDev(values) * Math.pow(values.length, -0.2);
  const pad = 1.5 * bandwidth;
  const lo = Math.min(...values) - pad;
  const hi = Math.max(...values) + pad;
  const step = (hi - lo) / (GRID_SIZE - 1);
  const grid = Array.from({ length: GRID_SIZE }, (_, i) => lo + i * step);
  const density = kernelDensity(values, grid, bandwidth);
  const maxDensity = Math.max(...density);
  const halfWidths = density.map((d) => (d / maxDensity) * VIOLIN_HALF_WIDTH);

  group.index = index;
  group.grid = grid;
  group.halfWidths = halfWidths;
  group.rightSide = grid.map((v, i) => [v, index + halfWidths[i]]);
  group.leftSide = grid.map((v, i) => [v, index - halfWidths[i]]);
});

// Local half-width at an arbitrary value, via linear interpolation on the grid
function localHalfWidth(group, value) {
  const grid = group.grid;
  if (value <= grid[0]) return group.halfWidths[0];
  if (value >= grid[grid.length - 1]) return group.halfWidths[grid.length - 1];
  for (let i = 0; i < grid.length - 1; i++) {
    if (value >= grid[i] && value <= grid[i + 1]) {
      const frac = (value - grid[i]) / (grid[i + 1] - grid[i]);
      return (
        group.halfWidths[i] + frac * (group.halfWidths[i + 1] - group.halfWidths[i])
      );
    }
  }
  return 0;
}

// --- Swarm layout: bin points by value, spread symmetrically within the
// locally available violin half-width so points stay inside the silhouette.
const SWARM_STEP = 0.026;
const MARGIN = 0.04;

function swarmOffsets(group) {
  const sorted = [...group.values].sort((a, b) => a - b);
  const binWidth = (group.grid[group.grid.length - 1] - group.grid[0]) / 24;
  const bins = [];
  let current = [];
  let binStart = sorted[0];
  sorted.forEach((v) => {
    if (v - binStart > binWidth && current.length > 0) {
      bins.push(current);
      current = [];
      binStart = v;
    }
    current.push(v);
  });
  if (current.length) bins.push(current);

  const points = [];
  bins.forEach((bin) => {
    const center = bin.reduce((a, b) => a + b, 0) / bin.length;
    const available = Math.max(localHalfWidth(group, center) - MARGIN, SWARM_STEP / 2);
    const rawOffsets = bin.map((_, i) => {
      const rank = Math.ceil(i / 2);
      const sign = i % 2 === 0 ? 1 : -1;
      return rank * SWARM_STEP * sign;
    });
    const maxAbs = Math.max(...rawOffsets.map(Math.abs), SWARM_STEP / 2);
    const scale = maxAbs > available ? available / maxAbs : 1;
    bin.forEach((v, i) => {
      points.push([v, group.index + rawOffsets[i] * scale]);
    });
  });
  return points;
}

const swarmData = groups.flatMap((group) => swarmOffsets(group));

// --- Chart -------------------------------------------------------------------
const violinColor = t.palette[0];
const swarmColor = t.palette[2];
const categoryNames = groups.map((g) => g.name);

const violinSeries = groups.flatMap((group, index) => [
  {
    type: "area",
    name: "Density estimate",
    data: group.rightSide,
    threshold: index,
    color: violinColor,
    fillOpacity: 0.4,
    lineWidth: 1.5,
    marker: { enabled: false },
    enableMouseTracking: false,
    showInLegend: index === 0,
  },
  {
    type: "area",
    name: "Density estimate",
    data: group.leftSide,
    threshold: index,
    color: violinColor,
    fillOpacity: 0.4,
    lineWidth: 1.5,
    marker: { enabled: false },
    enableMouseTracking: false,
    showInLegend: false,
  },
]);

Highcharts.chart("container", {
  chart: {
    inverted: true,
    backgroundColor: "transparent",
    animation: false,
    style: { fontFamily: "inherit" },
  },
  credits: { enabled: false },
  title: {
    text: "violin-swarm · javascript · highcharts · anyplot.ai",
    style: { color: t.ink, fontSize: "22px", fontWeight: "600" },
  },
  xAxis: {
    reversed: false,
    title: {
      text: "IL-6 Concentration (pg/mL)",
      style: { color: t.inkSoft, fontSize: "16px" },
    },
    lineColor: t.inkSoft,
    tickColor: t.inkSoft,
    gridLineColor: t.grid,
    gridLineWidth: 1,
    labels: { style: { color: t.inkSoft, fontSize: "14px" } },
  },
  yAxis: {
    title: { text: null },
    min: -0.5,
    max: groups.length - 0.5,
    startOnTick: false,
    endOnTick: false,
    tickPositions: groups.map((_, i) => i),
    gridLineWidth: 0,
    lineColor: t.inkSoft,
    tickColor: t.inkSoft,
    labels: {
      style: { color: t.inkSoft, fontSize: "14px" },
      formatter() {
        return categoryNames[this.value] || "";
      },
    },
  },
  legend: {
    itemStyle: { color: t.inkSoft, fontSize: "14px" },
    itemHoverStyle: { color: t.ink },
  },
  tooltip: {
    formatter() {
      if (this.series.name === "Individual trial") {
        return `${categoryNames[Math.round(this.y)]}<br/>${this.x.toFixed(1)} pg/mL`;
      }
      return false;
    },
  },
  plotOptions: {
    series: { animation: false },
  },
  series: [
    ...violinSeries,
    {
      type: "scatter",
      name: "Individual trial",
      data: swarmData,
      color: swarmColor,
      marker: {
        symbol: "circle",
        radius: 3.5,
        fillColor: swarmColor,
        lineColor: t.pageBg,
        lineWidth: 0.5,
      },
      opacity: 0.85,
    },
  ],
});
Runnable source as JSON, for any HTTP client: https://api.anyplot.ai/specs/violin-swarm/highcharts/code. Any spec id and library id listed in llms-full.txt fit the same URL shape; every URL below is complete and callable.
{
  "spec_id": "violin-swarm",
  "language": "javascript",
  "library": "highcharts",
  "page": "https://anyplot.ai/violin-swarm/javascript/highcharts",
  "hub": "https://anyplot.ai/violin-swarm",
  "code_json": "https://api.anyplot.ai/specs/violin-swarm/highcharts/code",
  "spec_json": "https://api.anyplot.ai/specs/violin-swarm",
  "render_light_png": "https://storage.googleapis.com/anyplot-images/plots/violin-swarm/javascript/highcharts/plot-light.png",
  "render_dark_png": "https://storage.googleapis.com/anyplot-images/plots/violin-swarm/javascript/highcharts/plot-dark.png",
  "interactive_light_html": "https://storage.googleapis.com/anyplot-images/plots/violin-swarm/javascript/highcharts/plot-light.html",
  "interactive_dark_html": "https://storage.googleapis.com/anyplot-images/plots/violin-swarm/javascript/highcharts/plot-dark.html",
  "quality_score": 84.0,
  "license": "MIT",
  "guide": "https://anyplot.ai/llms.txt"
}
Part of Violin Plot with Overlaid Swarm Points on anyplot.ai.