The same plot in 14 other libraries — JavaScript: D3.js, Apache ECharts, Highcharts, MUI X Charts; Python: Altair, Bokeh, lets-plot, Matplotlib, Plotly, plotnine, Pygal, Seaborn; R: ggplot2; Julia: Makie.jl. Compare all 15 side by side: Andrews Curves for Multivariate Data in Python, R, Julia and JavaScript.
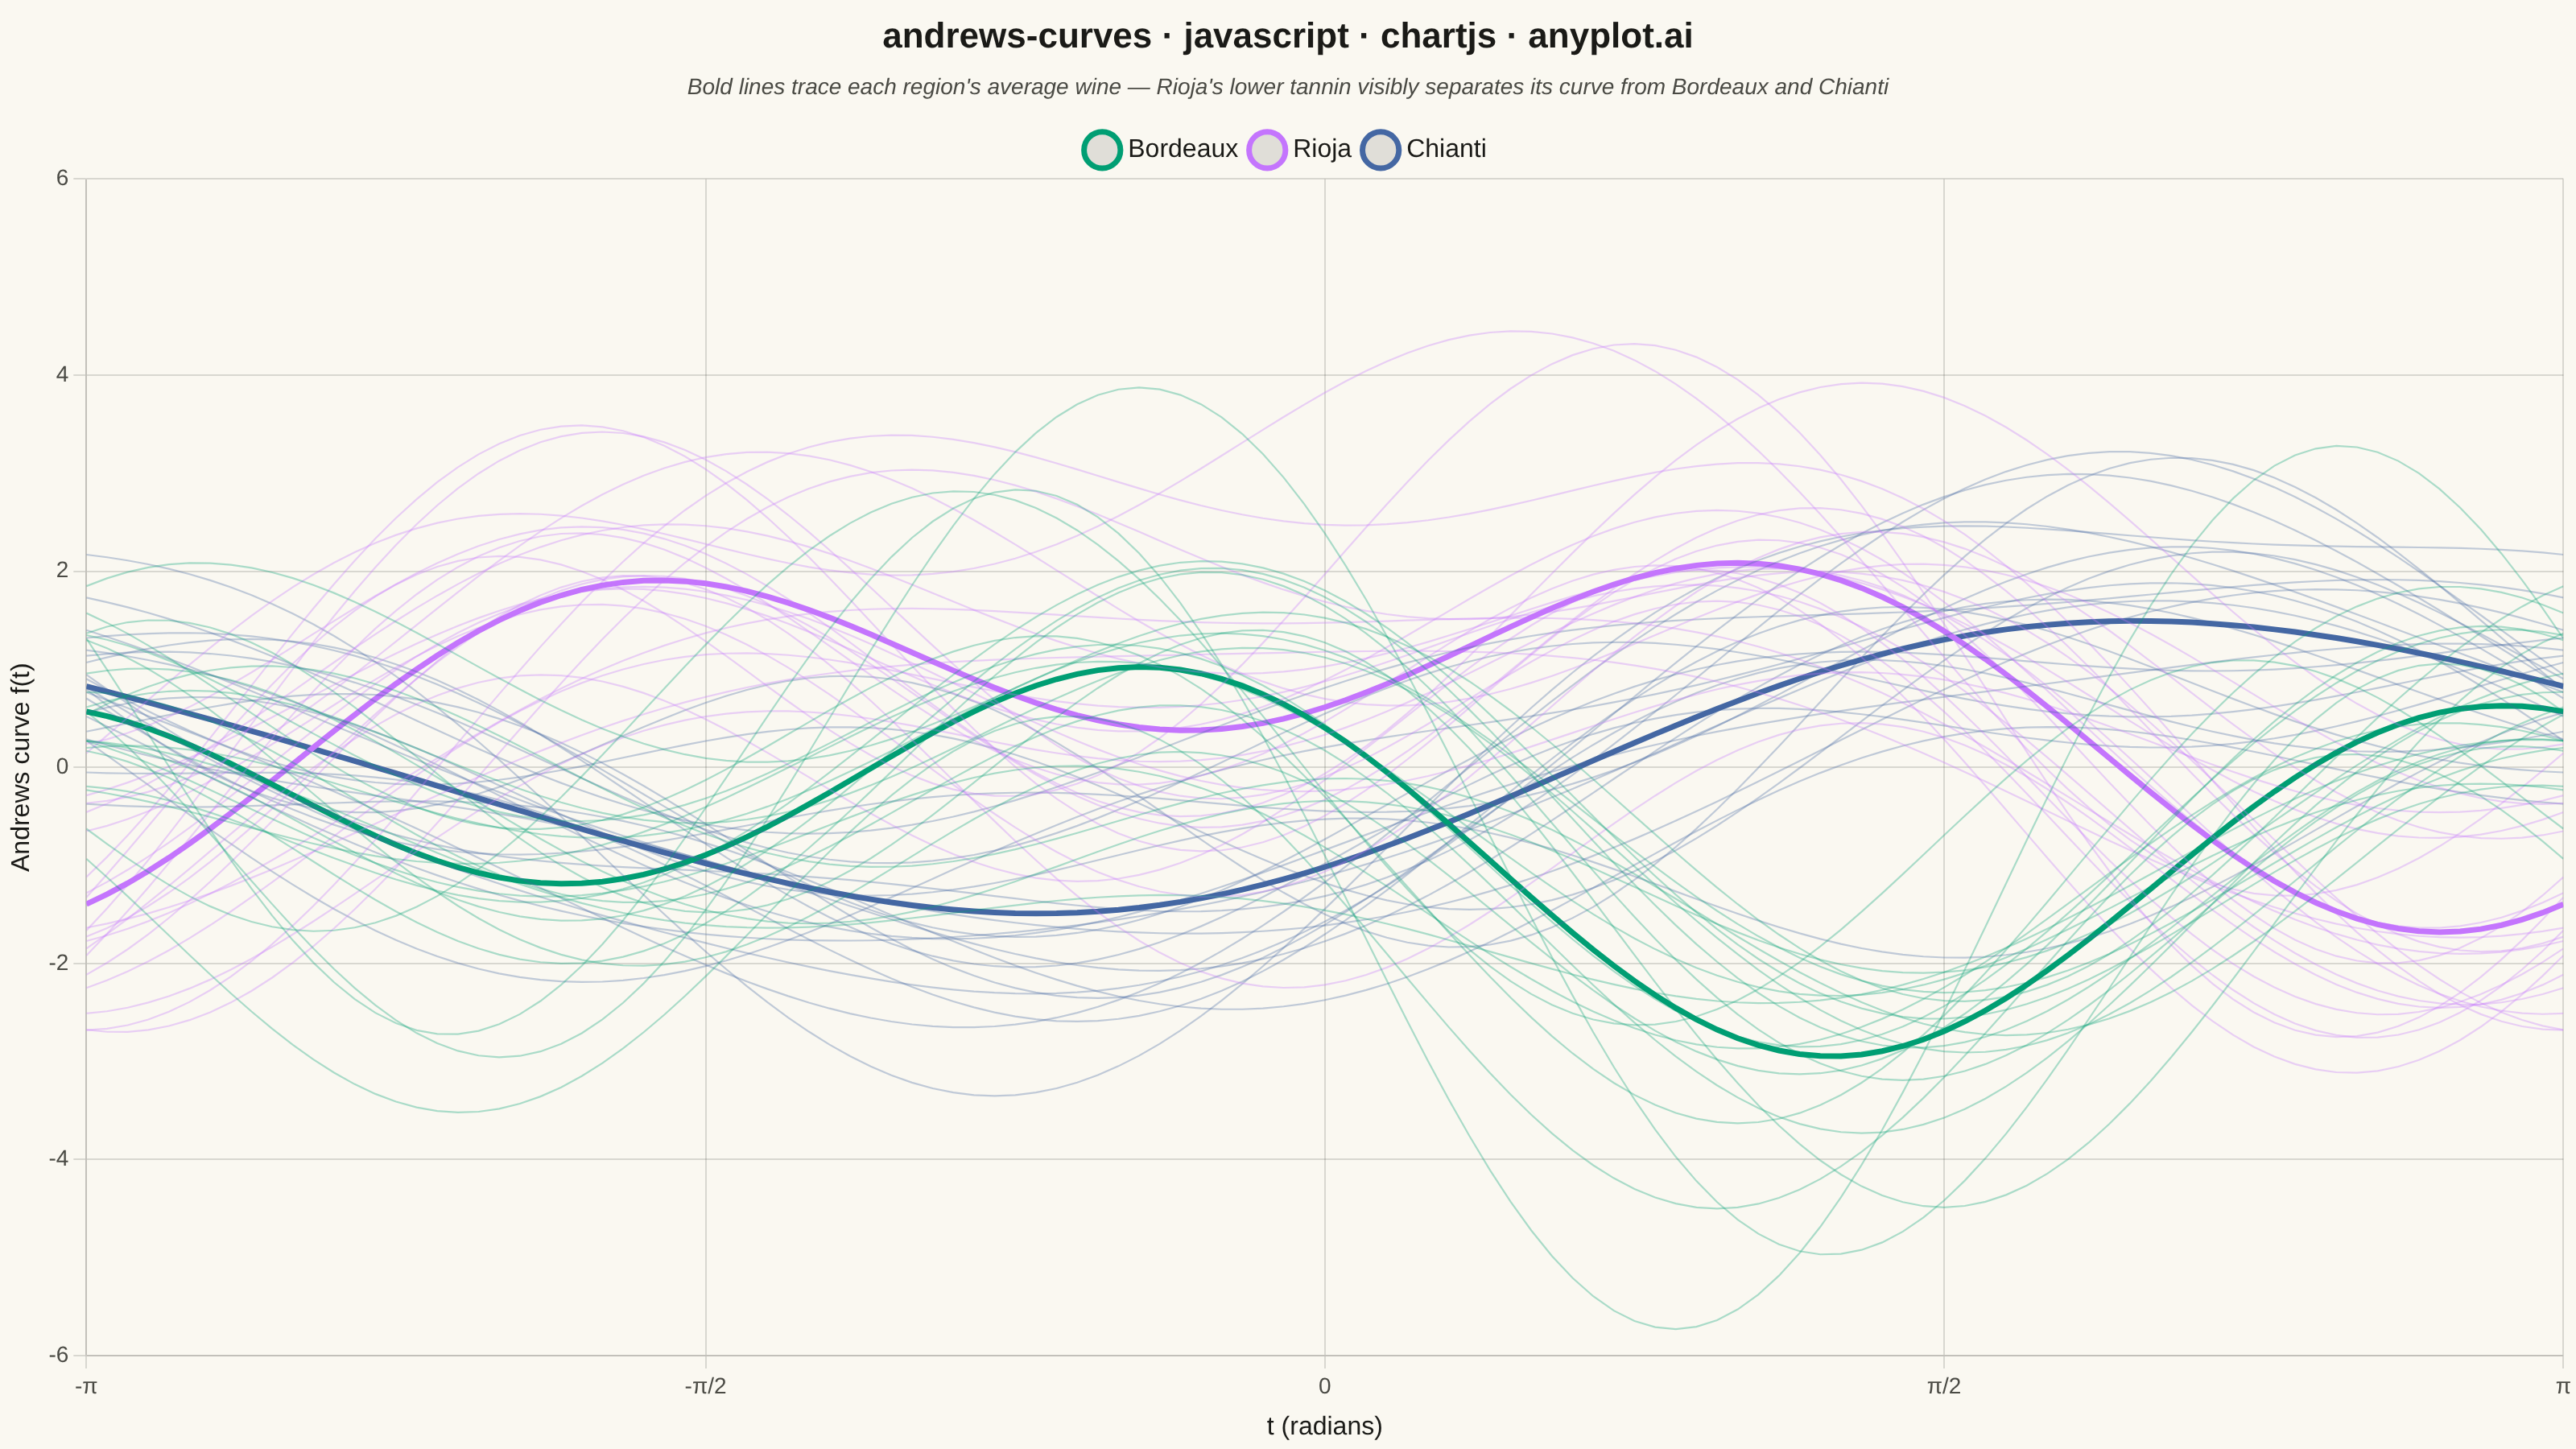
Andrews curves visualization transforms multivariate observations into smooth Fourier series curves. Each data point is represented as a continuous function where variable values become coefficients in a Fourier expansion, producing distinctive wave patterns. This technique enables visual comparison of multivariate patterns, cluster identification, and outlier detection—observations with similar values across variables produce similar curves, while outliers appear as distinctly different patterns.
// anyplot.ai
// andrews-curves: Andrews Curves for Multivariate Data
// Library: chartjs 4.4.7 | JavaScript 22.23.2
// Quality: 92/100 | Created: 2026-09-02

const t = window.ANYPLOT_TOKENS;

// --- Deterministic PRNG (Box-Muller over a fixed-seed LCG) -----------------
let seed = 42;
function uniform() {
  seed = (seed * 1103515245 + 12345) & 0x7fffffff;
  return seed / 0x7fffffff;
}
function normal(mean, std) {
  const u1 = uniform() || 1e-9;
  const u2 = uniform();
  return mean + std * Math.sqrt(-2 * Math.log(u1)) * Math.cos(2 * Math.PI * u2);
}

// --- Data: wines from three regions, five chemistry measurements per wine --
const REGIONS = [
  {
    name: "Bordeaux",
    acidity: [6.5, 0.5],
    sugar: [2.2, 0.4],
    alcohol: [12.8, 0.4],
    pH: [3.3, 0.08],
    tannin: [7.4, 0.5],
  },
  {
    name: "Rioja",
    acidity: [7.8, 0.6],
    sugar: [3.0, 0.5],
    alcohol: [13.5, 0.5],
    pH: [3.5, 0.1],
    tannin: [5.6, 0.5],
  },
  {
    name: "Chianti",
    acidity: [7.1, 0.5],
    sugar: [4.4, 0.7],
    alcohol: [12.2, 0.35],
    pH: [3.4, 0.07],
    tannin: [6.5, 0.45],
  },
];
const WINES_PER_REGION = 20;

const wines = [];
REGIONS.forEach((region) => {
  for (let i = 0; i < WINES_PER_REGION; i++) {
    wines.push({
      region: region.name,
      acidity: normal(...region.acidity),
      sugar: normal(...region.sugar),
      alcohol: normal(...region.alcohol),
      pH: normal(...region.pH),
      tannin: normal(...region.tannin),
    });
  }
});

// Standardize each variable (z-score) so no dimension dominates the curve.
const VARS = ["acidity", "sugar", "alcohol", "pH", "tannin"];
const stats = {};
VARS.forEach((v) => {
  const values = wines.map((w) => w[v]);
  const mean = values.reduce((a, b) => a + b, 0) / values.length;
  const variance = values.reduce((a, b) => a + (b - mean) ** 2, 0) / values.length;
  stats[v] = { mean, std: Math.sqrt(variance) };
});
wines.forEach((w) => {
  VARS.forEach((v) => {
    w[`z_${v}`] = (w[v] - stats[v].mean) / stats[v].std;
  });
});

// --- Andrews curve: f(t) = x1/√2 + x2·sin(t) + x3·cos(t) + x4·sin(2t) + x5·cos(2t)
const N_POINTS = 121;
const T_MIN = -Math.PI;
const T_MAX = Math.PI;
function andrewsCurve(w) {
  const points = [];
  for (let i = 0; i < N_POINTS; i++) {
    const tt = T_MIN + ((T_MAX - T_MIN) * i) / (N_POINTS - 1);
    const f =
      w.z_acidity / Math.SQRT2 +
      w.z_sugar * Math.sin(tt) +
      w.z_alcohol * Math.cos(tt) +
      w.z_pH * Math.sin(2 * tt) +
      w.z_tannin * Math.cos(2 * tt);
    points.push({ x: tt, y: f });
  }
  return points;
}

// Per-region average curve (bold overlay) — the mean of each region's
// standardized variables traces the curve a "typical" wine from that region
// would produce, making the cluster separation an explicit visual claim
// instead of something the reader has to infer from 60 overlapping lines.
const regionMeans = {};
REGIONS.forEach((region) => {
  const regionWines = wines.filter((w) => w.region === region.name);
  const mean = {};
  VARS.forEach((v) => {
    mean[`z_${v}`] = regionWines.reduce((a, w) => a + w[`z_${v}`], 0) / regionWines.length;
  });
  regionMeans[region.name] = mean;
});

function withAlpha(hex, alpha) {
  const r = parseInt(hex.slice(1, 3), 16);
  const g = parseInt(hex.slice(3, 5), 16);
  const b = parseInt(hex.slice(5, 7), 16);
  return `rgba(${r}, ${g}, ${b}, ${alpha})`;
}

const regionColor = {
  Bordeaux: t.palette[0],
  Rioja: t.palette[1],
  Chianti: t.palette[2],
};

const individualDatasets = wines.map((w) => ({
  label: w.region,
  data: andrewsCurve(w),
  borderColor: withAlpha(regionColor[w.region], 0.32),
  borderWidth: 1.1,
  pointRadius: 0,
  tension: 0,
  fill: false,
  order: 0,
}));

// Bold, fully-opaque region-mean curves drawn on top (higher `order`) of the
// translucent individual curves, and placed first so the legend-dedup filter
// below picks their solid swatch instead of a faint individual one.
const meanDatasets = REGIONS.map((region) => ({
  label: region.name,
  data: andrewsCurve(regionMeans[region.name]),
  borderColor: regionColor[region.name],
  borderWidth: 3.5,
  pointRadius: 0,
  tension: 0,
  fill: false,
  order: 1,
}));

const datasets = [...meanDatasets, ...individualDatasets];

// --- Mount -------------------------------------------------------------------
const canvas = document.createElement("canvas");
document.getElementById("container").appendChild(canvas);

// --- Chart ---------------------------------------------------------------
new Chart(canvas, {
  type: "line",
  data: { datasets },
  options: {
    responsive: true,
    maintainAspectRatio: false,
    animation: false,
    plugins: {
      title: {
        display: true,
        text: "andrews-curves · javascript · chartjs · anyplot.ai",
        color: t.ink,
        font: { size: 22 },
      },
      subtitle: {
        display: true,
        text: "Bold lines trace each region's average wine — Rioja's lower tannin visibly separates its curve from Bordeaux and Chianti",
        color: t.inkSoft,
        font: { size: 14, style: "italic" },
        padding: { bottom: 12 },
      },
      legend: {
        labels: {
          color: t.ink,
          font: { size: 16 },
          usePointStyle: true,
          filter: (item, data) =>
            data.datasets.findIndex((d) => d.label === item.text) === item.datasetIndex,
        },
      },
      tooltip: { enabled: false },
    },
    scales: {
      x: {
        type: "linear",
        min: T_MIN,
        max: T_MAX,
        ticks: {
          color: t.inkSoft,
          font: { size: 14 },
          stepSize: Math.PI / 2,
          callback: (value) => {
            const ratio = value / Math.PI;
            if (Math.abs(ratio) < 0.01) return "0";
            if (Math.abs(ratio - 1) < 0.01) return "π";
            if (Math.abs(ratio + 1) < 0.01) return "-π";
            if (Math.abs(ratio - 0.5) < 0.01) return "π/2";
            if (Math.abs(ratio + 0.5) < 0.01) return "-π/2";
            return "";
          },
        },
        grid: { color: t.grid },
        title: { display: true, text: "t (radians)", color: t.ink, font: { size: 16 } },
      },
      y: {
        ticks: { color: t.inkSoft, font: { size: 14 } },
        grid: { color: t.grid },
        title: { display: true, text: "Andrews curve f(t)", color: t.ink, font: { size: 16 } },
      },
    },
  },
});
Runnable source as JSON, for any HTTP client: https://api.anyplot.ai/specs/andrews-curves/chartjs/code. Any spec id and library id listed in llms-full.txt fit the same URL shape; every URL below is complete and callable.
{
  "spec_id": "andrews-curves",
  "language": "javascript",
  "library": "chartjs",
  "page": "https://anyplot.ai/andrews-curves/javascript/chartjs",
  "hub": "https://anyplot.ai/andrews-curves",
  "code_json": "https://api.anyplot.ai/specs/andrews-curves/chartjs/code",
  "spec_json": "https://api.anyplot.ai/specs/andrews-curves",
  "render_light_png": "https://storage.googleapis.com/anyplot-images/plots/andrews-curves/javascript/chartjs/plot-light.png",
  "render_dark_png": "https://storage.googleapis.com/anyplot-images/plots/andrews-curves/javascript/chartjs/plot-dark.png",
  "interactive_light_html": "https://storage.googleapis.com/anyplot-images/plots/andrews-curves/javascript/chartjs/plot-light.html",
  "interactive_dark_html": "https://storage.googleapis.com/anyplot-images/plots/andrews-curves/javascript/chartjs/plot-dark.html",
  "quality_score": 92.0,
  "license": "MIT",
  "guide": "https://anyplot.ai/llms.txt"
}
Part of Andrews Curves for Multivariate Data on anyplot.ai.