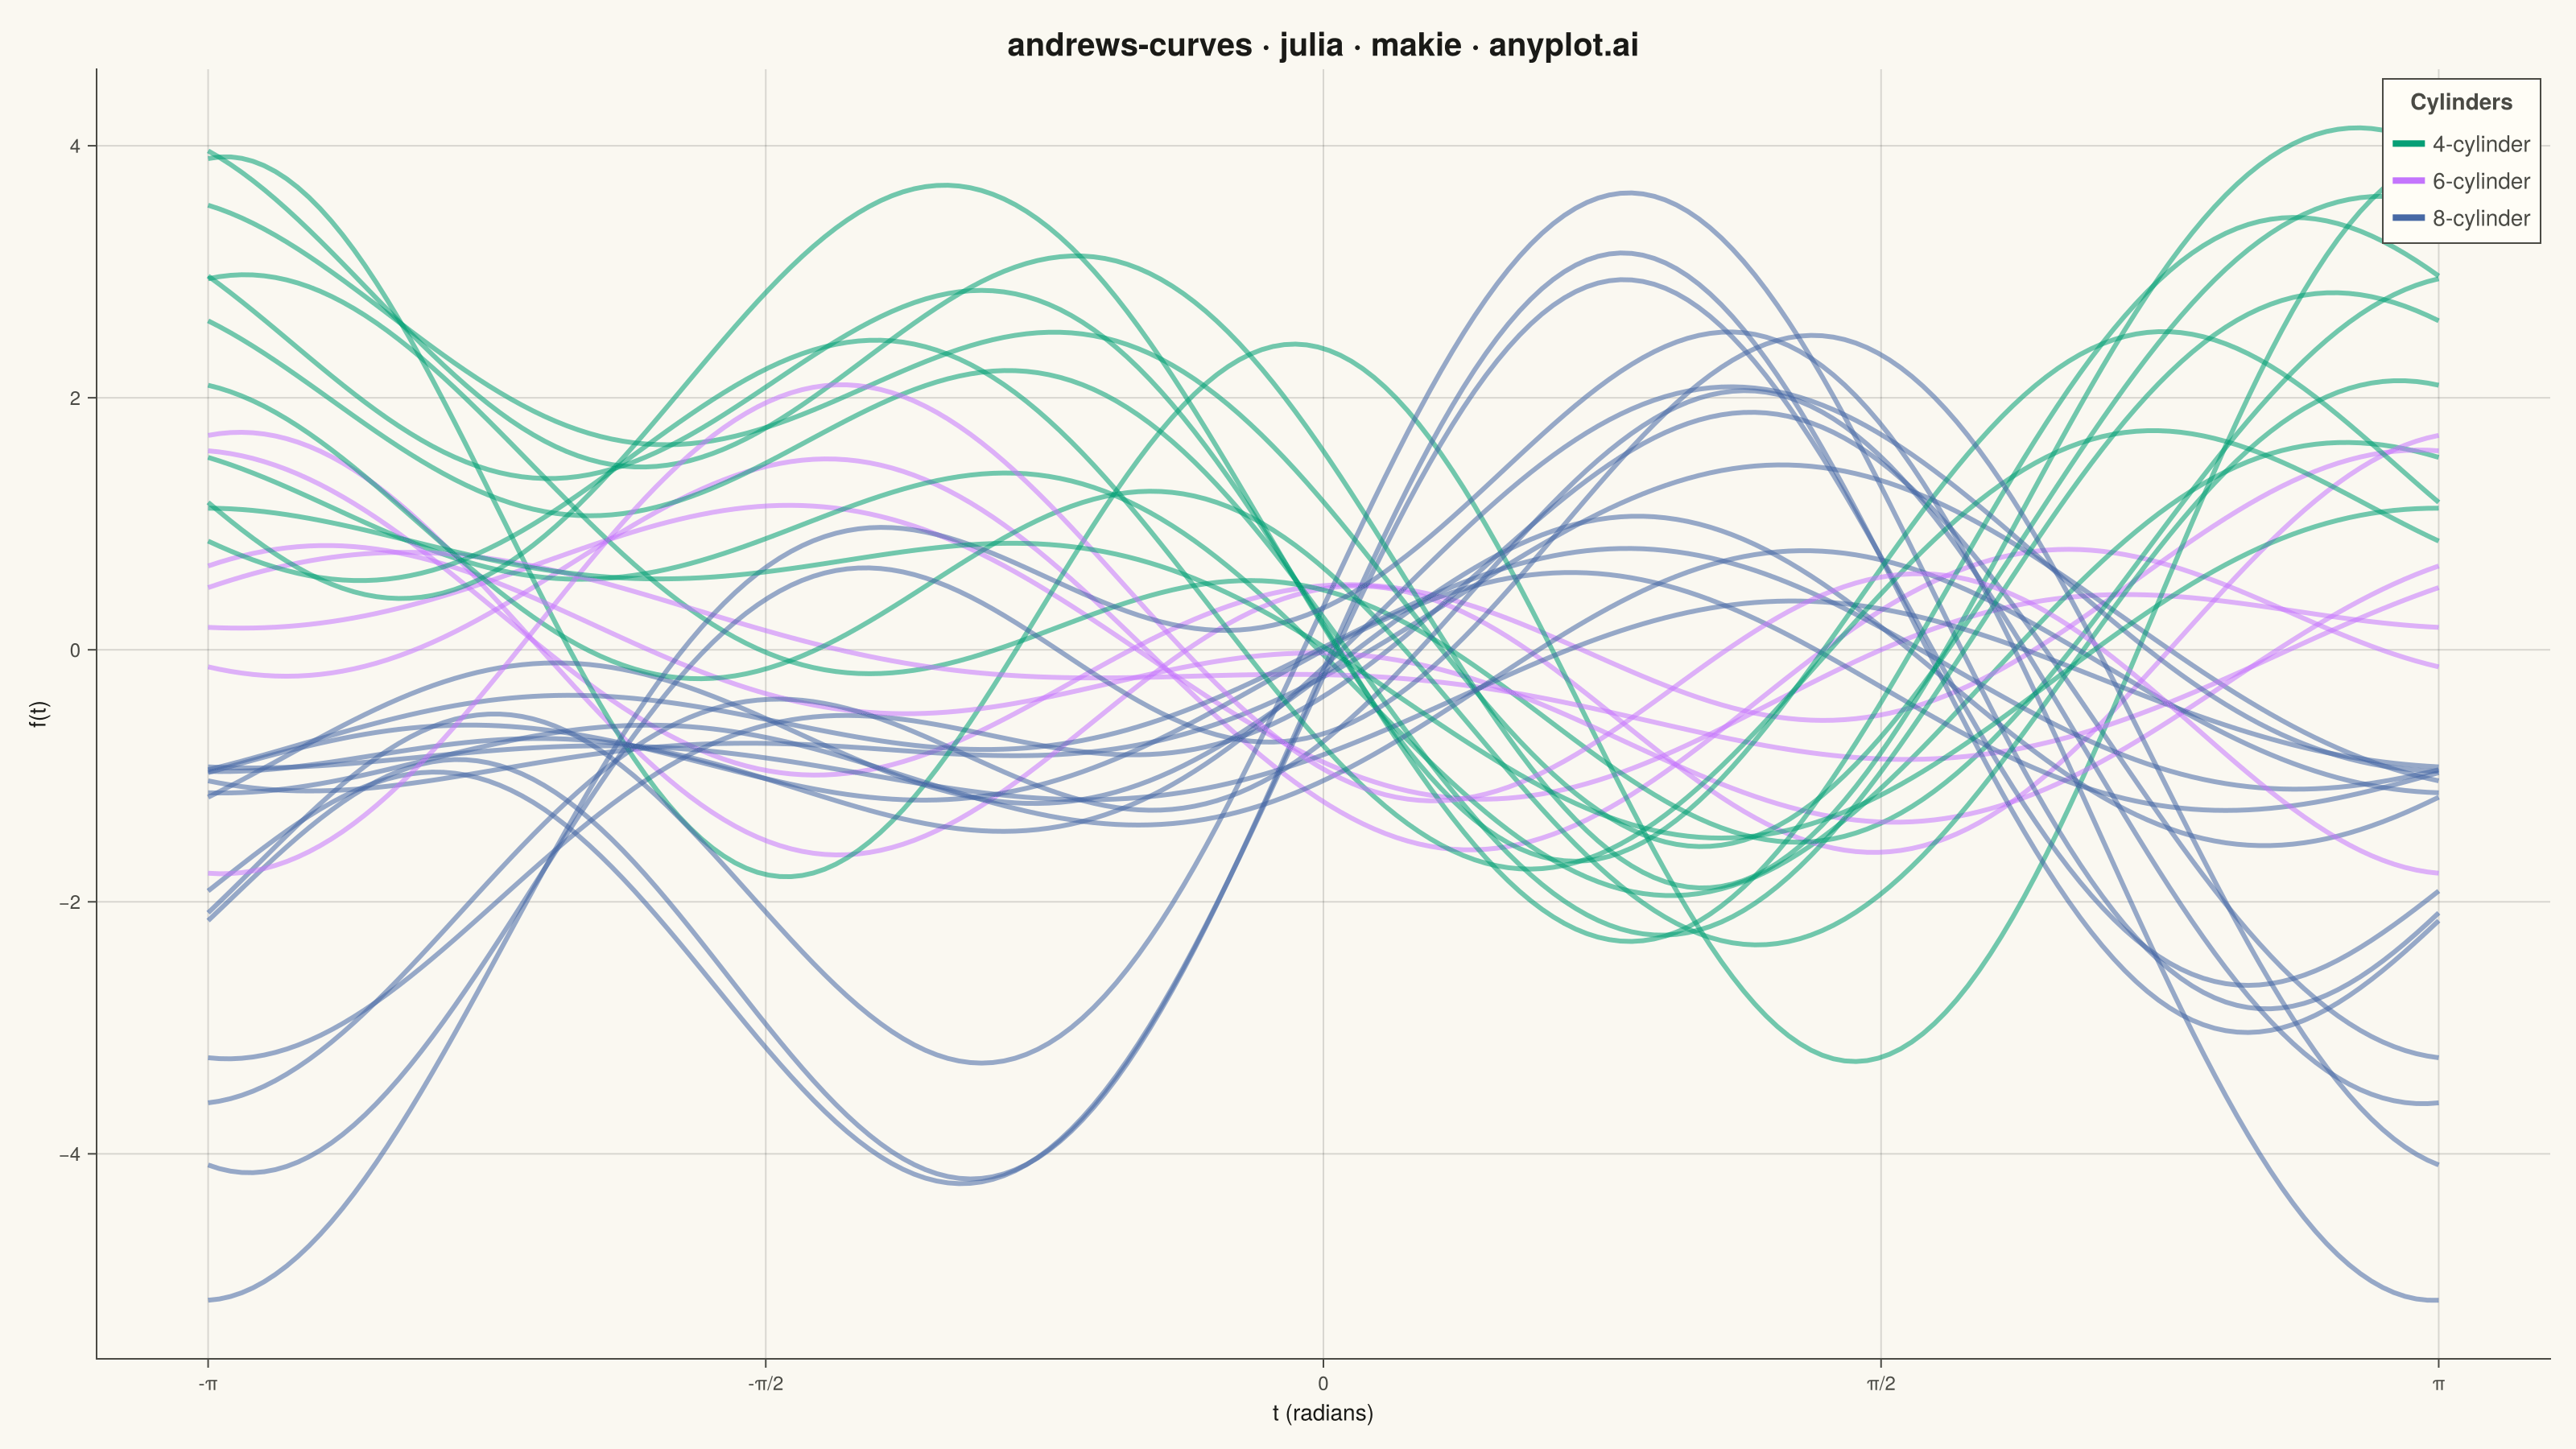
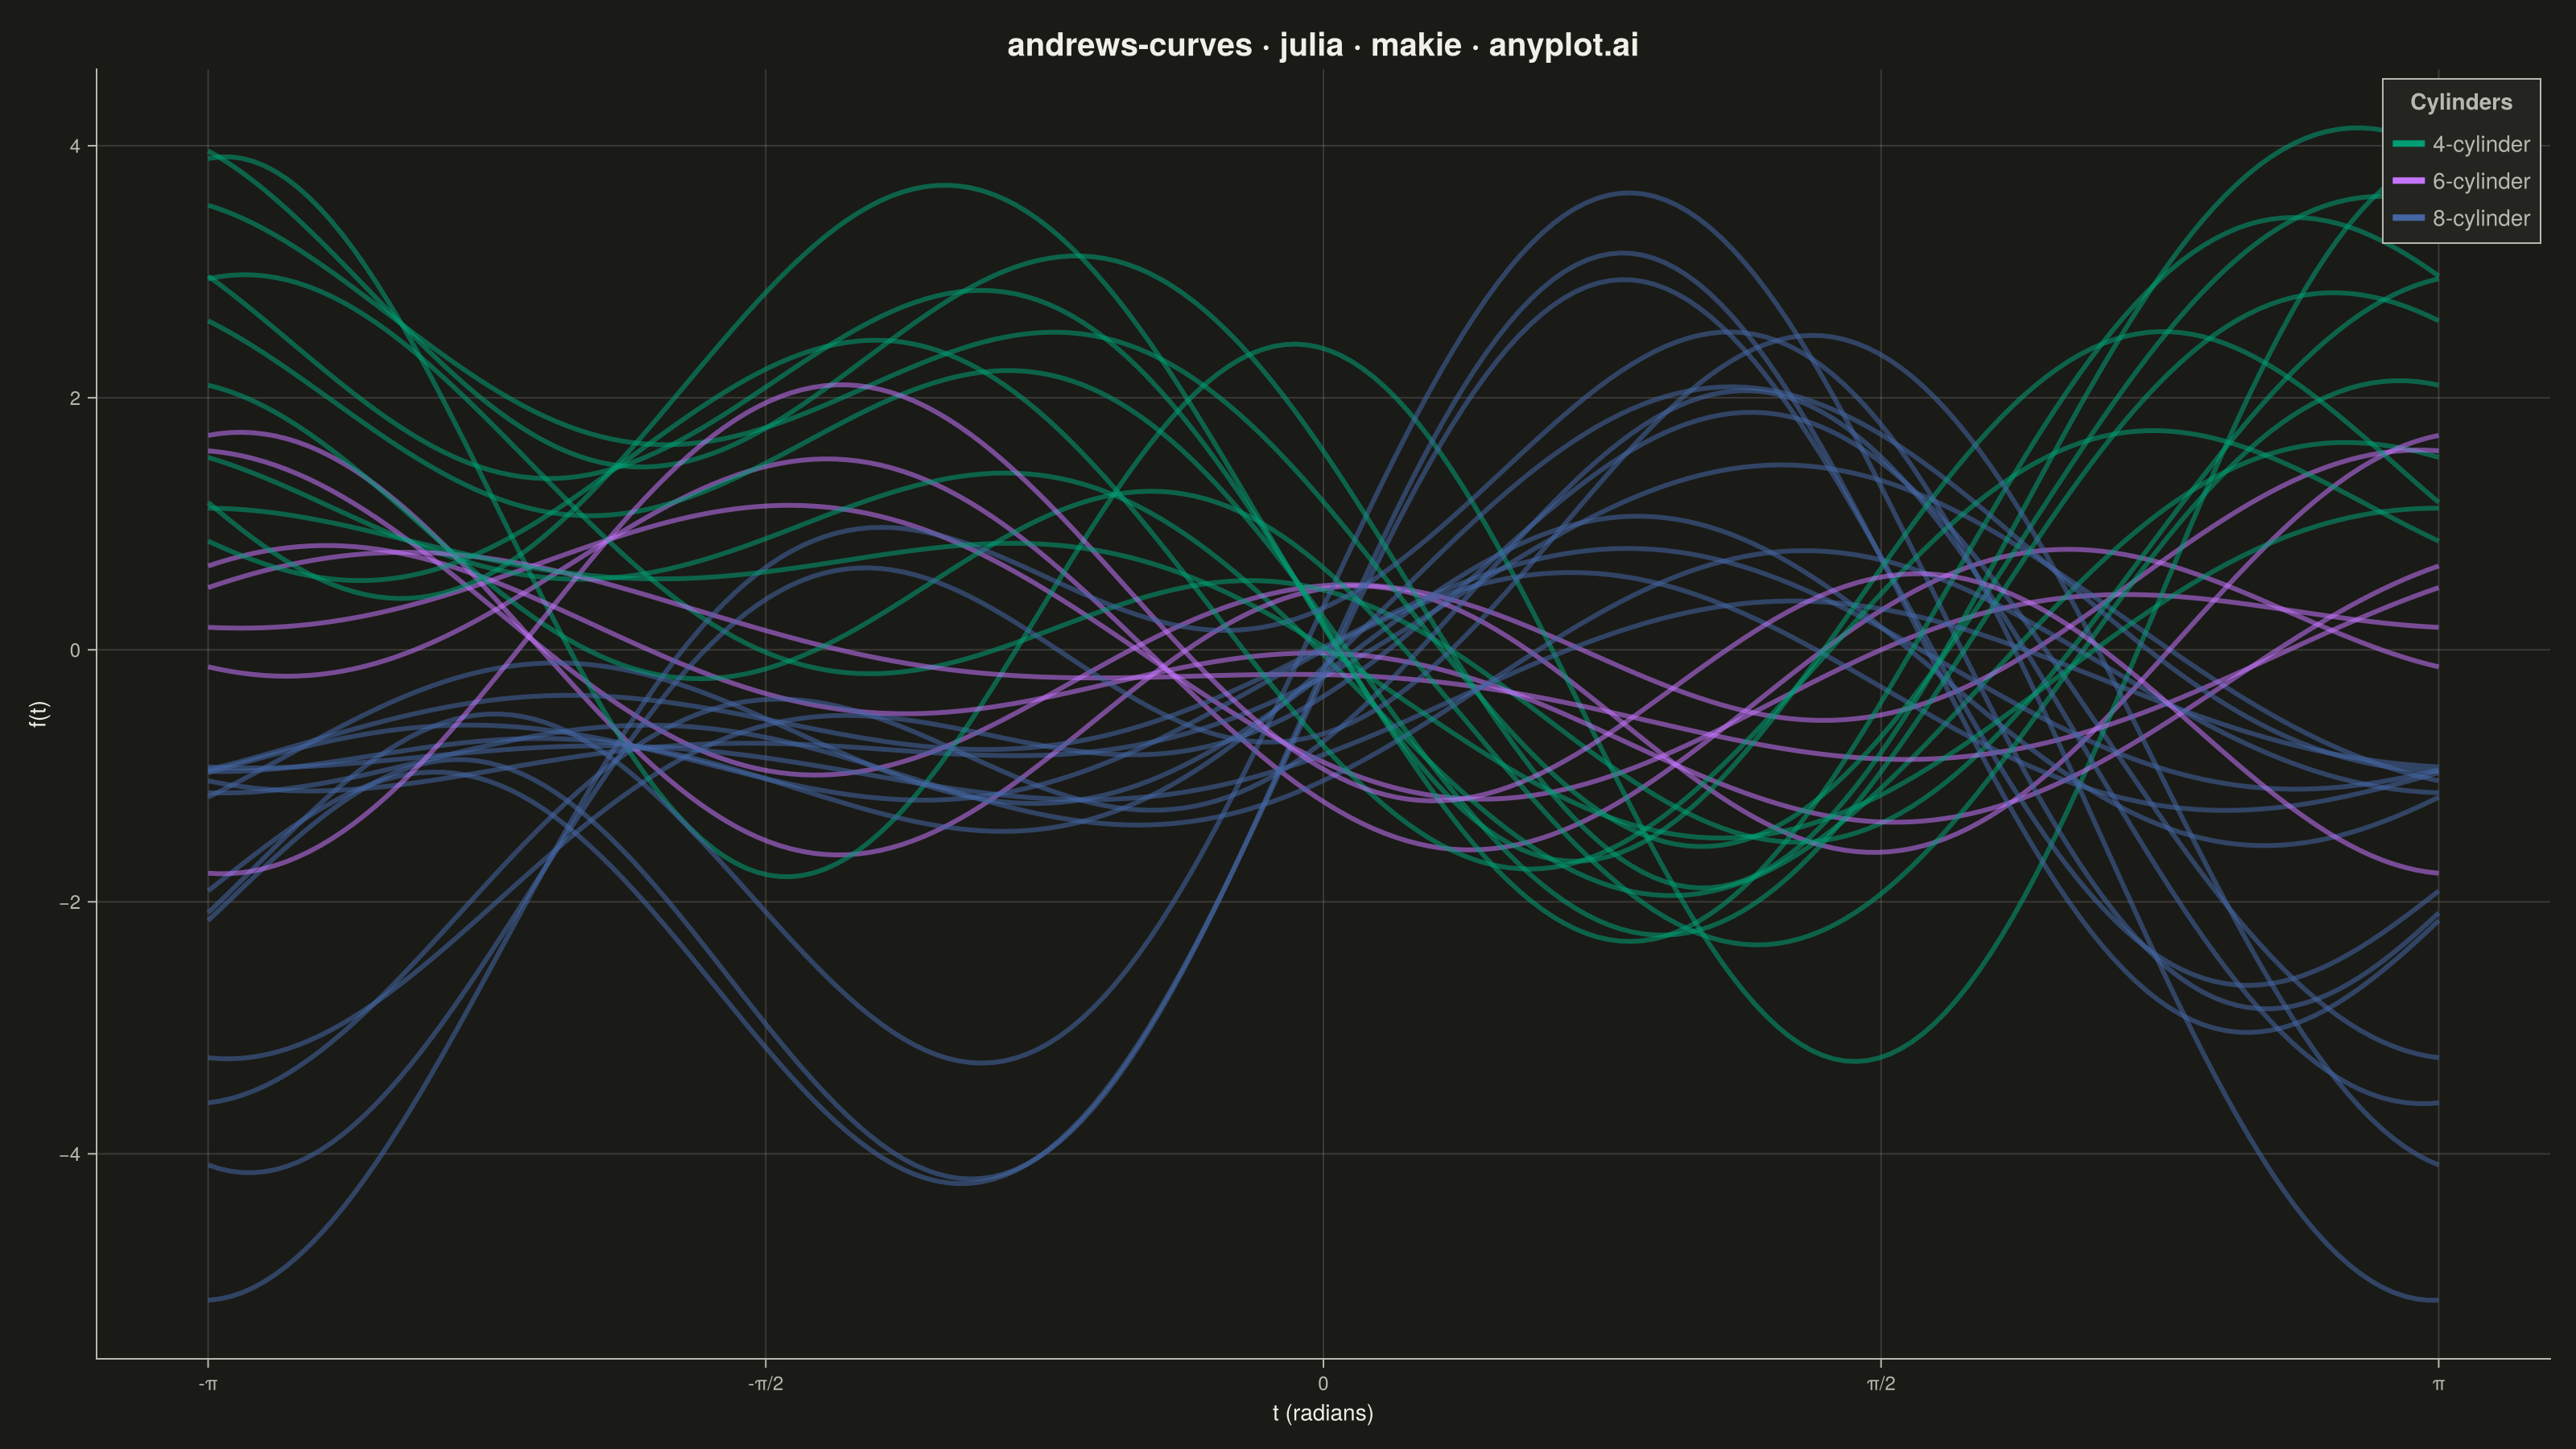
The same plot in 14 other libraries — Python: Altair, Bokeh, lets-plot, Matplotlib, Plotly, plotnine, Pygal, Seaborn; R: ggplot2; JavaScript: Chart.js, D3.js, Apache ECharts, Highcharts, MUI X Charts. Compare all 15 side by side: Andrews Curves for Multivariate Data in Python, R, Julia and JavaScript.
Andrews curves visualization transforms multivariate observations into smooth Fourier series curves. Each data point is represented as a continuous function where variable values become coefficients in a Fourier expansion, producing distinctive wave patterns. This technique enables visual comparison of multivariate patterns, cluster identification, and outlier detection—observations with similar values across variables produce similar curves, while outliers appear as distinctly different patterns.
# anyplot.ai
# andrews-curves: Andrews Curves for Multivariate Data
# Library: makie 0.21.9 | Julia 1.11.9
# Quality: 81/100 | Created: 2026-09-02

using CairoMakie
using RDatasets
using DataFrames
using Statistics
using Random

Random.seed!(42)

# --- Theme tokens -------------------------------------------------------
THEME = get(ENV, "ANYPLOT_THEME", "light")
PAGE_BG = THEME == "light" ? colorant"#FAF8F1" : colorant"#1A1A17"
ELEVATED_BG = THEME == "light" ? colorant"#FFFDF6" : colorant"#242420"
INK = THEME == "light" ? colorant"#1A1A17" : colorant"#F0EFE8"
INK_SOFT = THEME == "light" ? colorant"#4A4A44" : colorant"#B8B7B0"

IMPRINT_PALETTE = [
    colorant"#009E73",  # 1 — 4-cylinder
    colorant"#C475FD",  # 2 — 6-cylinder
    colorant"#4467A3",  # 3 — 8-cylinder
]

# --- Data -----------------------------------------------------------------
# Motor Trend car specs: five performance/weight measurements per car,
# grouped by cylinder count to reveal how engine class separates in shape.
cars = RDatasets.dataset("datasets", "mtcars")
features = [:MPG, :Disp, :HP, :WT, :QSec]
X = Matrix{Float64}(cars[:, features])

# Normalize each variable to unit scale so no single measurement dominates
means = mean(X; dims = 1)
stds = std(X; dims = 1)
X_scaled = (X .- means) ./ stds

cylinder_groups = [4, 6, 8]
group_labels = ["4-cylinder", "6-cylinder", "8-cylinder"]
group_idx = [findfirst(==(c), cylinder_groups) for c in cars.Cyl]

# --- Andrews curve transform ------------------------------------------------
# f(t) = x1/sqrt(2) + x2*sin(t) + x3*cos(t) + x4*sin(2t) + x5*cos(2t) + ...
t = collect(range(-pi, pi; length = 200))
n_features = length(features)
basis = zeros(length(t), n_features)
basis[:, 1] .= 1 / sqrt(2)
for j in 2:n_features
    m = j - 1
    freq = ceil(Int, m / 2)
    basis[:, j] = isodd(m) ? sin.(freq .* t) : cos.(freq .* t)
end
curves = X_scaled * basis'  # (n_cars, length(t))

# Outlier detection: the car whose normalized feature vector sits farthest
# from the group centroid produces the most visually distinct curve.
distances = vec(sqrt.(sum(X_scaled .^ 2; dims = 2)))
outlier_idx = argmax(distances)
outlier_model = cars.Model[outlier_idx]
outlier_t = t[argmax(abs.(curves[outlier_idx, :]))]
outlier_y = curves[outlier_idx, argmax(abs.(curves[outlier_idx, :]))]

# --- Plot -------------------------------------------------------------------
fig = Figure(size = (1600, 900), fontsize = 14, backgroundcolor = PAGE_BG)

ax = Axis(
    fig[1, 1];
    title = "andrews-curves · julia · makie · anyplot.ai",
    titlesize = 20,
    titlecolor = INK,
    xlabel = "t (radians)",
    ylabel = "f(t)",
    xlabelsize = 14,
    ylabelsize = 14,
    xlabelcolor = INK,
    ylabelcolor = INK,
    xticklabelsize = 12,
    yticklabelsize = 12,
    xticklabelcolor = INK_SOFT,
    yticklabelcolor = INK_SOFT,
    xtickcolor = INK_SOFT,
    ytickcolor = INK_SOFT,
    backgroundcolor = PAGE_BG,
    topspinevisible = false,
    rightspinevisible = false,
    leftspinecolor = INK_SOFT,
    bottomspinecolor = INK_SOFT,
    xgridcolor = RGBAf(INK.r, INK.g, INK.b, 0.15),
    ygridcolor = RGBAf(INK.r, INK.g, INK.b, 0.15),
    xminorgridvisible = false,
    yminorgridvisible = false,
    xticks = (
        [-pi, -pi / 2, 0, pi / 2, pi],
        ["-π", "-π/2", "0", "π/2", "π"],
    ),
)

for i in 1:size(curves, 1)
    i == outlier_idx && continue
    lines!(
        ax, t, curves[i, :];
        color = IMPRINT_PALETTE[group_idx[i]],
        linewidth = 3.0,
        alpha = 0.4,
    )
end

# Draw the outlier last with a soft ink halo underneath so it reads as a
# distinct focal curve against the dense overlapping cluster.
lines!(ax, t, curves[outlier_idx, :]; color = (INK, 0.5), linewidth = 6.0)
lines!(
    ax, t, curves[outlier_idx, :];
    color = IMPRINT_PALETTE[group_idx[outlier_idx]],
    linewidth = 3.0,
    alpha = 1.0,
)
scatter!(
    ax, [outlier_t], [outlier_y];
    color = IMPRINT_PALETTE[group_idx[outlier_idx]],
    strokecolor = INK,
    strokewidth = 1.5,
    markersize = 14,
)
text!(
    ax, outlier_t, outlier_y;
    text = "Outlier: $(outlier_model)",
    color = INK,
    fontsize = 13,
    align = (:left, :bottom),
    offset = (8, 8),
)

# Legend proxies — one representative line per cylinder class
for (idx, label) in enumerate(group_labels)
    lines!(ax, [NaN], [NaN]; color = IMPRINT_PALETTE[idx], linewidth = 4, label = label)
end
axislegend(
    ax, "Cylinders";
    position = :rt,
    backgroundcolor = ELEVATED_BG,
    framecolor = INK_SOFT,
    labelcolor = INK_SOFT,
    titlecolor = INK_SOFT,
)

# --- Save -------------------------------------------------------------------
save("plot-$(THEME).png", fig; px_per_unit = 2)
Runnable source as JSON, for any HTTP client: https://api.anyplot.ai/specs/andrews-curves/makie/code. Any spec id and library id listed in llms-full.txt fit the same URL shape; every URL below is complete and callable.
{
  "spec_id": "andrews-curves",
  "language": "julia",
  "library": "makie",
  "page": "https://anyplot.ai/andrews-curves/julia/makie",
  "hub": "https://anyplot.ai/andrews-curves",
  "code_json": "https://api.anyplot.ai/specs/andrews-curves/makie/code",
  "spec_json": "https://api.anyplot.ai/specs/andrews-curves",
  "render_light_png": "https://storage.googleapis.com/anyplot-images/plots/andrews-curves/julia/makie/plot-light.png",
  "render_dark_png": "https://storage.googleapis.com/anyplot-images/plots/andrews-curves/julia/makie/plot-dark.png",
  "quality_score": 81.0,
  "license": "MIT",
  "guide": "https://anyplot.ai/llms.txt"
}
Part of Andrews Curves for Multivariate Data on anyplot.ai.