The same plot in 14 other libraries — JavaScript: Chart.js, D3.js, Apache ECharts, Highcharts; Python: Altair, Bokeh, lets-plot, Matplotlib, Plotly, plotnine, Pygal, Seaborn; R: ggplot2; Julia: Makie.jl. Compare all 15 side by side: Andrews Curves for Multivariate Data in Python, R, Julia and JavaScript.
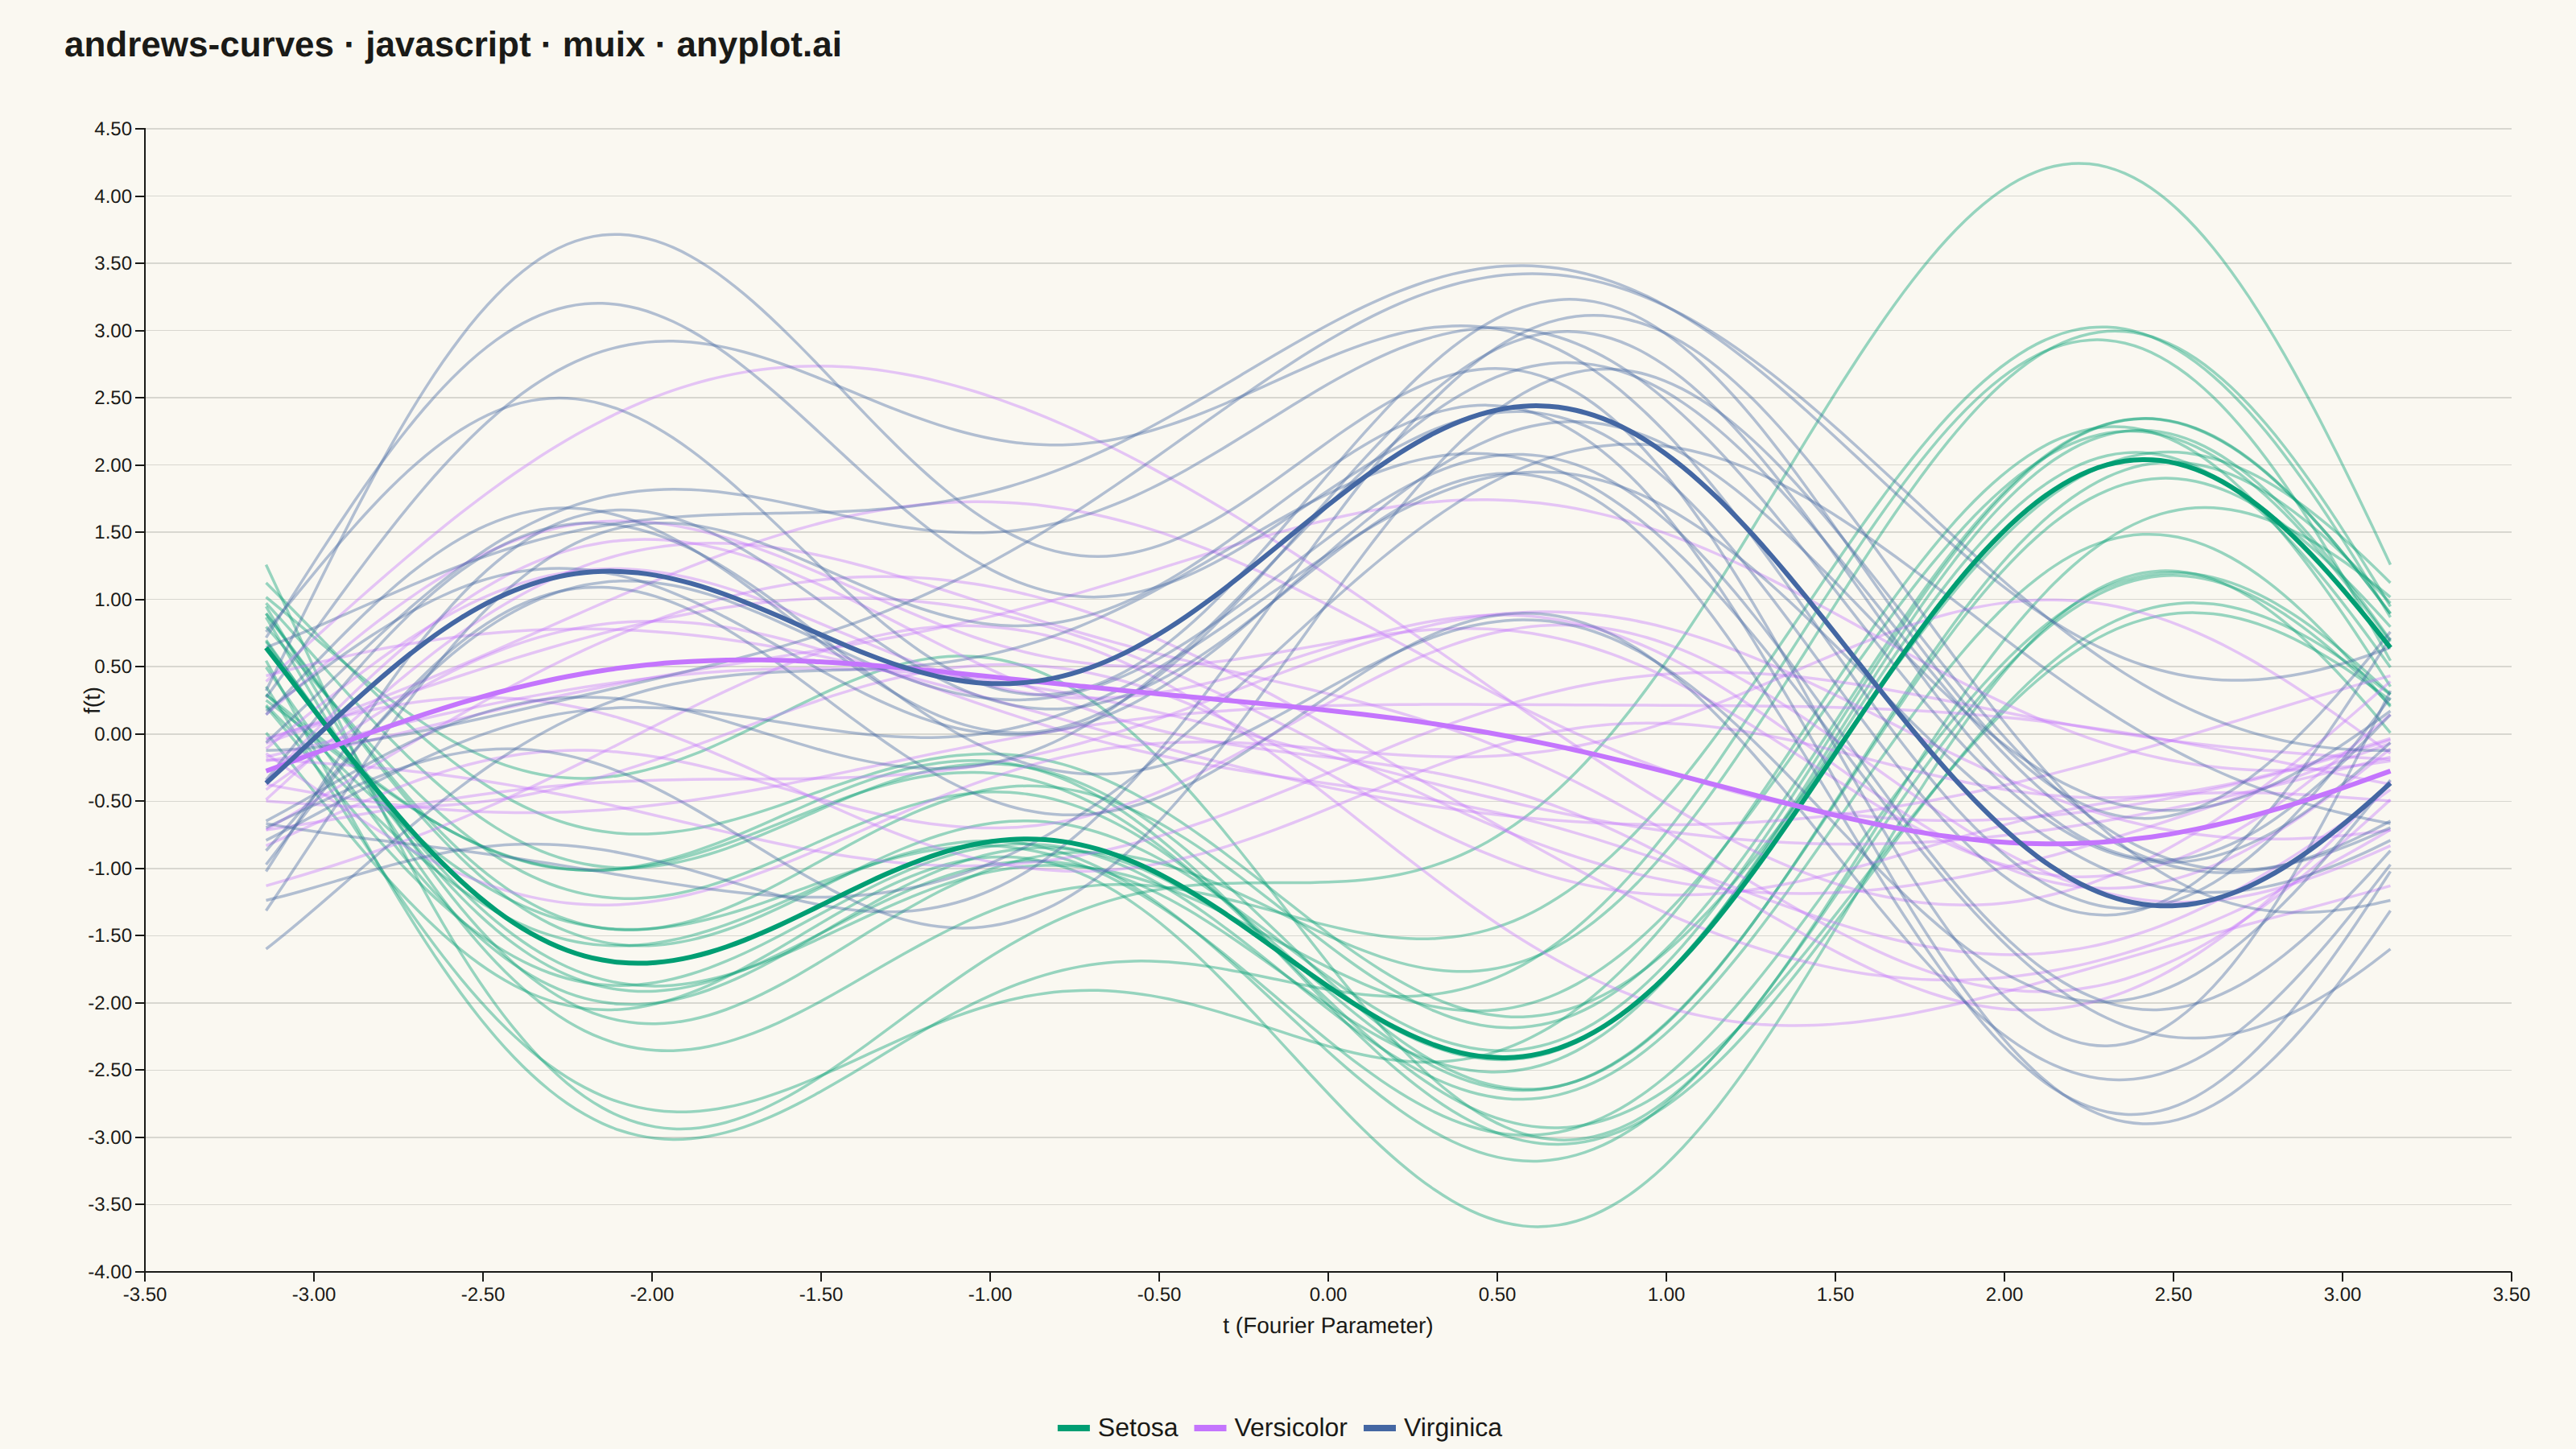
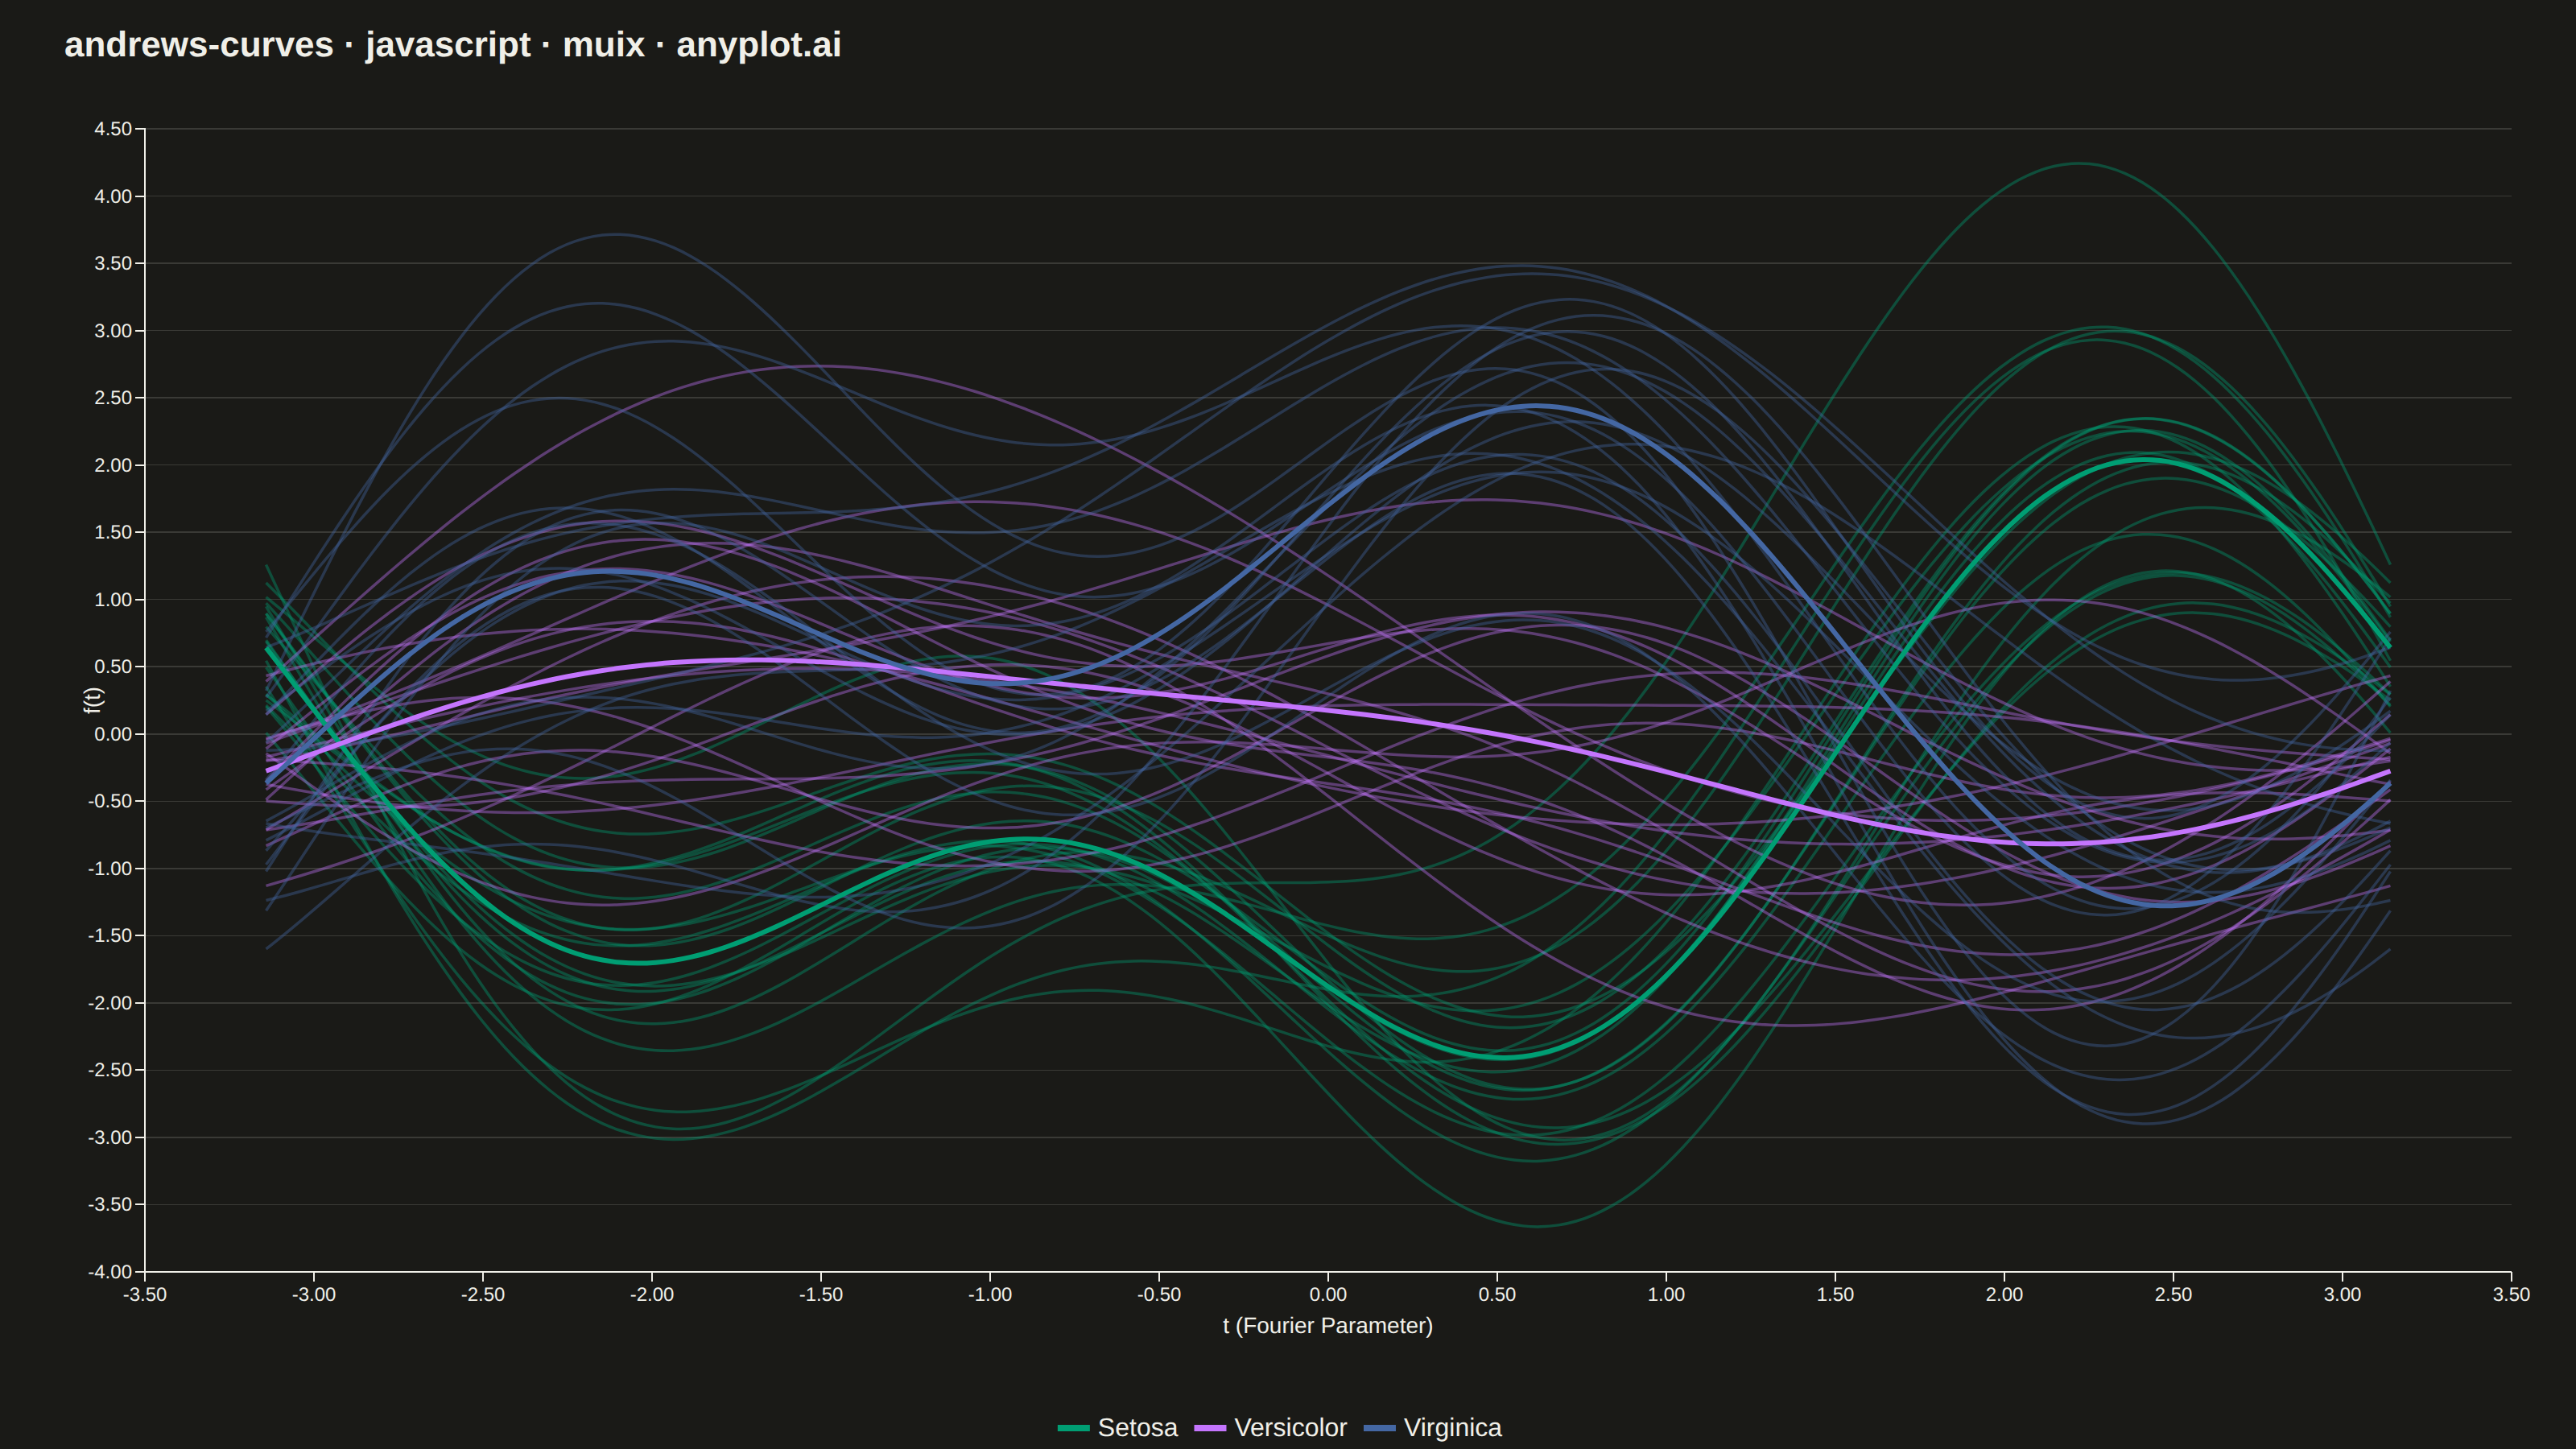
Andrews curves visualization transforms multivariate observations into smooth Fourier series curves. Each data point is represented as a continuous function where variable values become coefficients in a Fourier expansion, producing distinctive wave patterns. This technique enables visual comparison of multivariate patterns, cluster identification, and outlier detection—observations with similar values across variables produce similar curves, while outliers appear as distinctly different patterns.
// anyplot.ai
// andrews-curves: Andrews Curves for Multivariate Data
// Library: muix 7.29.1 | JavaScript 22.23.2
// Quality: 92/100 | Created: 2026-09-02
import { LineChart } from "@mui/x-charts/LineChart";
import Box from "@mui/material/Box";
import Typography from "@mui/material/Typography";

const t = window.ANYPLOT_TOKENS;
const TITLE = "andrews-curves · javascript · muix · anyplot.ai";
const TITLE_HEIGHT = 56;

// --- Data (in-memory, deterministic LCG — no seeded RNG in the browser) -----
function lcg(seed) {
  let state = seed;
  return () => {
    state = (state * 1664525 + 1013904223) % 4294967296;
    return state / 4294967296;
  };
}

function randomNormal(rand, mean, stdDev) {
  const u1 = Math.max(rand(), 1e-9);
  const u2 = rand();
  const z = Math.sqrt(-2 * Math.log(u1)) * Math.cos(2 * Math.PI * u2);
  return mean + z * stdDev;
}

// Iris-like flower measurements (cm): sepal length, sepal width, petal
// length, petal width. Means/std-devs approximate the classic Iris species
// so the curves show the same natural clustering the dataset is famous for.
const OBS_PER_SPECIES = 20;
const SPECIES = [
  { name: "Setosa", seed: 11, means: [5.0, 3.4, 1.5, 0.25], stdDevs: [0.35, 0.38, 0.17, 0.11] },
  { name: "Versicolor", seed: 23, means: [5.9, 2.8, 4.3, 1.33], stdDevs: [0.52, 0.31, 0.47, 0.2] },
  { name: "Virginica", seed: 37, means: [6.6, 3.0, 5.55, 2.03], stdDevs: [0.64, 0.32, 0.55, 0.27] },
];

const observations = SPECIES.flatMap((species) => {
  const rand = lcg(species.seed);
  return Array.from({ length: OBS_PER_SPECIES }, () => ({
    species: species.name,
    values: species.means.map((mean, i) => randomNormal(rand, mean, species.stdDevs[i])),
  }));
});

// Normalize each variable to a z-score across the whole dataset so no single
// measurement (petal length has the widest raw range) dominates the curve.
const DIM_COUNT = 4;
const dimMeans = Array.from(
  { length: DIM_COUNT },
  (_, d) => observations.reduce((sum, obs) => sum + obs.values[d], 0) / observations.length,
);
const dimStdDevs = Array.from({ length: DIM_COUNT }, (_, d) => {
  const variance =
    observations.reduce((sum, obs) => sum + (obs.values[d] - dimMeans[d]) ** 2, 0) /
    (observations.length - 1);
  return Math.sqrt(variance);
});
observations.forEach((obs) => {
  obs.normalized = obs.values.map((v, d) => (v - dimMeans[d]) / dimStdDevs[d]);
});

// Andrews curve Fourier expansion for 4 variables, t in [-π, π]:
// f(t) = x1/√2 + x2·sin(t) + x3·cos(t) + x4·sin(2t)
const T_COUNT = 121;
const tGrid = Array.from({ length: T_COUNT }, (_, k) => -Math.PI + (k * 2 * Math.PI) / (T_COUNT - 1));
function andrewsCurve([x1, x2, x3, x4], tValue) {
  return x1 / Math.SQRT2 + x2 * Math.sin(tValue) + x3 * Math.cos(tValue) + x4 * Math.sin(2 * tValue);
}
observations.forEach((obs) => {
  obs.curve = tGrid.map((tValue) => andrewsCurve(obs.normalized, tValue));
});

function hexToRgba(hex, alpha) {
  const value = parseInt(hex.slice(1), 16);
  const r = (value >> 16) & 255;
  const g = (value >> 8) & 255;
  const b = value & 255;
  return `rgba(${r}, ${g}, ${b}, ${alpha})`;
}

// Individual curves stay unlabeled (60 legend entries would be unreadable);
// each species instead gets one bold, fully-opaque mean curve below that
// carries the legend label and doubles as a representative summary line.
const series = observations.map((obs, i) => {
  const speciesIndex = SPECIES.findIndex((species) => species.name === obs.species);
  return {
    id: `${obs.species}-${i}`,
    data: obs.curve,
    color: hexToRgba(t.palette[speciesIndex], 0.4),
    curve: "natural",
    showMark: false,
  };
});

// Per-species mean curve: the pointwise average of that species' 20 curves,
// rendered bold and solid so the cluster's overall shape reads at a glance
// through the alpha-blended cloud of individual observations.
const meanSeries = SPECIES.map((species, speciesIndex) => {
  const curves = observations.filter((obs) => obs.species === species.name).map((obs) => obs.curve);
  const meanCurve = tGrid.map(
    (_, k) => curves.reduce((sum, curve) => sum + curve[k], 0) / curves.length,
  );
  return {
    id: `${species.name}-mean`,
    data: meanCurve,
    color: t.palette[speciesIndex],
    curve: "natural",
    showMark: false,
    label: species.name,
  };
});

// CSS hook selecting only the three bold mean-curve lines, so they render
// heavier than the alpha-blended individual observations behind them.
const meanLineSelector = SPECIES.map(
  (species) => `& .MuiLineElement-series-${species.name}-mean`,
).join(", ");

// --- Chart (default-exported component — the harness mounts it) -------------
export default function Chart() {
  const { width, height } = window.ANYPLOT_SIZE;
  const chartHeight = height - TITLE_HEIGHT;

  return (
    <Box sx={{ width, height, bgcolor: t.pageBg }}>
      <Box sx={{ height: TITLE_HEIGHT, display: "flex", alignItems: "center", px: "40px" }}>
        <Typography sx={{ color: t.ink, fontSize: "22px", fontWeight: 600, lineHeight: 1 }}>
          {TITLE}
        </Typography>
      </Box>
      <LineChart
        width={width}
        height={chartHeight}
        skipAnimation
        grid={{ horizontal: true }}
        axisHighlight={{ x: "line", y: "none" }}
        xAxis={[
          {
            data: tGrid,
            scaleType: "linear",
            label: "t (Fourier Parameter)",
            tickMinStep: 0.5,
            valueFormatter: (v) => v.toFixed(2),
          },
        ]}
        yAxis={[
          {
            label: "f(t)",
            valueFormatter: (v, context) =>
              context.location === "tick" ? v.toFixed(2) : `f(t) = ${v.toFixed(2)}`,
          },
        ]}
        series={[...series, ...meanSeries]}
        margin={{ top: 24, bottom: 110, left: 90, right: 40 }}
        sx={{
          "& .MuiLineElement-root": { strokeWidth: 1.75 },
          [meanLineSelector]: { strokeWidth: 3 },
          "& .MuiChartsAxisHighlight-root": { stroke: t.inkSoft, strokeDasharray: "4 3" },
          "& .MuiChartsAxis-tickLabel": { fontSize: "14px" },
          "& .MuiChartsAxis-label": { fontSize: "16px" },
          "& .MuiChartsAxis-line": { stroke: t.grid },
          "& .MuiChartsAxis-tick": { stroke: t.grid },
          "& .MuiChartsLegend-label": { fontSize: "15px" },
          "& .MuiChartsGrid-line": { stroke: t.grid, strokeWidth: 0.75 },
        }}
        slotProps={{
          legend: {
            position: { vertical: "bottom", horizontal: "middle" },
            itemMarkWidth: 20,
            itemMarkHeight: 4,
            padding: { top: 20 },
          },
        }}
      />
    </Box>
  );
}
Runnable source as JSON, for any HTTP client: https://api.anyplot.ai/specs/andrews-curves/muix/code. Any spec id and library id listed in llms-full.txt fit the same URL shape; every URL below is complete and callable.
{
  "spec_id": "andrews-curves",
  "language": "javascript",
  "library": "muix",
  "page": "https://anyplot.ai/andrews-curves/javascript/muix",
  "hub": "https://anyplot.ai/andrews-curves",
  "code_json": "https://api.anyplot.ai/specs/andrews-curves/muix/code",
  "spec_json": "https://api.anyplot.ai/specs/andrews-curves",
  "render_light_png": "https://storage.googleapis.com/anyplot-images/plots/andrews-curves/javascript/muix/plot-light.png",
  "render_dark_png": "https://storage.googleapis.com/anyplot-images/plots/andrews-curves/javascript/muix/plot-dark.png",
  "interactive_light_html": "https://storage.googleapis.com/anyplot-images/plots/andrews-curves/javascript/muix/plot-light.html",
  "interactive_dark_html": "https://storage.googleapis.com/anyplot-images/plots/andrews-curves/javascript/muix/plot-dark.html",
  "quality_score": 92.0,
  "license": "MIT",
  "guide": "https://anyplot.ai/llms.txt"
}
Part of Andrews Curves for Multivariate Data on anyplot.ai.