The same plot in 14 other libraries — JavaScript: Chart.js, D3.js, Highcharts, MUI X Charts; Python: Altair, Bokeh, lets-plot, Matplotlib, Plotly, plotnine, Pygal, Seaborn; R: ggplot2; Julia: Makie.jl. Compare all 15 side by side: Andrews Curves for Multivariate Data in Python, R, Julia and JavaScript.
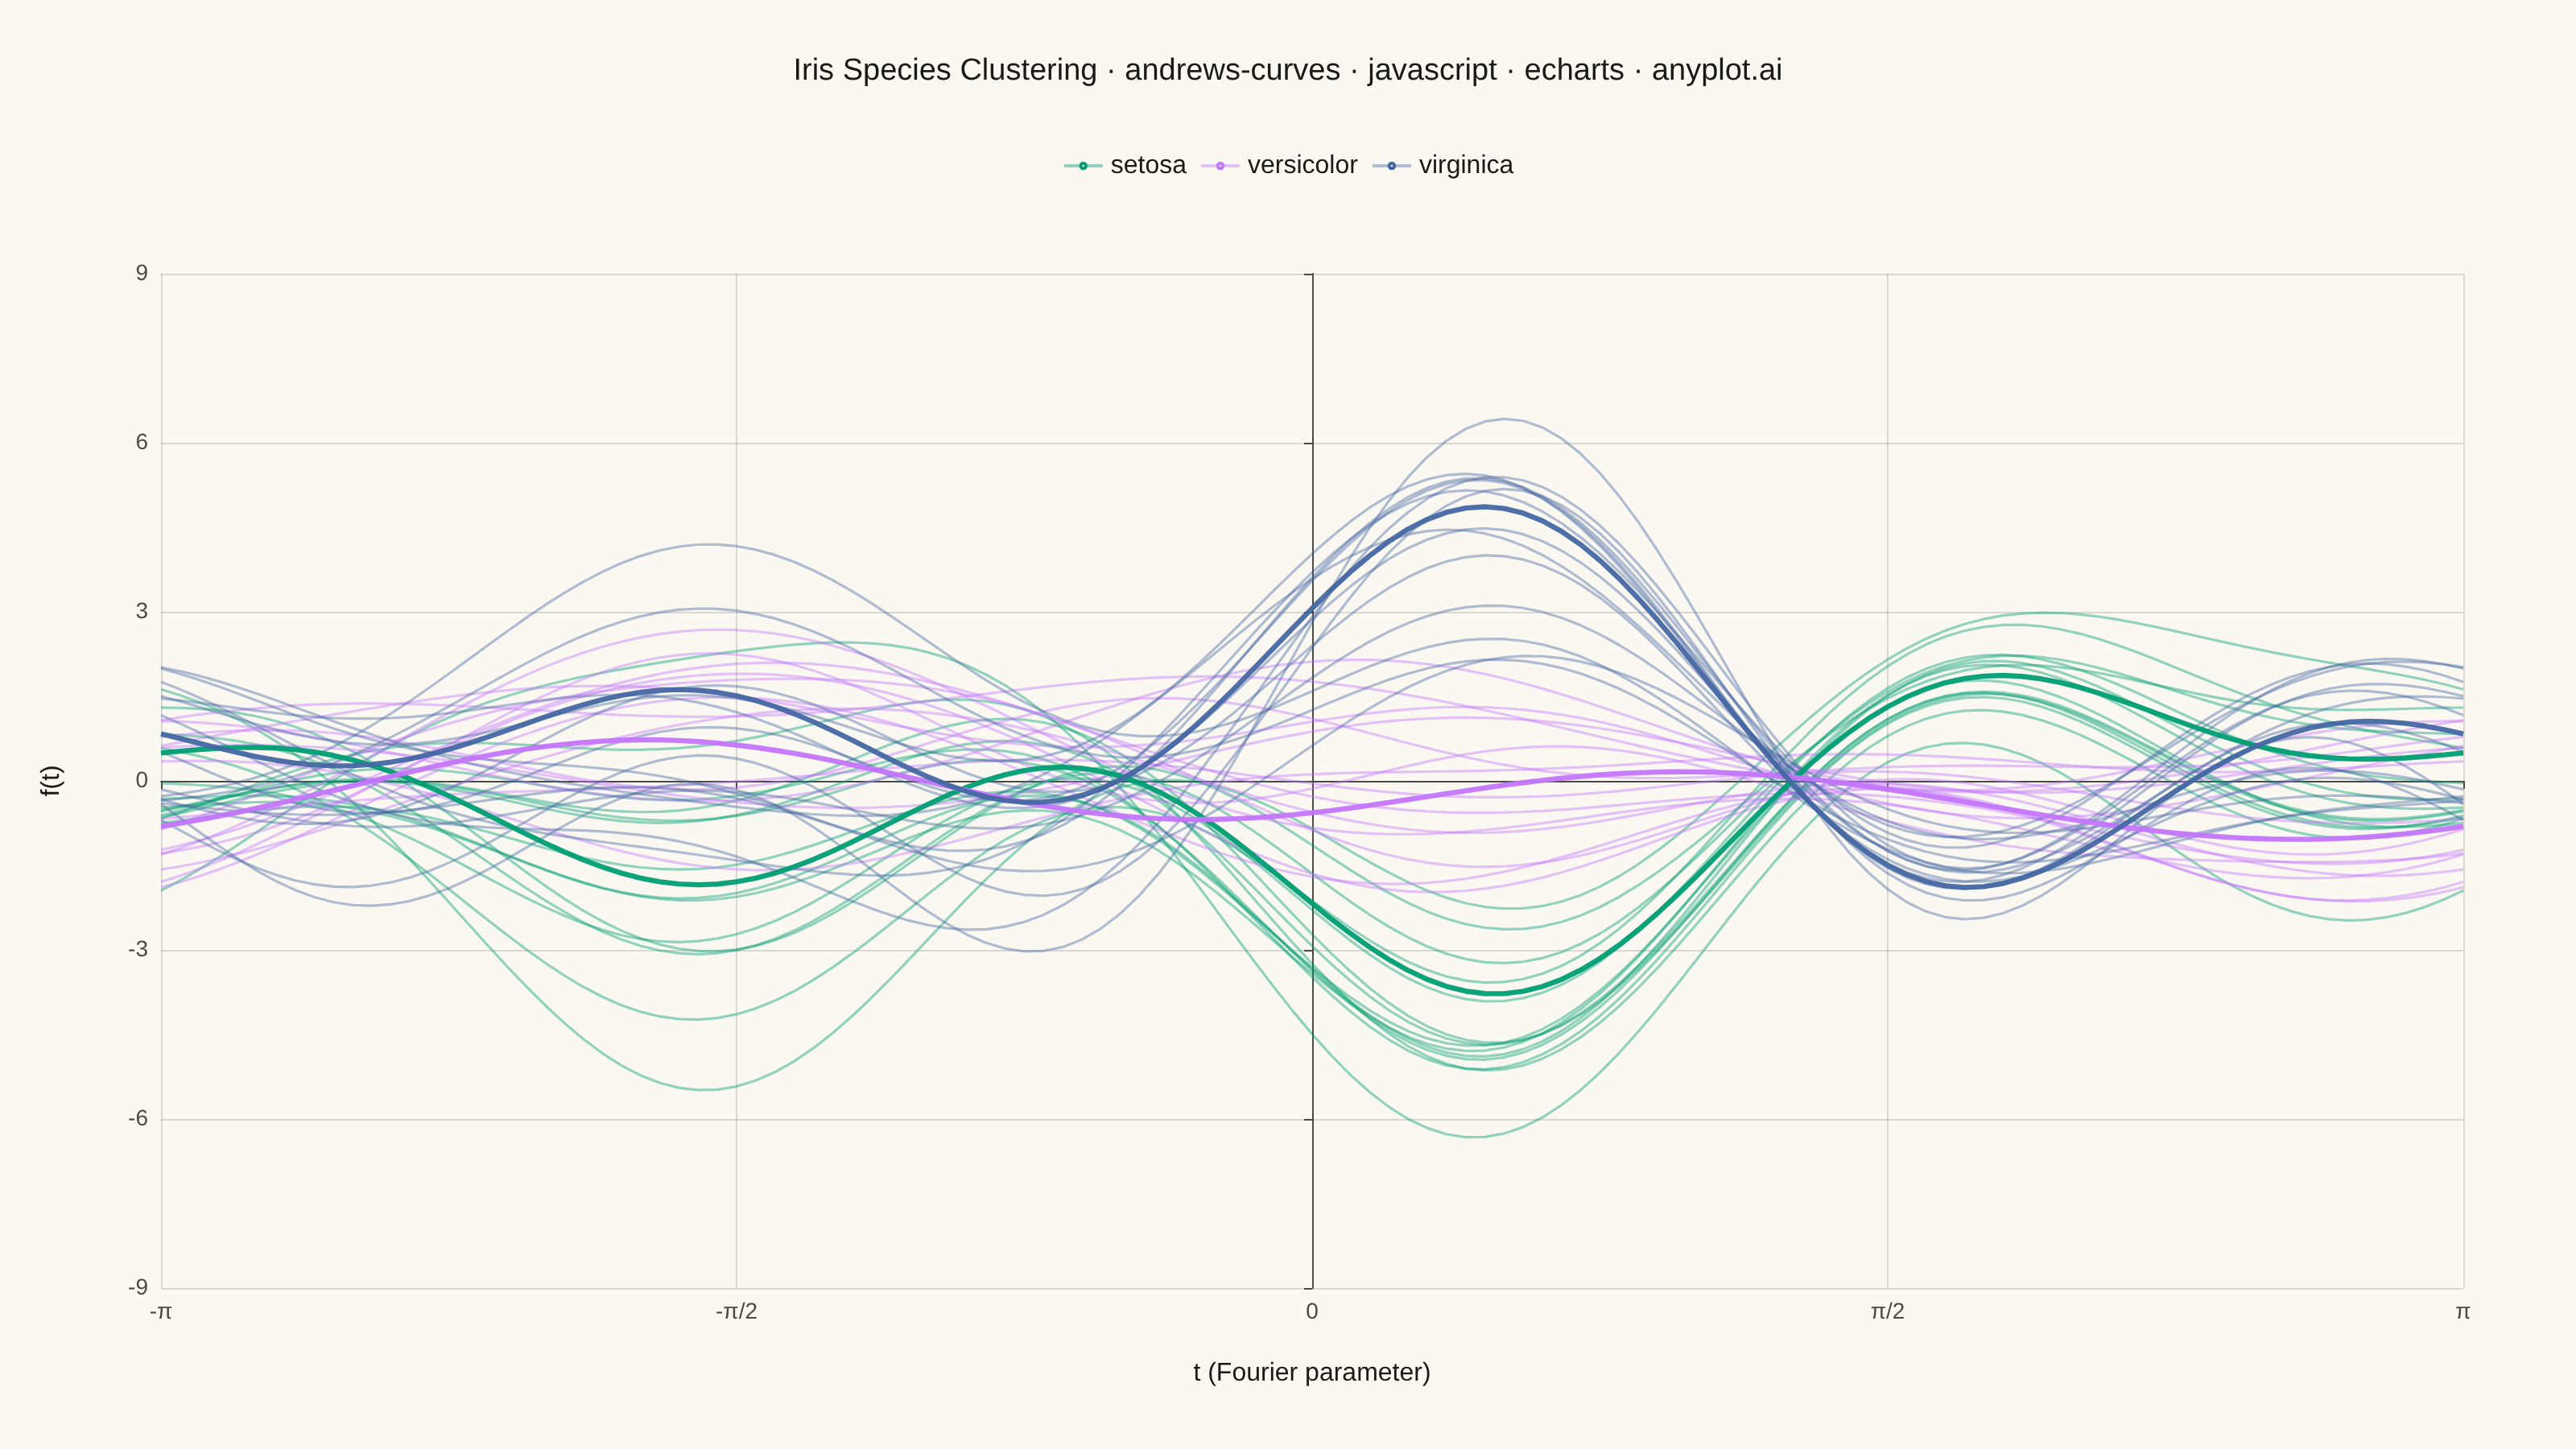
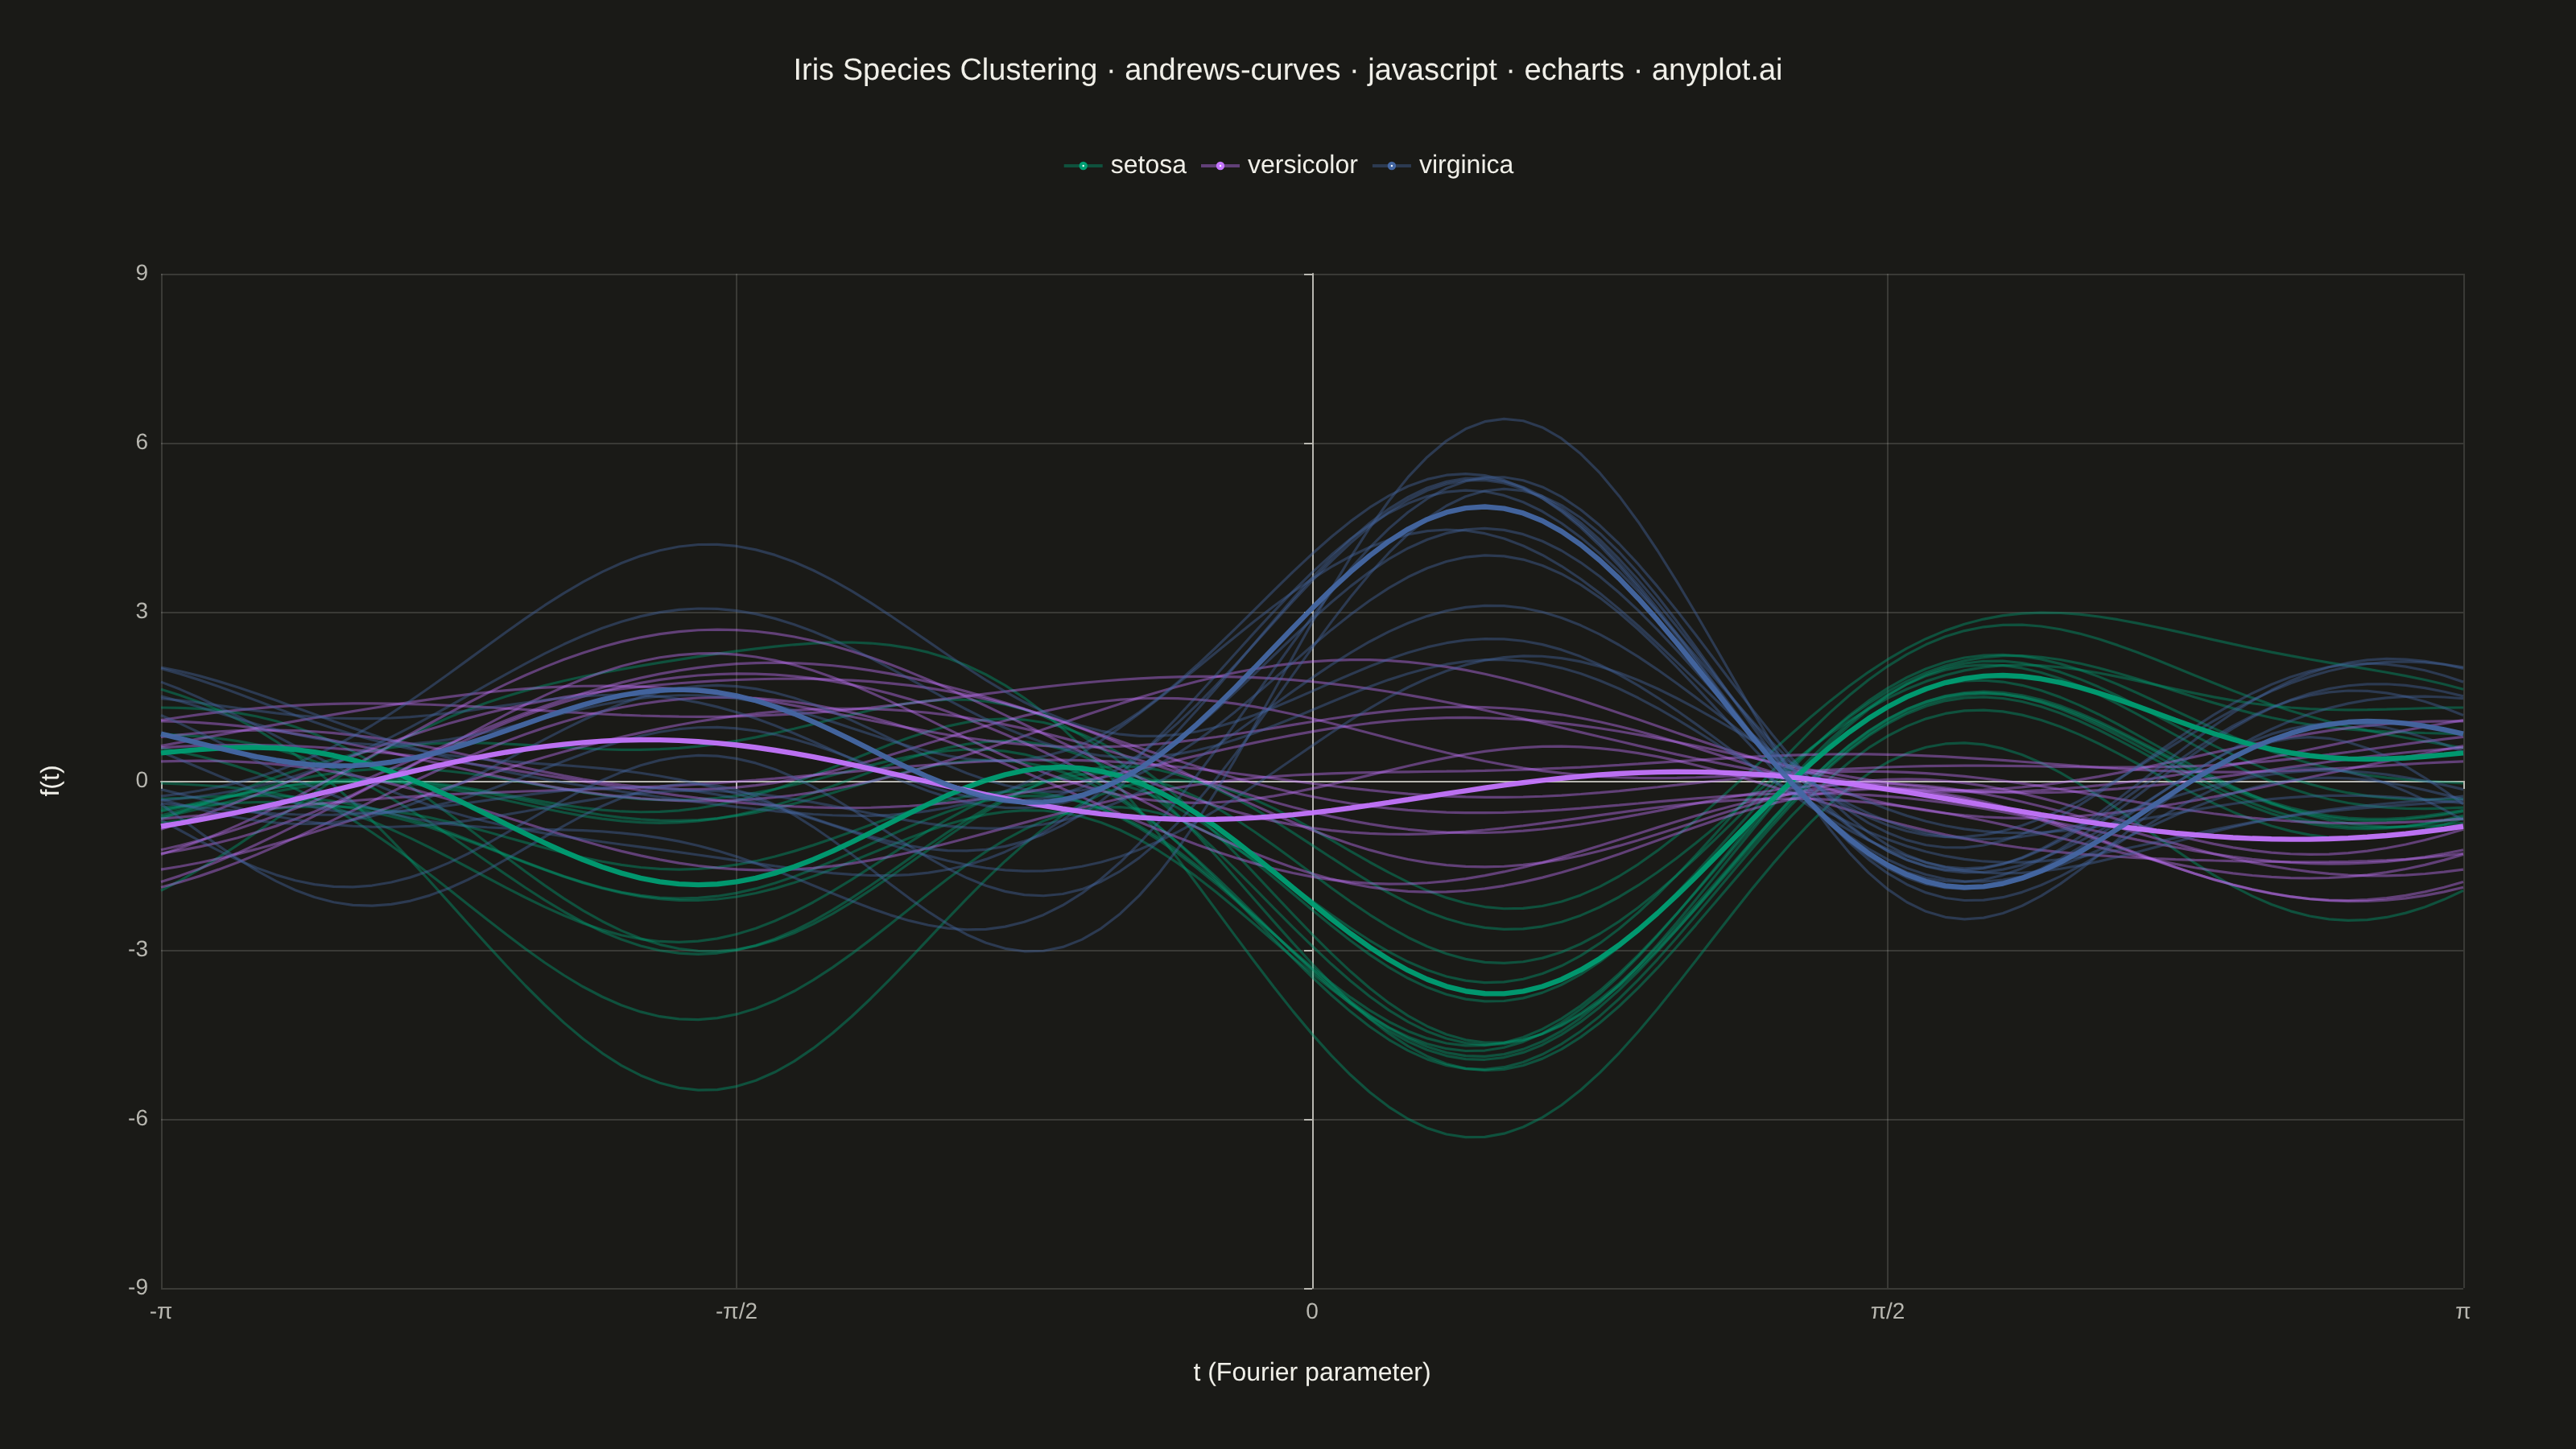
Andrews curves visualization transforms multivariate observations into smooth Fourier series curves. Each data point is represented as a continuous function where variable values become coefficients in a Fourier expansion, producing distinctive wave patterns. This technique enables visual comparison of multivariate patterns, cluster identification, and outlier detection—observations with similar values across variables produce similar curves, while outliers appear as distinctly different patterns.
// anyplot.ai
// andrews-curves: Andrews Curves for Multivariate Data
// Library: echarts 6.1.0 | JavaScript 22.23.2
// Quality: 87/100 | Created: 2026-09-02

const t = window.ANYPLOT_TOKENS;

// --- Data (in-memory, deterministic) ----------------------------------------
// Synthetic iris-like measurements: sepal length/width, petal length/width (cm),
// plus derived sepal/petal area, per species cluster, generated with a
// fixed-seed PRNG for reproducibility.
function mulberry32(seed) {
  let a = seed;
  return function () {
    a |= 0;
    a = (a + 0x6d2b79f5) | 0;
    let z = Math.imul(a ^ (a >>> 15), 1 | a);
    z = (z + Math.imul(z ^ (z >>> 7), 61 | z)) ^ z;
    return ((z ^ (z >>> 14)) >>> 0) / 4294967296;
  };
}
const rand = mulberry32(42);
function randNormal() {
  const u1 = Math.max(rand(), 1e-9);
  const u2 = rand();
  return Math.sqrt(-2 * Math.log(u1)) * Math.cos(2 * Math.PI * u2);
}

const SPECIES = [
  { name: "setosa", means: [5.0, 3.4, 1.5, 0.25], stds: [0.35, 0.38, 0.17, 0.11] },
  { name: "versicolor", means: [5.9, 2.8, 4.3, 1.3], stds: [0.52, 0.31, 0.47, 0.2] },
  { name: "virginica", means: [6.6, 3.0, 5.6, 2.0], stds: [0.64, 0.32, 0.55, 0.27] },
];
const SAMPLES_PER_SPECIES = 15;

const observations = [];
SPECIES.forEach((species) => {
  for (let i = 0; i < SAMPLES_PER_SPECIES; i++) {
    const [sepalLength, sepalWidth, petalLength, petalWidth] = species.means.map(
      (mean, j) => mean + randNormal() * species.stds[j]
    );
    const features = [
      sepalLength,
      sepalWidth,
      petalLength,
      petalWidth,
      sepalLength * sepalWidth,
      petalLength * petalWidth,
    ];
    observations.push({ category: species.name, features });
  }
});

// Standardize each dimension (z-score) so no single variable dominates the curve
const numDims = observations[0].features.length;
const dimMeans = [];
const dimStds = [];
for (let j = 0; j < numDims; j++) {
  const values = observations.map((o) => o.features[j]);
  const mean = values.reduce((a, b) => a + b, 0) / values.length;
  const variance = values.reduce((a, b) => a + (b - mean) ** 2, 0) / values.length;
  dimMeans.push(mean);
  dimStds.push(Math.sqrt(variance));
}
observations.forEach((o) => {
  o.z = o.features.map((v, j) => (v - dimMeans[j]) / dimStds[j]);
});

// Andrews curve: f(t) = z1/sqrt(2) + z2 sin(t) + z3 cos(t) + z4 sin(2t) + ...
function andrewsCurve(z, t) {
  let value = z[0] / Math.SQRT2;
  for (let k = 1; k < z.length; k++) {
    const harmonic = Math.ceil(k / 2);
    value += k % 2 === 1 ? z[k] * Math.sin(harmonic * t) : z[k] * Math.cos(harmonic * t);
  }
  return value;
}

const T_STEPS = 120;
const tValues = Array.from({ length: T_STEPS + 1 }, (_, i) => -Math.PI + (2 * Math.PI * i) / T_STEPS);

const categoryColors = { setosa: t.palette[0], versicolor: t.palette[1], virginica: t.palette[2] };

// Mark, per species, the curve closest to its cluster centroid (in z-space) as
// the representative curve — drawn bolder and more opaque to sharpen the
// cluster storytelling amid the 45 overplotted curves.
SPECIES.forEach((species) => {
  const members = observations.filter((o) => o.category === species.name);
  const centroid = members[0].z.map((_, j) => members.reduce((sum, o) => sum + o.z[j], 0) / members.length);
  let closest = members[0];
  let closestDist = Infinity;
  members.forEach((o) => {
    const dist = Math.sqrt(o.z.reduce((sum, v, j) => sum + (v - centroid[j]) ** 2, 0));
    if (dist < closestDist) {
      closestDist = dist;
      closest = o;
    }
  });
  closest.isRepresentative = true;
});

// Draw representative curves last so they sit on top of the dense overplot.
const orderedObservations = [...observations].sort((a, b) => (a.isRepresentative ? 1 : 0) - (b.isRepresentative ? 1 : 0));

const series = orderedObservations.map((o) => ({
  name: o.category,
  type: "line",
  data: tValues.map((tv) => [tv, andrewsCurve(o.z, tv)]),
  showSymbol: false,
  lineStyle: o.isRepresentative
    ? { color: categoryColors[o.category], width: 3.2, opacity: 0.95 }
    : { color: categoryColors[o.category], width: 1.6, opacity: 0.42 },
  itemStyle: { color: categoryColors[o.category] },
  z: o.isRepresentative ? 3 : 1,
  emphasis: { disabled: true },
}));

// --- Init --------------------------------------------------------------------
const chart = echarts.init(document.getElementById("container"));

// --- Option --------------------------------------------------------------------
chart.setOption({
  animation: false,
  backgroundColor: "transparent",
  title: {
    text: "Iris Species Clustering · andrews-curves · javascript · echarts · anyplot.ai",
    left: "center",
    top: 30,
    textStyle: { color: t.ink, fontSize: 19, fontWeight: 500 },
  },
  legend: {
    data: SPECIES.map((s) => s.name),
    top: 90,
    left: "center",
    textStyle: { color: t.ink, fontSize: 16 },
    itemWidth: 24,
    itemHeight: 4,
  },
  grid: { left: 100, right: 70, top: 170, bottom: 100 },
  xAxis: {
    type: "value",
    name: "t (Fourier parameter)",
    nameLocation: "middle",
    nameGap: 45,
    nameTextStyle: { color: t.ink, fontSize: 16 },
    min: -Math.PI,
    max: Math.PI,
    interval: Math.PI / 2,
    axisLabel: {
      color: t.inkSoft,
      fontSize: 14,
      formatter: (val) => {
        const k = val / Math.PI;
        if (Math.abs(k) < 0.01) return "0";
        if (Math.abs(Math.abs(k) - 1) < 0.01) return k < 0 ? "-π" : "π";
        if (Math.abs(Math.abs(k) - 0.5) < 0.01) return k < 0 ? "-π/2" : "π/2";
        return val.toFixed(2);
      },
    },
    axisLine: { lineStyle: { color: t.inkSoft } },
    splitLine: { lineStyle: { color: t.grid } },
  },
  yAxis: {
    type: "value",
    name: "f(t)",
    nameLocation: "middle",
    nameGap: 60,
    nameTextStyle: { color: t.ink, fontSize: 16 },
    axisLabel: { color: t.inkSoft, fontSize: 14 },
    axisLine: { lineStyle: { color: t.inkSoft } },
    splitLine: { lineStyle: { color: t.grid } },
  },
  series,
});
Runnable source as JSON, for any HTTP client: https://api.anyplot.ai/specs/andrews-curves/echarts/code. Any spec id and library id listed in llms-full.txt fit the same URL shape; every URL below is complete and callable.
{
  "spec_id": "andrews-curves",
  "language": "javascript",
  "library": "echarts",
  "page": "https://anyplot.ai/andrews-curves/javascript/echarts",
  "hub": "https://anyplot.ai/andrews-curves",
  "code_json": "https://api.anyplot.ai/specs/andrews-curves/echarts/code",
  "spec_json": "https://api.anyplot.ai/specs/andrews-curves",
  "render_light_png": "https://storage.googleapis.com/anyplot-images/plots/andrews-curves/javascript/echarts/plot-light.png",
  "render_dark_png": "https://storage.googleapis.com/anyplot-images/plots/andrews-curves/javascript/echarts/plot-dark.png",
  "interactive_light_html": "https://storage.googleapis.com/anyplot-images/plots/andrews-curves/javascript/echarts/plot-light.html",
  "interactive_dark_html": "https://storage.googleapis.com/anyplot-images/plots/andrews-curves/javascript/echarts/plot-dark.html",
  "quality_score": 87.0,
  "license": "MIT",
  "guide": "https://anyplot.ai/llms.txt"
}
Part of Andrews Curves for Multivariate Data on anyplot.ai.