The same plot in 14 other libraries — JavaScript: Chart.js, D3.js, Apache ECharts, MUI X Charts; Python: Altair, Bokeh, lets-plot, Matplotlib, Plotly, plotnine, Pygal, Seaborn; R: ggplot2; Julia: Makie.jl. Compare all 15 side by side: Andrews Curves for Multivariate Data in Python, R, Julia and JavaScript.
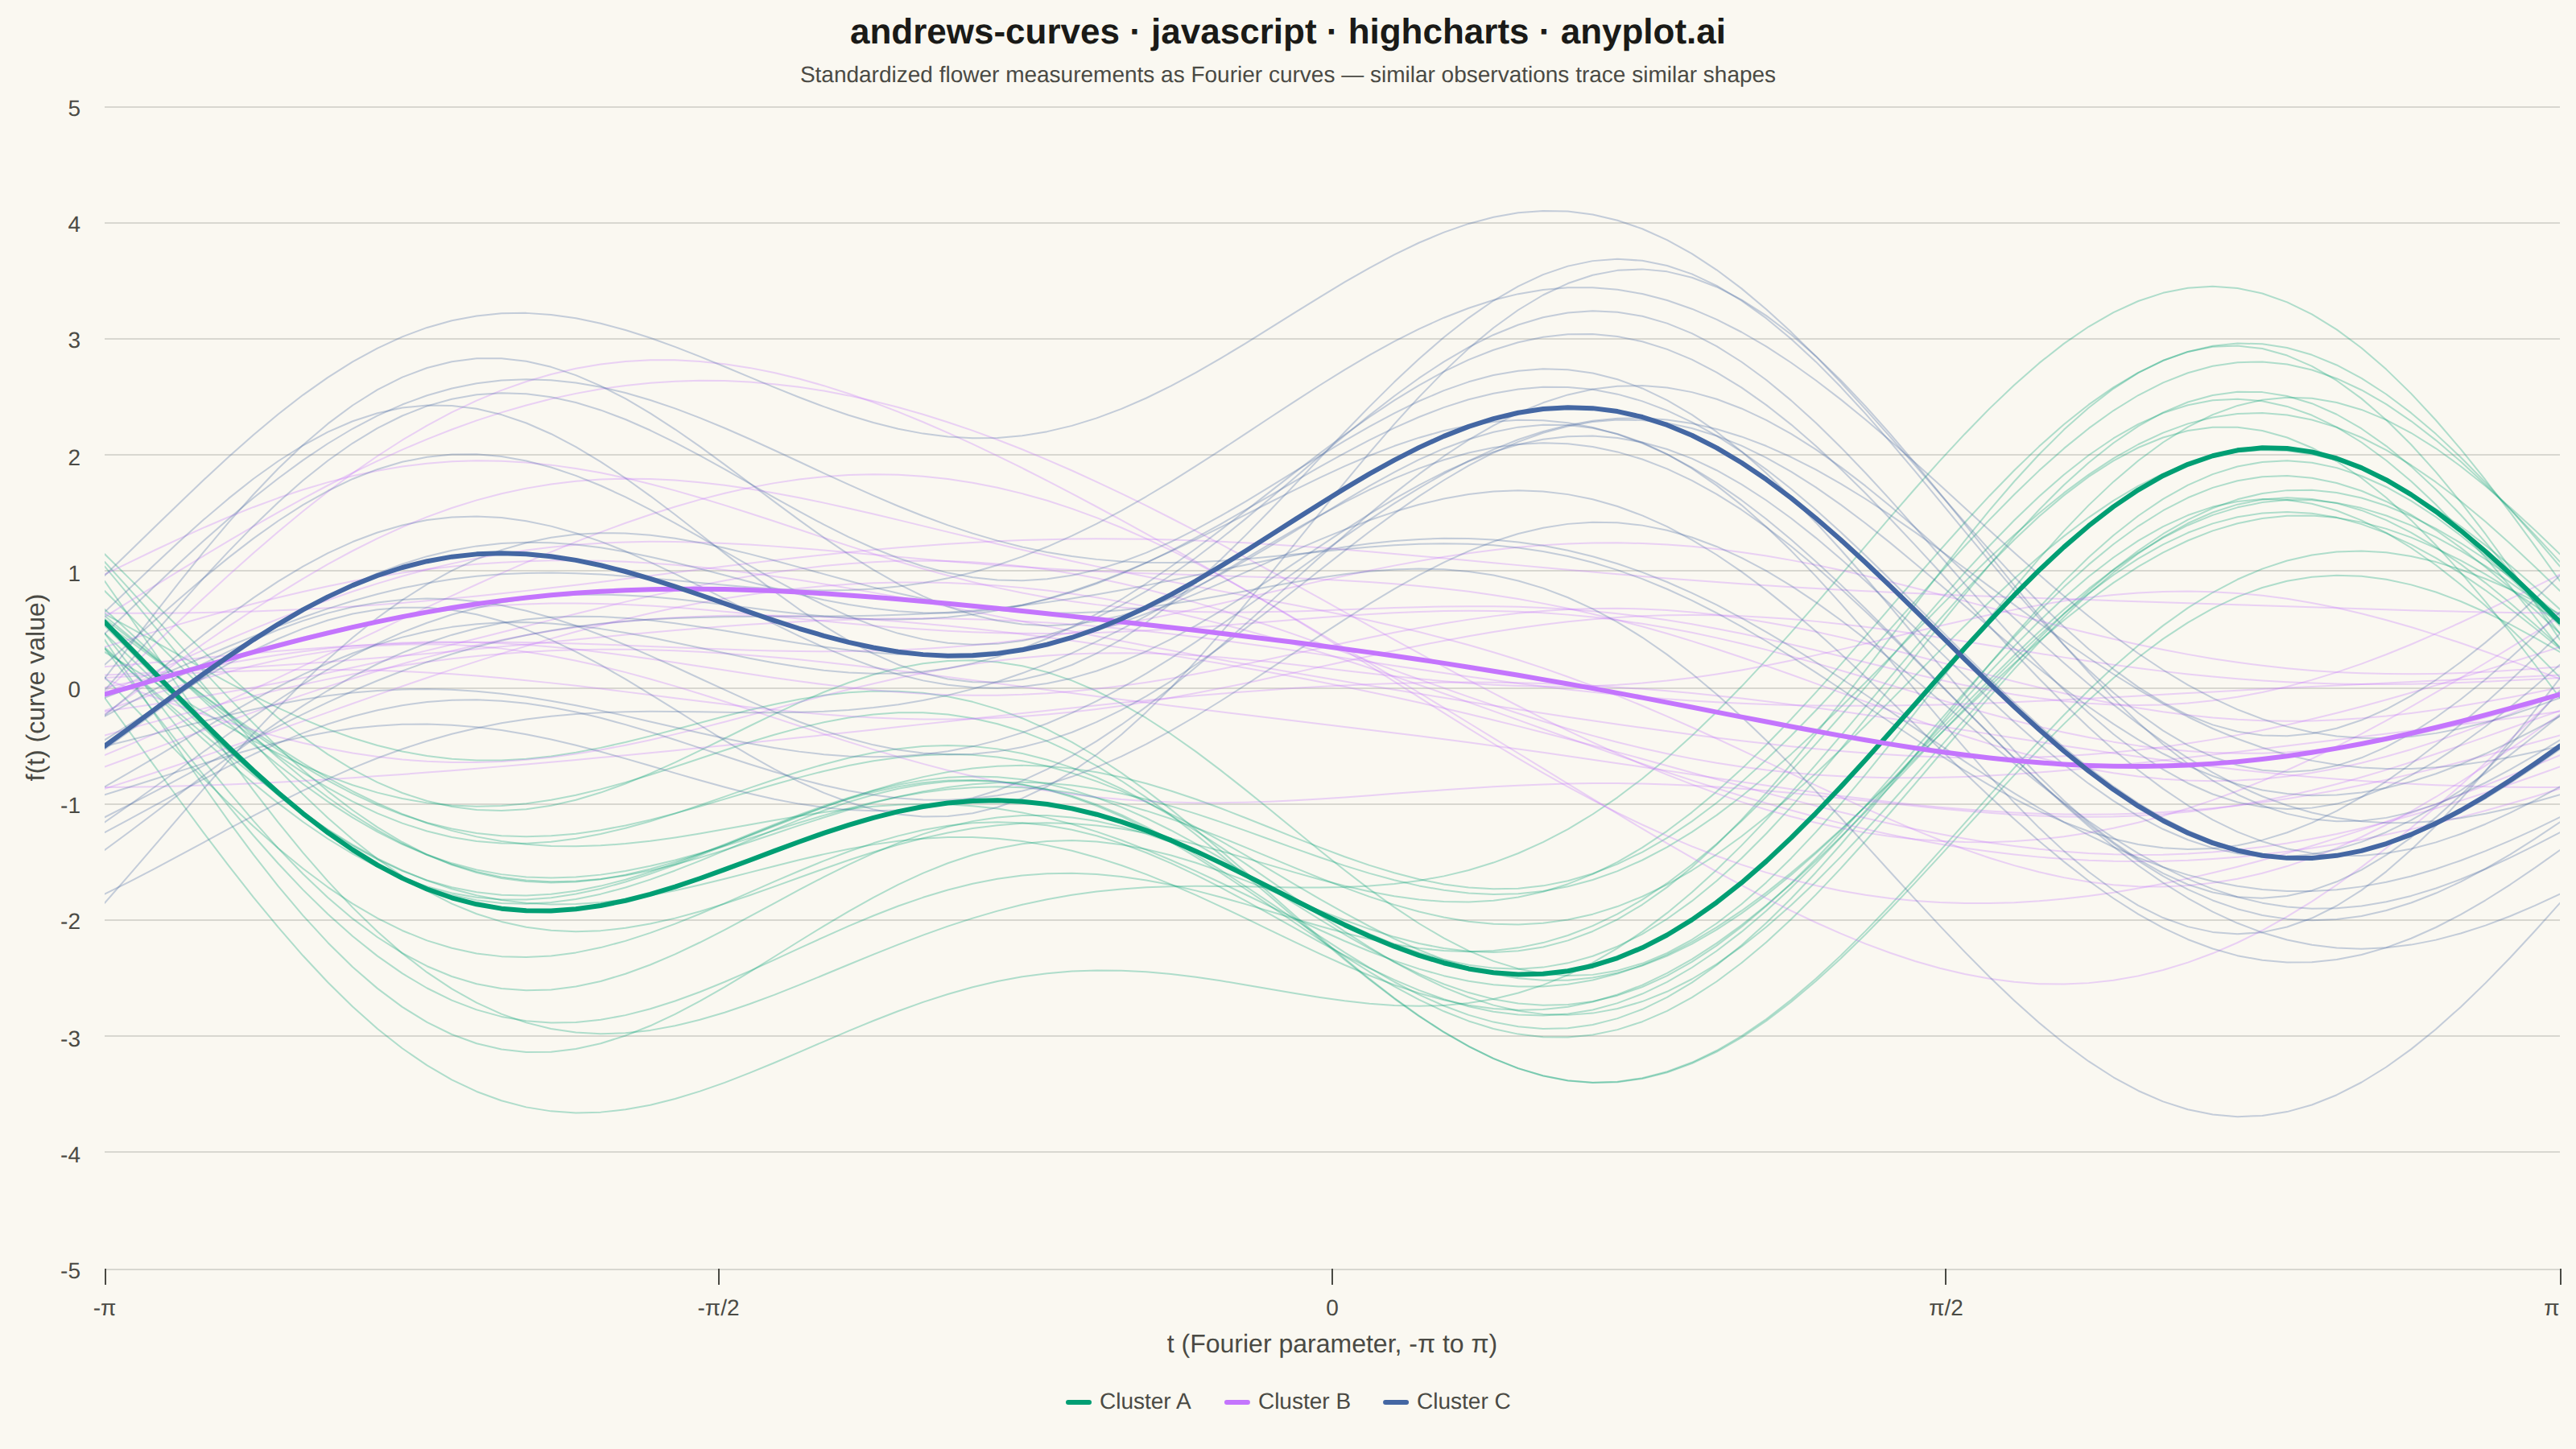
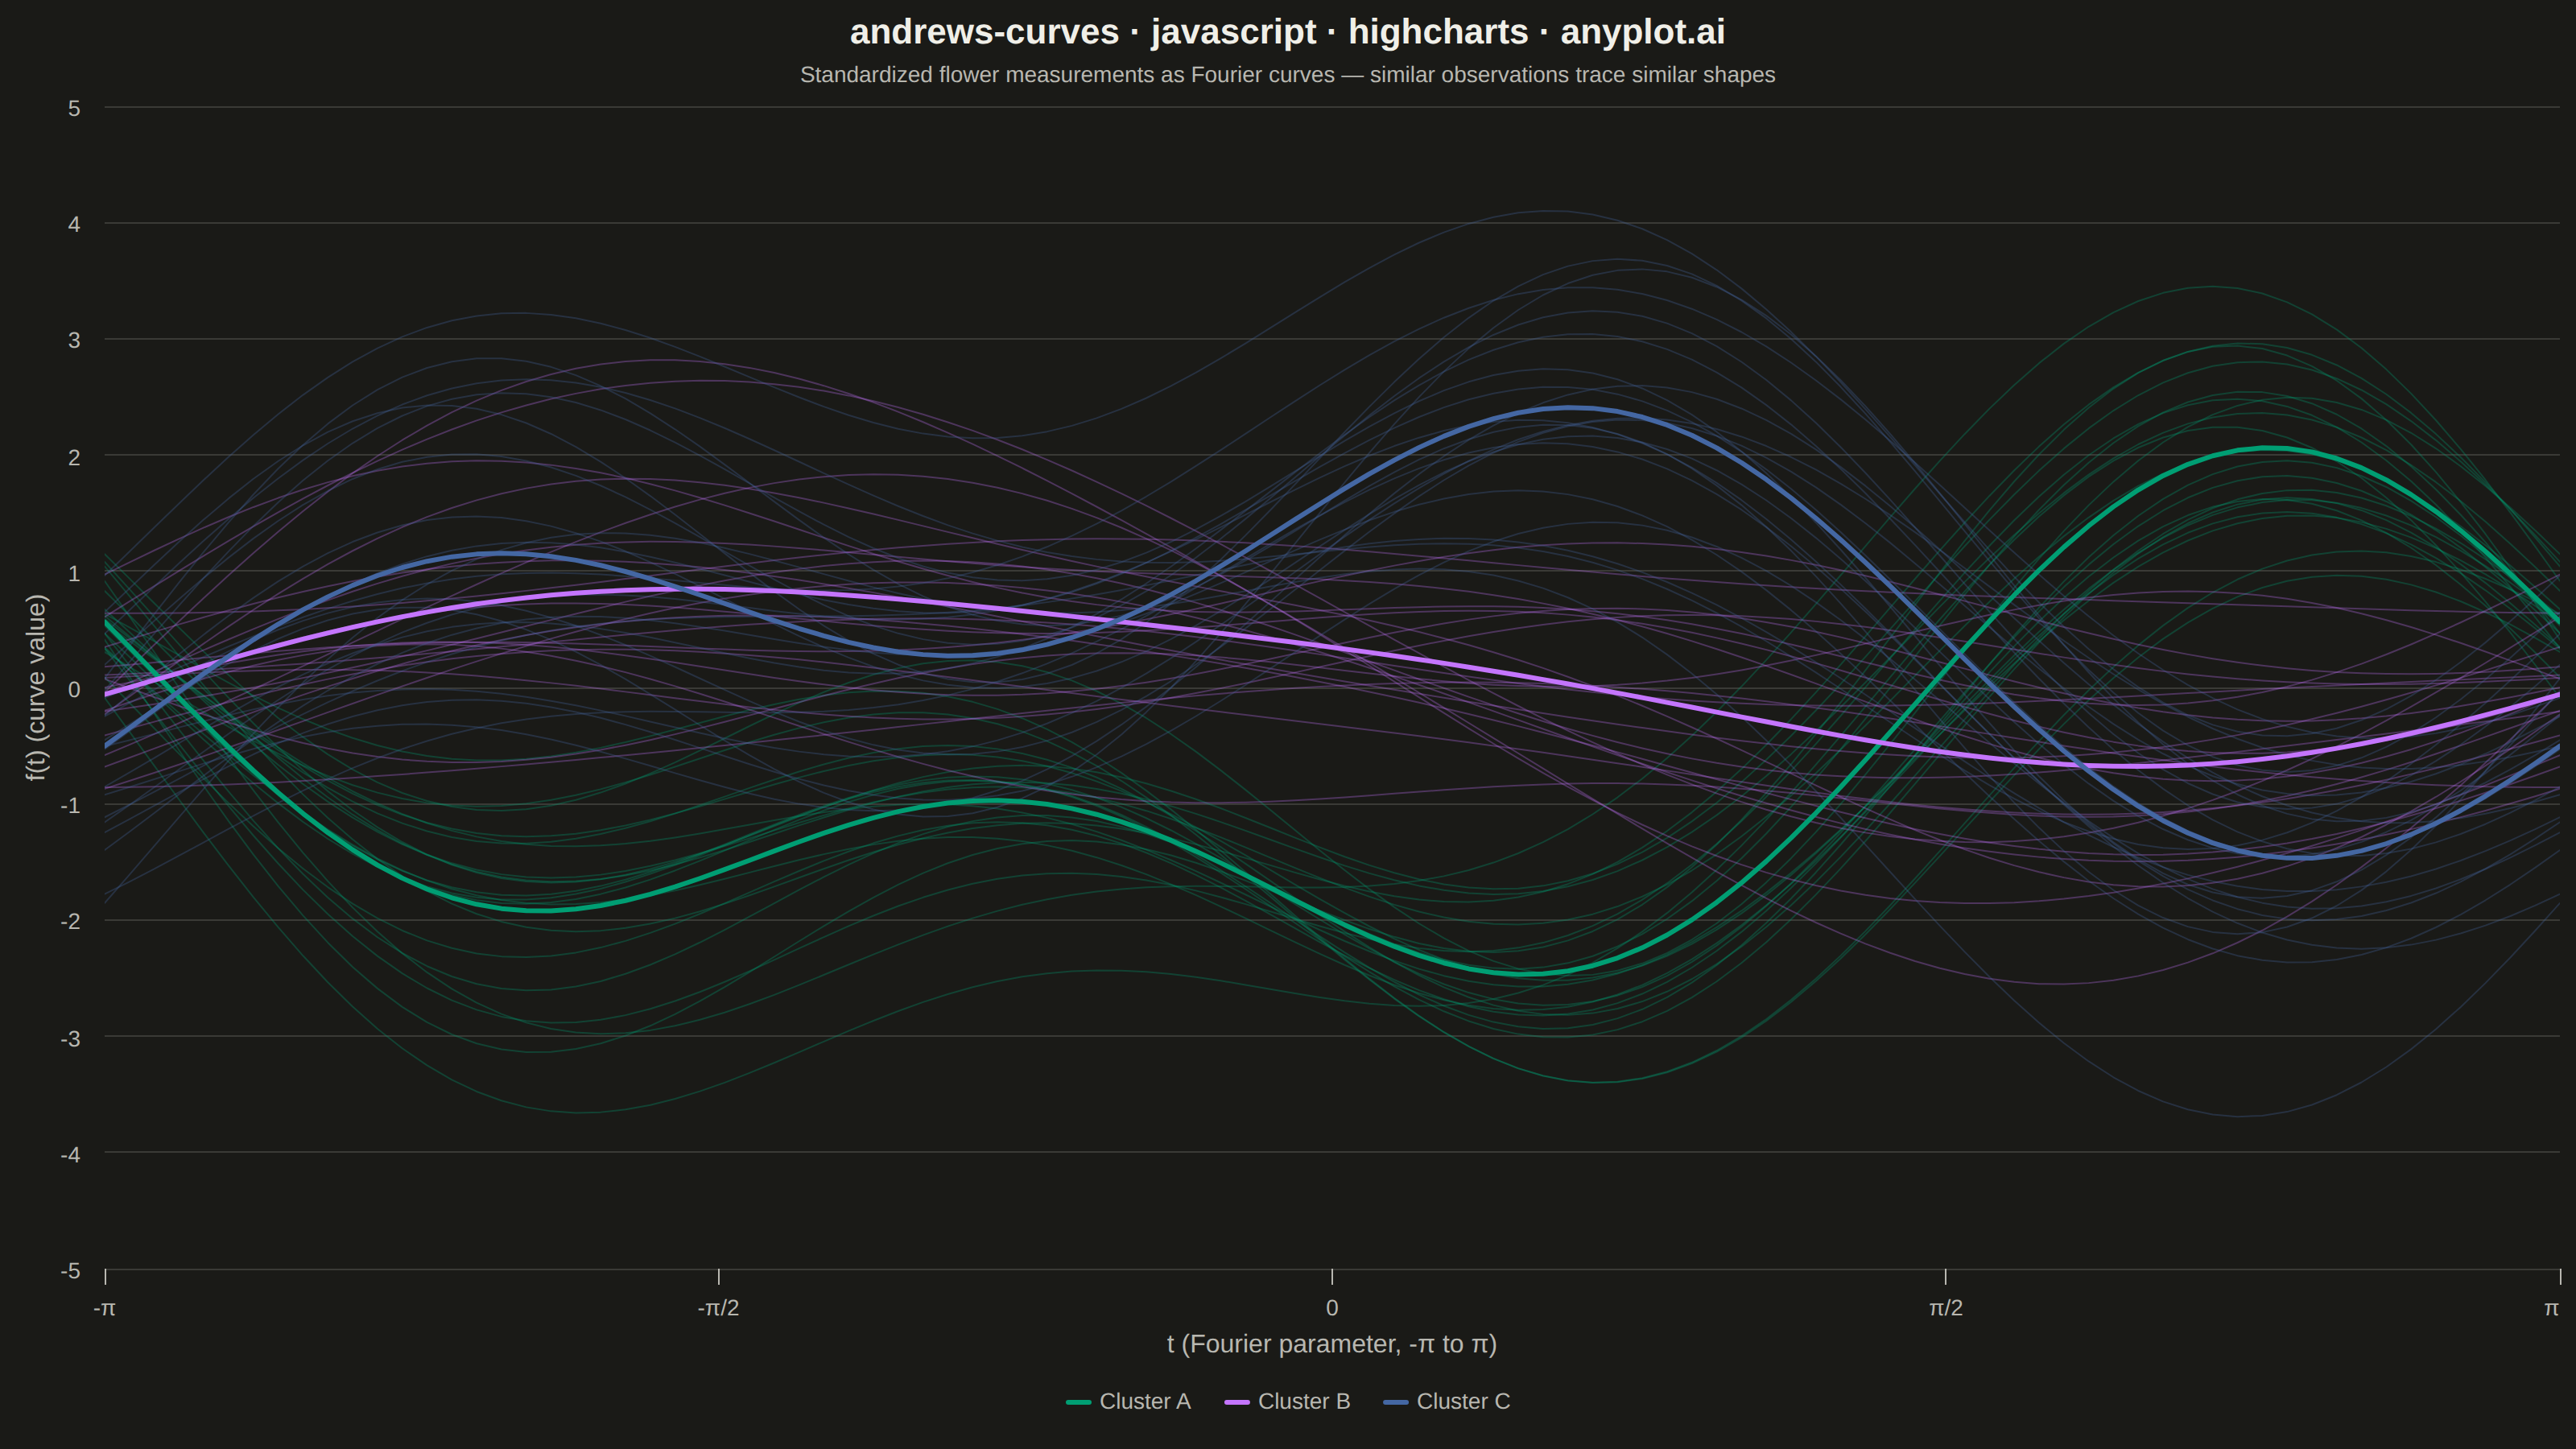
Andrews curves visualization transforms multivariate observations into smooth Fourier series curves. Each data point is represented as a continuous function where variable values become coefficients in a Fourier expansion, producing distinctive wave patterns. This technique enables visual comparison of multivariate patterns, cluster identification, and outlier detection—observations with similar values across variables produce similar curves, while outliers appear as distinctly different patterns.
// anyplot.ai
// andrews-curves: Andrews Curves for Multivariate Data
// Library: highcharts 12.6.0 | JavaScript 22.23.2
// Quality: 92/100 | Created: 2026-09-02

const t = window.ANYPLOT_TOKENS;

// --- Data (in-memory, deterministic) ----------------------------------------
// Fixed-seed LCG — the browser has no seeded RNG.
let lcgState = 42;
function lcgRandom() {
  lcgState = (lcgState * 1664525 + 1013904223) % 4294967296;
  return lcgState / 4294967296;
}
function randomNormal(mean, std) {
  const u1 = Math.max(lcgRandom(), 1e-9);
  const u2 = lcgRandom();
  const z = Math.sqrt(-2 * Math.log(u1)) * Math.cos(2 * Math.PI * u2);
  return mean + z * std;
}

// Three flower-measurement clusters (sepal length/width, petal length/width),
// modeled on the classic iris relationships: petals separate the clusters
// far more cleanly than sepals.
const groups = [
  { name: "Cluster A", n: 20, means: [5.0, 3.4, 1.5, 0.25], stds: [0.35, 0.38, 0.17, 0.1] },
  { name: "Cluster B", n: 20, means: [5.9, 2.8, 4.3, 1.3], stds: [0.51, 0.31, 0.47, 0.2] },
  { name: "Cluster C", n: 20, means: [6.6, 3.0, 5.6, 2.0], stds: [0.64, 0.32, 0.55, 0.27] },
];

const observations = [];
groups.forEach((group) => {
  for (let i = 0; i < group.n; i++) {
    const row = group.means.map((mean, j) => randomNormal(mean, group.stds[j]));
    observations.push({ group: group.name, row });
  }
});

// Standardize each variable (z-score) across the full pool so no single
// measurement dominates the Fourier expansion.
const numVars = groups[0].means.length;
const columnStats = [];
for (let j = 0; j < numVars; j++) {
  const values = observations.map((o) => o.row[j]);
  const mean = values.reduce((a, b) => a + b, 0) / values.length;
  const variance = values.reduce((a, b) => a + (b - mean) ** 2, 0) / values.length;
  columnStats.push({ mean, std: Math.sqrt(variance) });
}
observations.forEach((o) => {
  o.z = o.row.map((v, j) => (v - columnStats[j].mean) / columnStats[j].std);
});

// --- Andrews curve transform -------------------------------------------------
// f(t) = x1/sqrt(2) + x2*sin(t) + x3*cos(t) + x4*sin(2t)
function andrewsCurve(z, tt) {
  return (
    z[0] / Math.sqrt(2) +
    z[1] * Math.sin(tt) +
    z[2] * Math.cos(tt) +
    z[3] * Math.sin(2 * tt)
  );
}

const numSamples = 100;
const tStep = (2 * Math.PI) / (numSamples - 1);

function curvePoints(z) {
  const data = [];
  for (let k = 0; k < numSamples; k++) {
    const tt = -Math.PI + k * tStep;
    data.push([tt, andrewsCurve(z, tt)]);
  }
  return data;
}

// Faint individual curves establish the density texture; they carry no
// legend entry since the bold centroid curve below speaks for the group.
const individualSeries = observations.map((o) => ({
  type: "line",
  name: o.group,
  data: curvePoints(o.z),
  color: t.palette[groups.findIndex((g) => g.name === o.group)],
  opacity: 0.3,
  lineWidth: 1,
  showInLegend: false,
  marker: { enabled: false },
  enableMouseTracking: false,
}));

// Bold per-cluster centroid curve — a deliberate visual anchor that keeps
// each group legible (and carries the legend) even where individual curves
// braid together in the densest overlap band.
const centroidSeries = groups.map((group, groupIndex) => {
  const members = observations.filter((o) => o.group === group.name);
  const centroidZ = columnStats.map(
    (_, j) => members.reduce((sum, o) => sum + o.z[j], 0) / members.length
  );
  return {
    type: "line",
    name: group.name,
    data: curvePoints(centroidZ),
    color: t.palette[groupIndex],
    lineWidth: 3,
    zIndex: 5,
    showInLegend: true,
    marker: { enabled: false },
    enableMouseTracking: false,
  };
});

const series = [...individualSeries, ...centroidSeries];

// --- Chart -------------------------------------------------------------------
Highcharts.chart("container", {
  chart: {
    type: "line",
    backgroundColor: "transparent",
    animation: false,
    zoomType: "x",
    style: { fontFamily: "inherit" },
  },
  credits: { enabled: false },
  colors: t.palette,
  title: {
    text: "andrews-curves · javascript · highcharts · anyplot.ai",
    style: { color: t.ink, fontSize: "22px", fontWeight: "600" },
  },
  subtitle: {
    text: "Standardized flower measurements as Fourier curves — similar observations trace similar shapes",
    style: { color: t.inkSoft, fontSize: "14px" },
  },
  xAxis: {
    title: {
      text: "t (Fourier parameter, -π to π)",
      style: { color: t.inkSoft, fontSize: "16px" },
    },
    min: -Math.PI,
    max: Math.PI,
    tickPositions: [-Math.PI, -Math.PI / 2, 0, Math.PI / 2, Math.PI],
    labels: {
      style: { color: t.inkSoft, fontSize: "14px" },
      formatter() {
        const labels = { [-Math.PI]: "-π", [-Math.PI / 2]: "-π/2", 0: "0", [Math.PI / 2]: "π/2", [Math.PI]: "π" };
        return labels[this.value] ?? this.value.toFixed(2);
      },
    },
    lineWidth: 0,
    tickColor: t.inkSoft,
    gridLineColor: t.grid,
  },
  yAxis: {
    title: {
      text: "f(t) (curve value)",
      style: { color: t.inkSoft, fontSize: "16px" },
    },
    labels: { style: { color: t.inkSoft, fontSize: "14px" } },
    lineWidth: 0,
    gridLineColor: t.grid,
  },
  legend: {
    itemStyle: { color: t.inkSoft, fontSize: "14px" },
    itemHoverStyle: { color: t.ink },
  },
  tooltip: { enabled: false },
  plotOptions: {
    series: { animation: false, states: { hover: { enabled: false } } },
  },
  series,
});
Runnable source as JSON, for any HTTP client: https://api.anyplot.ai/specs/andrews-curves/highcharts/code. Any spec id and library id listed in llms-full.txt fit the same URL shape; every URL below is complete and callable.
{
  "spec_id": "andrews-curves",
  "language": "javascript",
  "library": "highcharts",
  "page": "https://anyplot.ai/andrews-curves/javascript/highcharts",
  "hub": "https://anyplot.ai/andrews-curves",
  "code_json": "https://api.anyplot.ai/specs/andrews-curves/highcharts/code",
  "spec_json": "https://api.anyplot.ai/specs/andrews-curves",
  "render_light_png": "https://storage.googleapis.com/anyplot-images/plots/andrews-curves/javascript/highcharts/plot-light.png",
  "render_dark_png": "https://storage.googleapis.com/anyplot-images/plots/andrews-curves/javascript/highcharts/plot-dark.png",
  "interactive_light_html": "https://storage.googleapis.com/anyplot-images/plots/andrews-curves/javascript/highcharts/plot-light.html",
  "interactive_dark_html": "https://storage.googleapis.com/anyplot-images/plots/andrews-curves/javascript/highcharts/plot-dark.html",
  "quality_score": 92.0,
  "license": "MIT",
  "guide": "https://anyplot.ai/llms.txt"
}
Part of Andrews Curves for Multivariate Data on anyplot.ai.