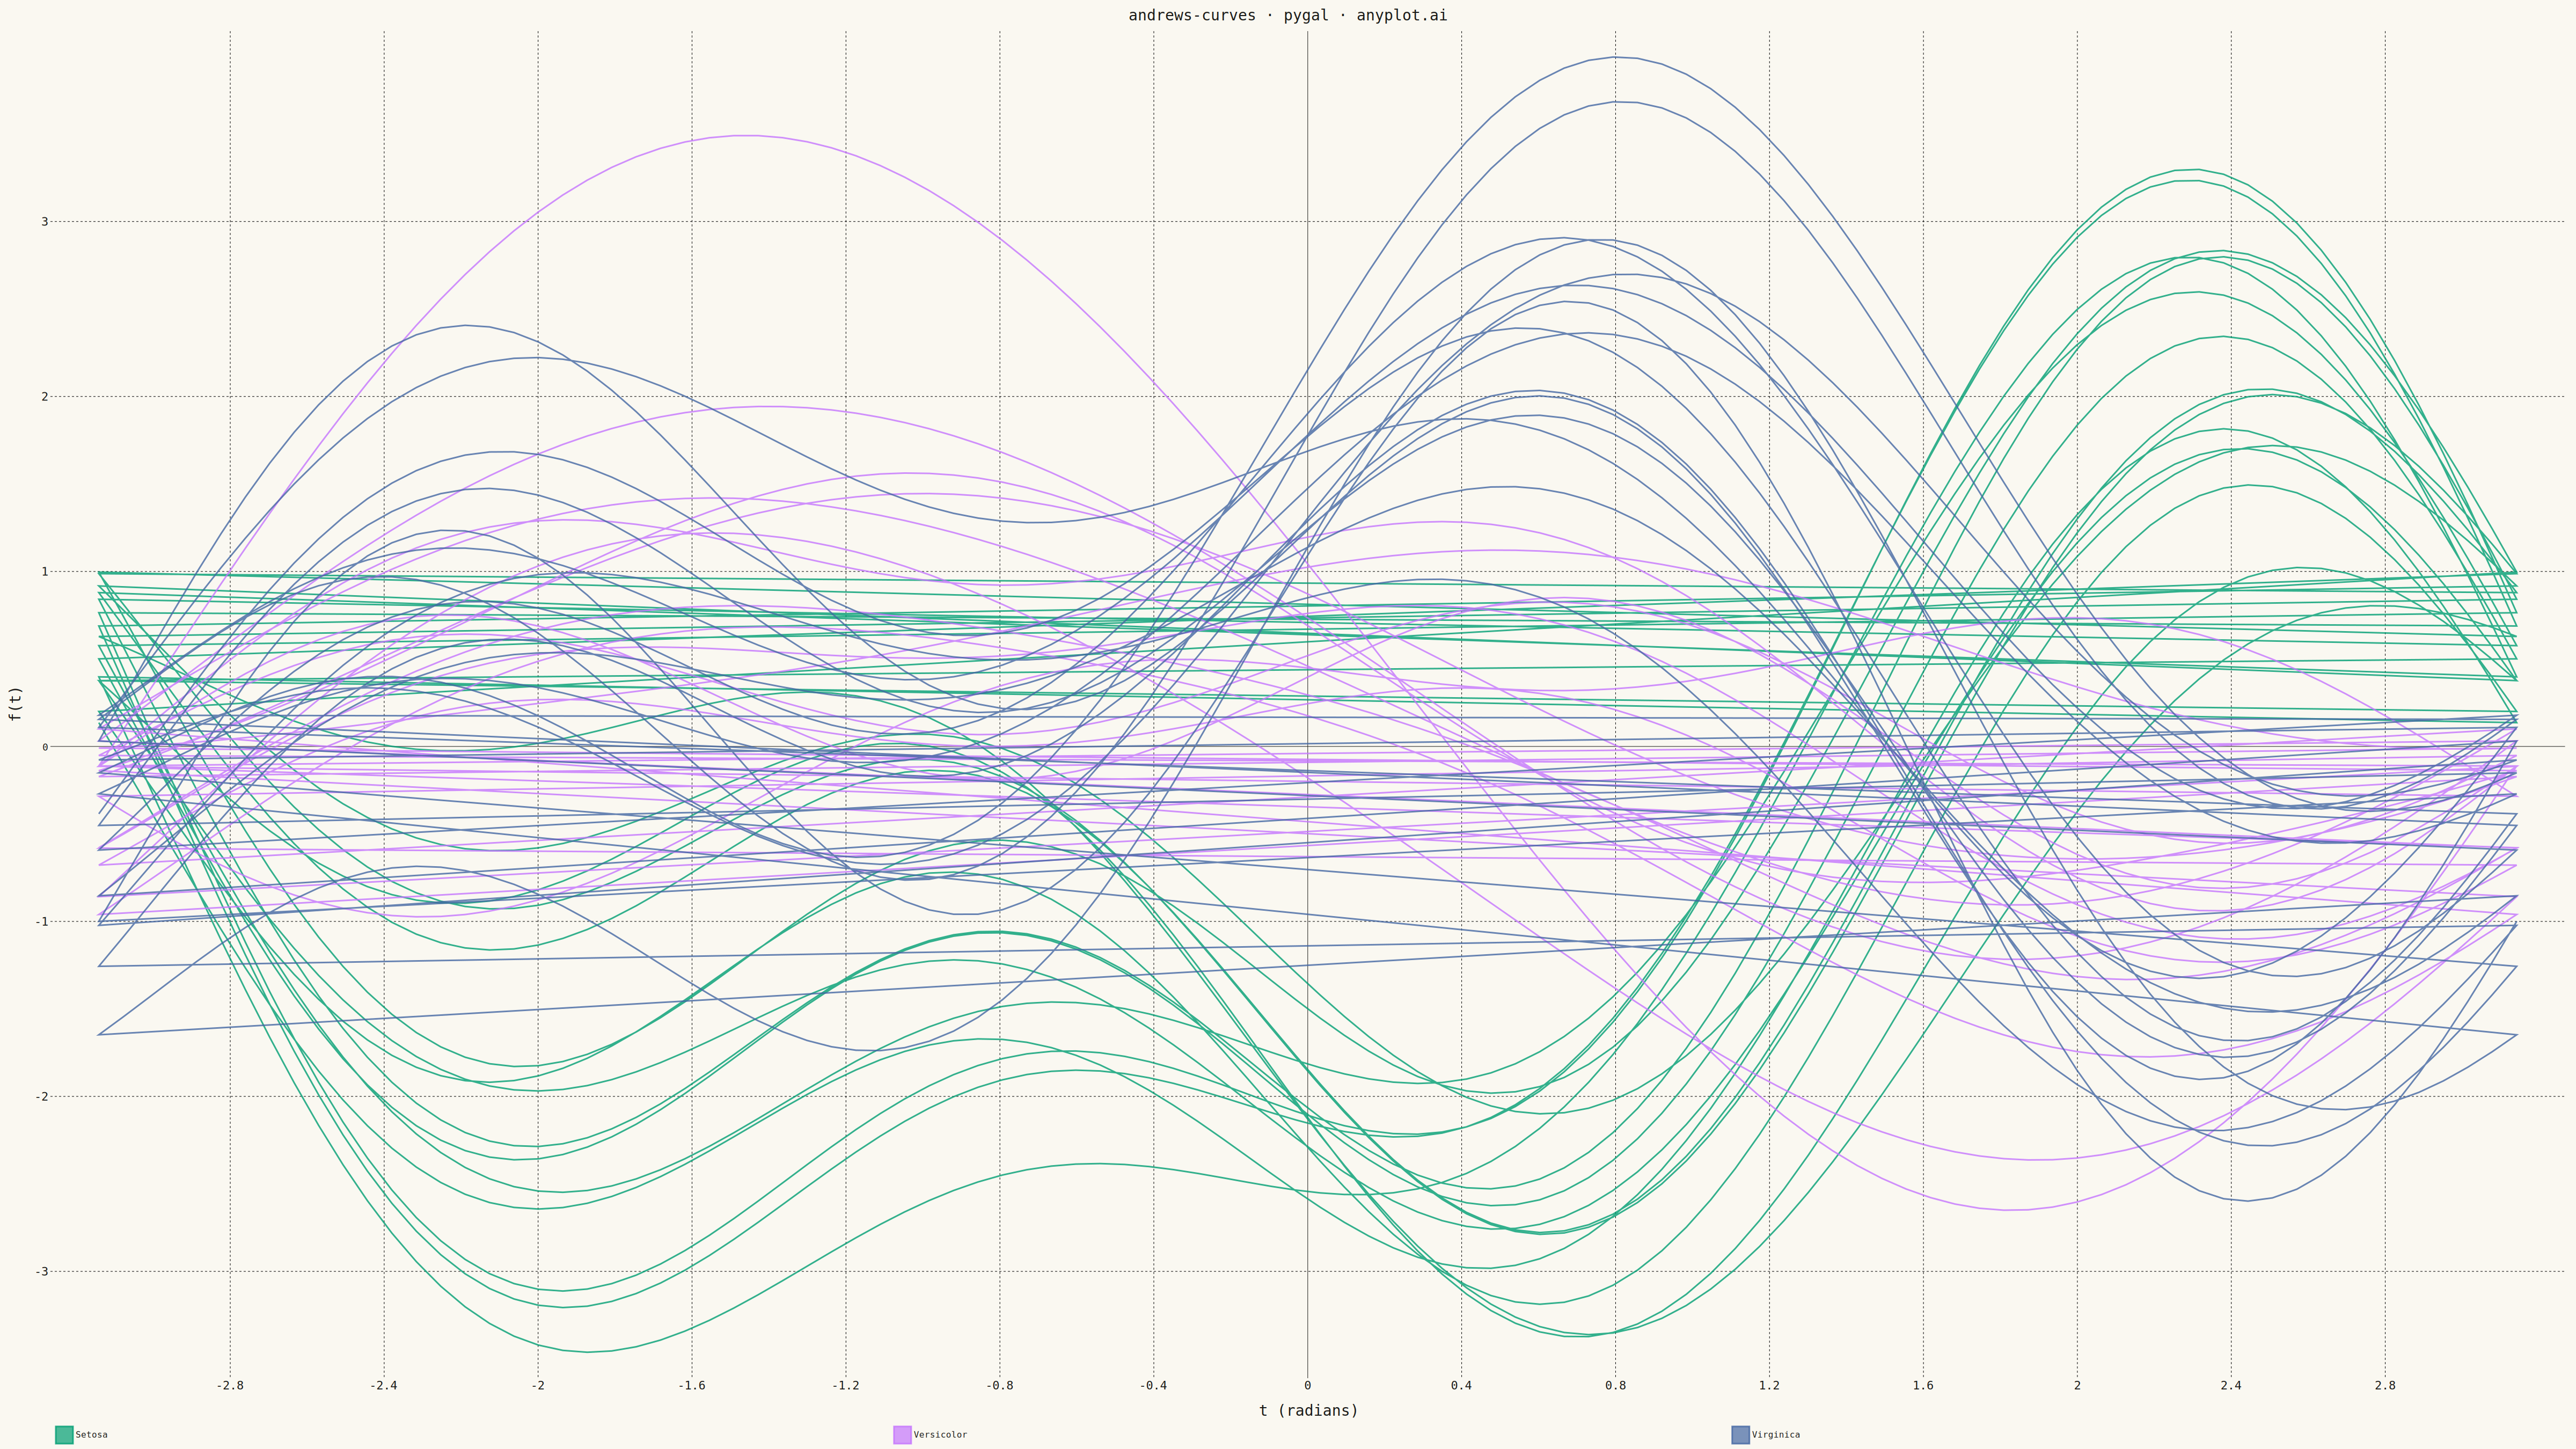
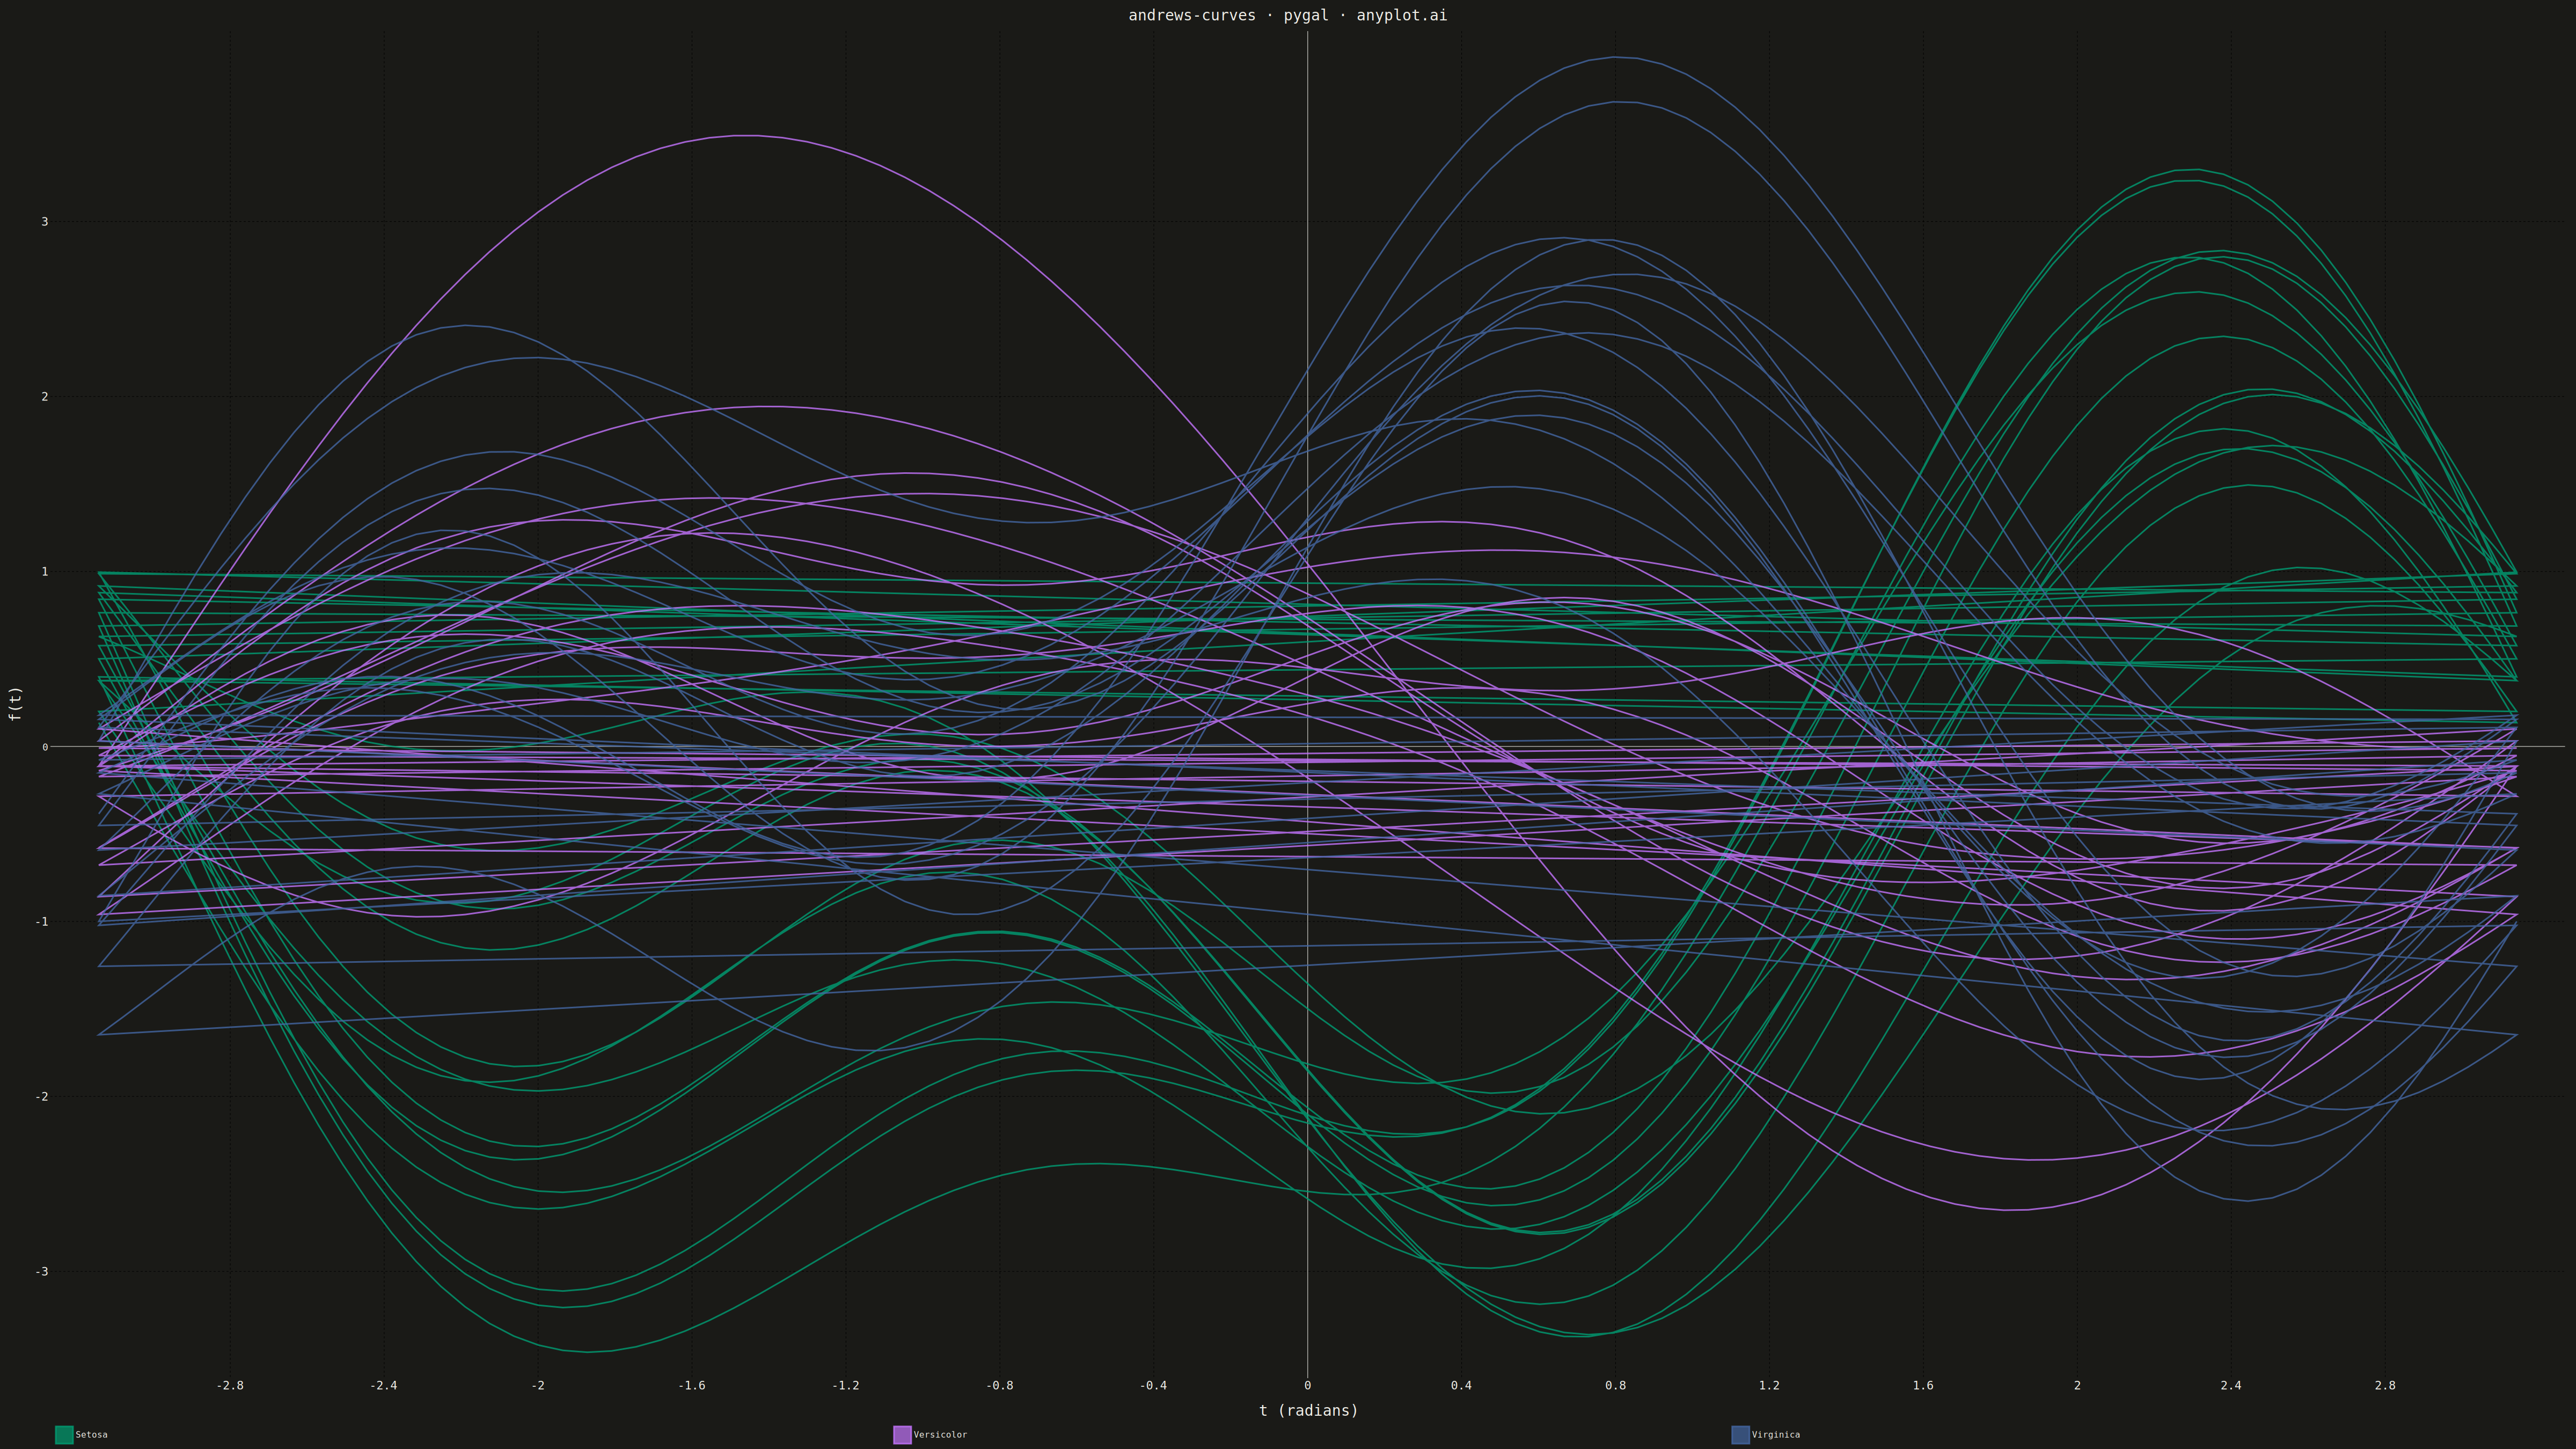
Andrews curves visualization transforms multivariate observations into smooth Fourier series curves. Each data point is represented as a continuous function where variable values become coefficients in a Fourier expansion, producing distinctive wave patterns. This technique enables visual comparison of multivariate patterns, cluster identification, and outlier detection—observations with similar values across variables produce similar curves, while outliers appear as distinctly different patterns.
""" anyplot.ai
andrews-curves: Andrews Curves for Multivariate Data
Library: pygal 3.1.0 | Python 3.13.13
Quality: 88/100 | Updated: 2026-05-15
"""

import os
import sys


# Remove current directory from sys.path to avoid shadowing the pygal module
_cwd = sys.path[0] if sys.path[0] else "."
if _cwd in sys.path:
    sys.path.remove(_cwd)

import numpy as np
import pygal
from pygal.style import Style


# Restore current directory
sys.path.insert(0, _cwd)


# Theme configuration
THEME = os.getenv("ANYPLOT_THEME", "light")
PAGE_BG = "#FAF8F1" if THEME == "light" else "#1A1A17"
INK = "#1A1A17" if THEME == "light" else "#F0EFE8"
INK_MUTED = "#6B6A63" if THEME == "light" else "#A8A79F"

# Okabe-Ito palette (first series always #009E73)
IMPRINT = ("#009E73", "#C475FD", "#4467A3")

# Data
np.random.seed(42)

# Simulate iris-like data (4 features, 3 species)
# Species 1: Setosa - small petals, medium sepals
setosa = np.column_stack(
    [
        np.random.normal(5.0, 0.35, 50),  # sepal length
        np.random.normal(3.4, 0.38, 50),  # sepal width
        np.random.normal(1.5, 0.17, 50),  # petal length
        np.random.normal(0.2, 0.10, 50),  # petal width
    ]
)

# Species 2: Versicolor - medium petals and sepals
versicolor = np.column_stack(
    [
        np.random.normal(5.9, 0.52, 50),  # sepal length
        np.random.normal(2.8, 0.31, 50),  # sepal width
        np.random.normal(4.3, 0.47, 50),  # petal length
        np.random.normal(1.3, 0.20, 50),  # petal width
    ]
)

# Species 3: Virginica - large petals and sepals
virginica = np.column_stack(
    [
        np.random.normal(6.6, 0.64, 50),  # sepal length
        np.random.normal(3.0, 0.32, 50),  # sepal width
        np.random.normal(5.5, 0.55, 50),  # petal length
        np.random.normal(2.0, 0.27, 50),  # petal width
    ]
)

# Combine data
X = np.vstack([setosa, versicolor, virginica])
y = np.array([0] * 50 + [1] * 50 + [2] * 50)
species_names = ["Setosa", "Versicolor", "Virginica"]

# Normalize variables (z-score standardization)
X_mean = X.mean(axis=0)
X_std = X.std(axis=0)
X_scaled = (X - X_mean) / X_std

# Andrews curve function: f(t) = x1/sqrt(2) + x2*sin(t) + x3*cos(t) + x4*sin(2t) + ...
t_values = np.linspace(-np.pi, np.pi, 100)

# Number of curves per species to display
n_curves_per_species = 15

# Custom style for theme-adaptive rendering
custom_style = Style(
    background=PAGE_BG,
    plot_background=PAGE_BG,
    foreground=INK,
    foreground_strong=INK,
    foreground_subtle=INK_MUTED,
    colors=IMPRINT,
    title_font_size=28,
    label_font_size=22,
    major_label_font_size=18,
    legend_font_size=16,
    value_font_size=14,
    stroke_width=3,
)

# Create XY chart
chart = pygal.XY(
    width=4800,
    height=2700,
    style=custom_style,
    title="andrews-curves · pygal · anyplot.ai",
    x_title="t (radians)",
    y_title="f(t)",
    show_dots=False,
    stroke_style={"width": 2},
    show_x_guides=True,
    show_y_guides=True,
    legend_at_bottom=True,
    legend_at_bottom_columns=3,
    legend_box_size=32,
    truncate_legend=-1,
)

# Plot curves for each species
for species_idx in range(3):
    species_mask = y == species_idx
    species_data = X_scaled[species_mask]
    original_data = X[species_mask]

    # Sample curves per species for clarity
    indices = np.random.choice(len(species_data), n_curves_per_species, replace=False)

    # Collect all points for this species into a single series
    all_points = []
    for curve_num, idx in enumerate(indices):
        row = species_data[idx]
        orig = original_data[idx]
        # Andrews transform: f(t) = x1/sqrt(2) + x2*sin(t) + x3*cos(t) + x4*sin(2t)
        curve_values = (
            row[0] / np.sqrt(2) + row[1] * np.sin(t_values) + row[2] * np.cos(t_values) + row[3] * np.sin(2 * t_values)
        )
        # Create points for the curve
        points = [(float(t), float(v)) for t, v in zip(t_values, curve_values, strict=True)]
        all_points.extend(points)
        # Add None to create a break between curves
        if curve_num < len(indices) - 1:
            all_points.append(None)

    # Add series for this species
    chart.add(species_names[species_idx], all_points, show_dots=False)

# Save outputs
chart.render_to_file(f"plot-{THEME}.html")
chart.render_to_png(f"plot-{THEME}.png")
Runnable source as JSON, for any HTTP client: https://api.anyplot.ai/specs/andrews-curves/pygal/code. Any spec id and library id listed in llms-full.txt fit the same URL shape; every URL below is complete and callable.
{
  "spec_id": "andrews-curves",
  "language": "python",
  "library": "pygal",
  "page": "https://anyplot.ai/andrews-curves/python/pygal",
  "hub": "https://anyplot.ai/andrews-curves",
  "code_json": "https://api.anyplot.ai/specs/andrews-curves/pygal/code",
  "spec_json": "https://api.anyplot.ai/specs/andrews-curves",
  "render_light_png": "https://storage.googleapis.com/anyplot-images/plots/andrews-curves/python/pygal/plot-light.png",
  "render_dark_png": "https://storage.googleapis.com/anyplot-images/plots/andrews-curves/python/pygal/plot-dark.png",
  "interactive_light_html": "https://storage.googleapis.com/anyplot-images/plots/andrews-curves/python/pygal/plot-light.html",
  "interactive_dark_html": "https://storage.googleapis.com/anyplot-images/plots/andrews-curves/python/pygal/plot-dark.html",
  "quality_score": 88.0,
  "license": "MIT",
  "guide": "https://anyplot.ai/llms.txt"
}
Part of Andrews Curves for Multivariate Data on anyplot.ai.