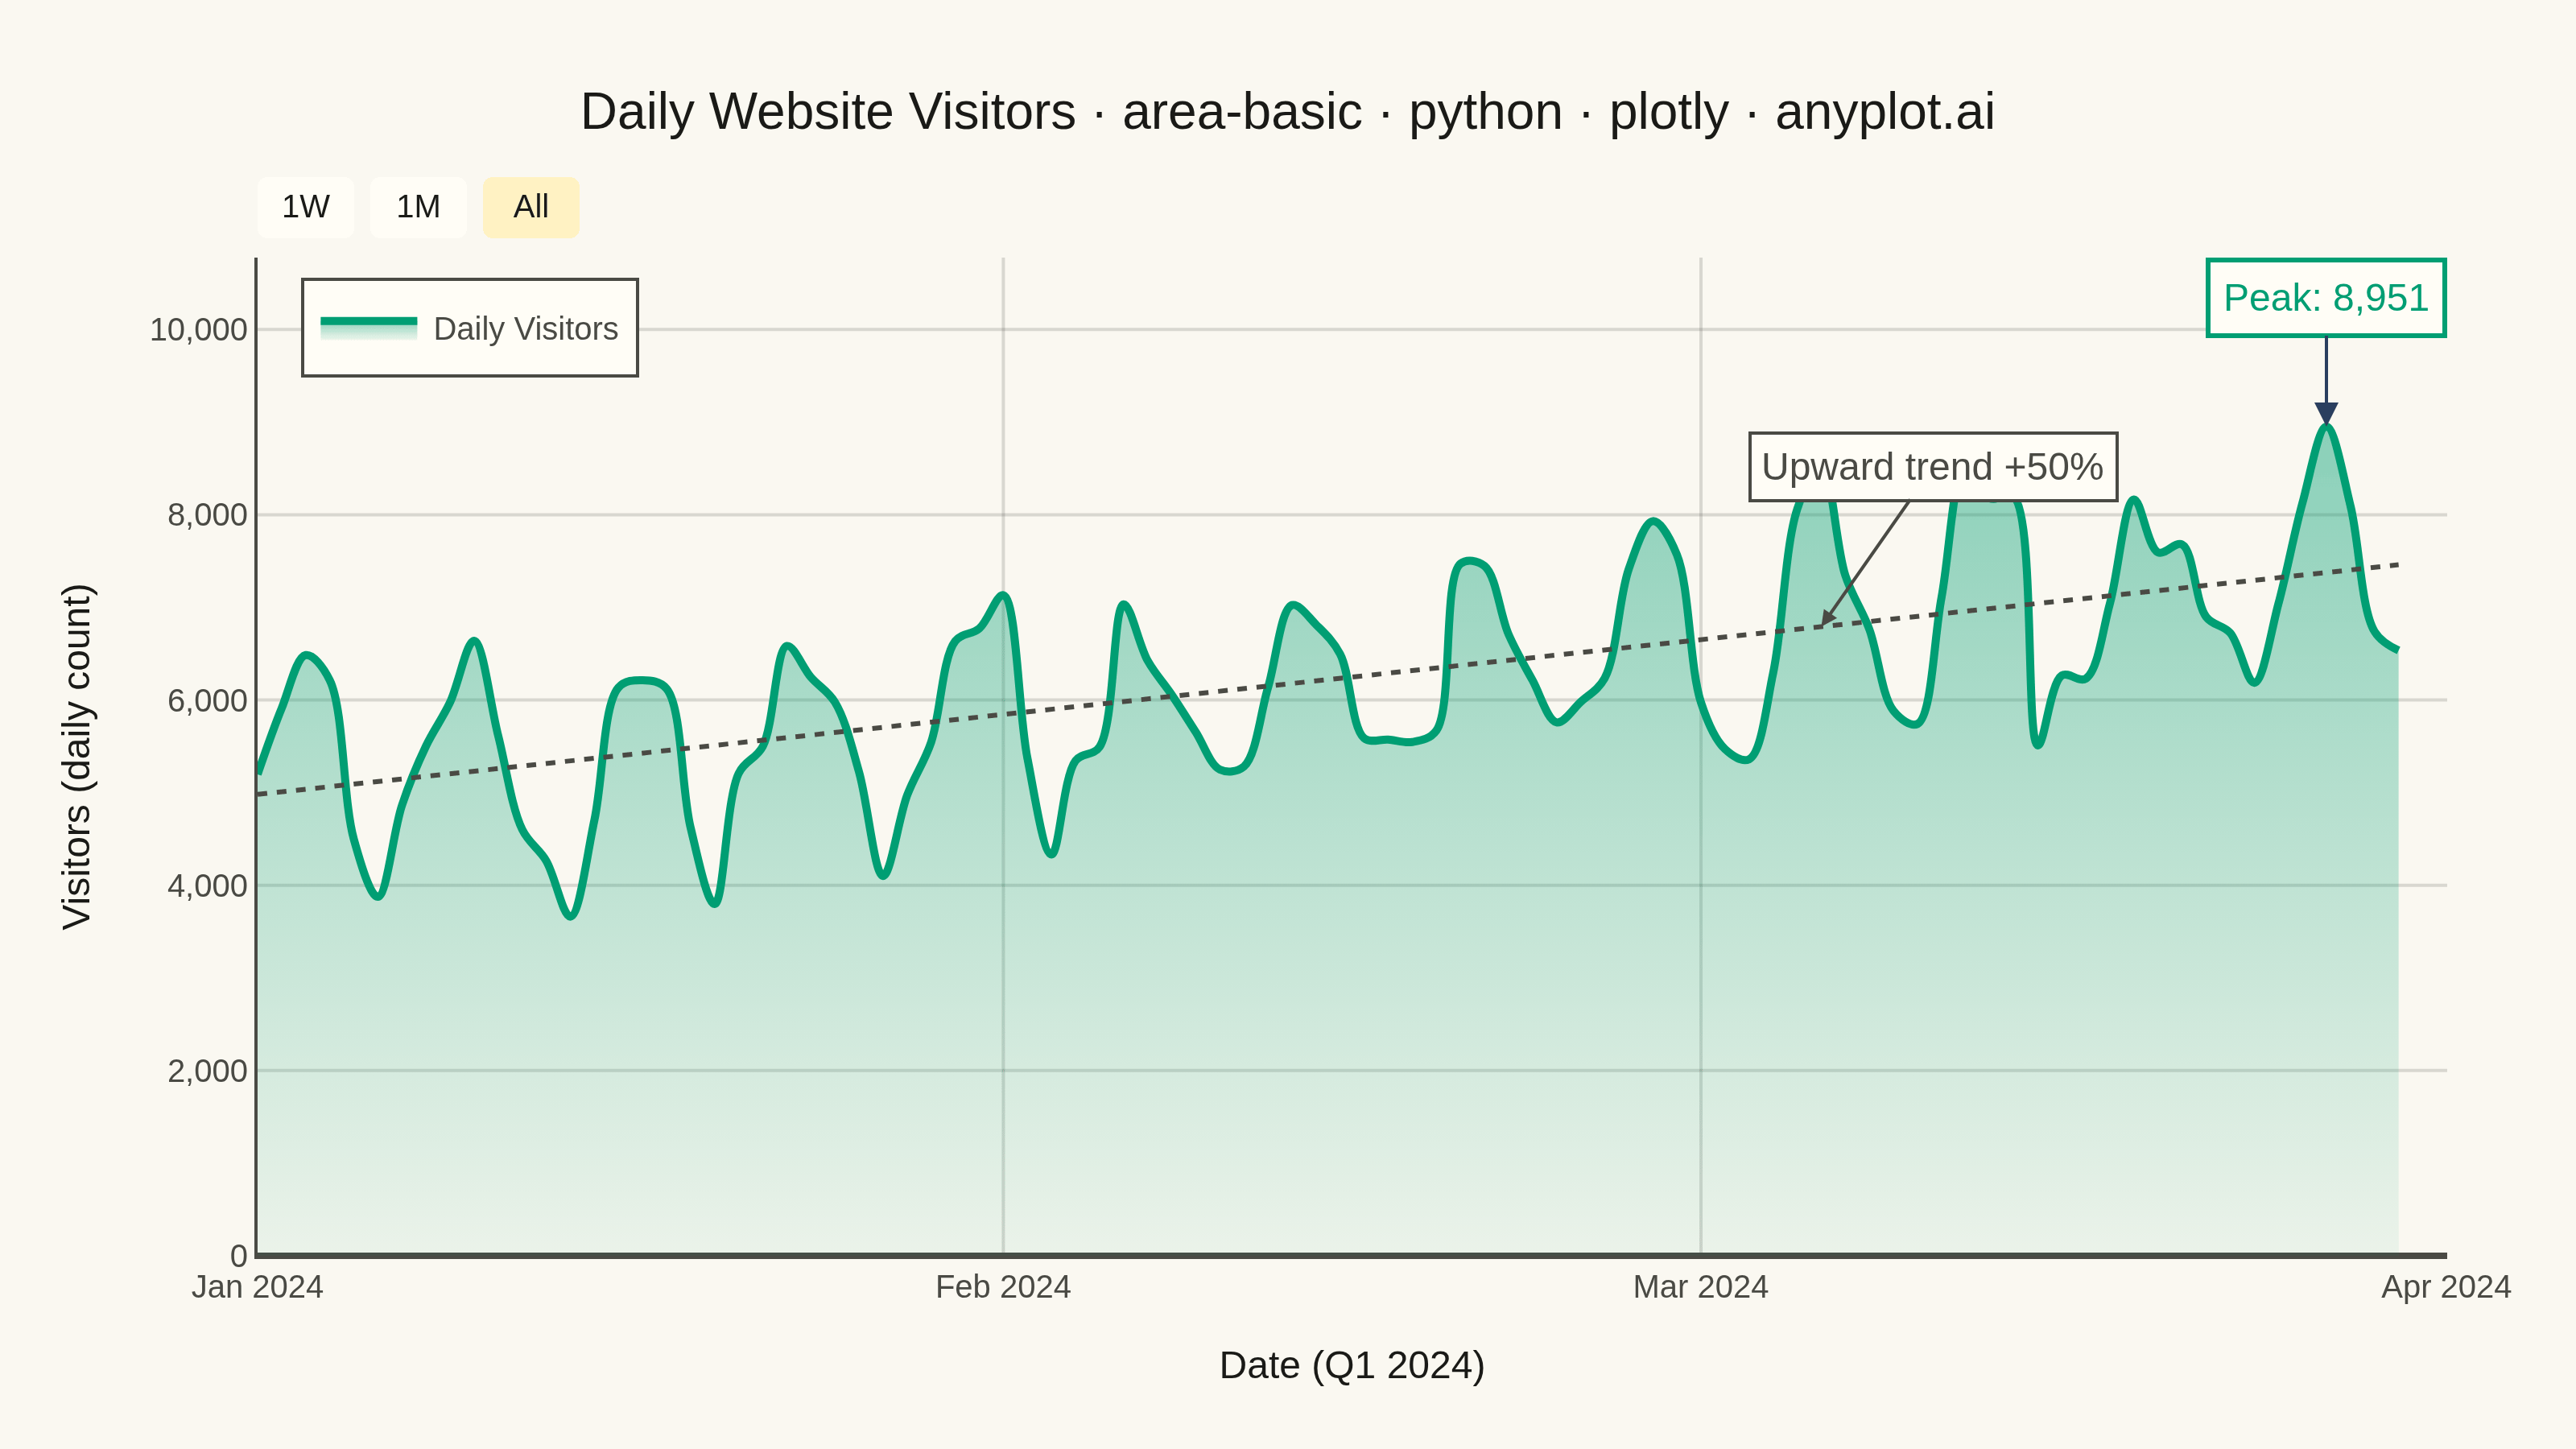
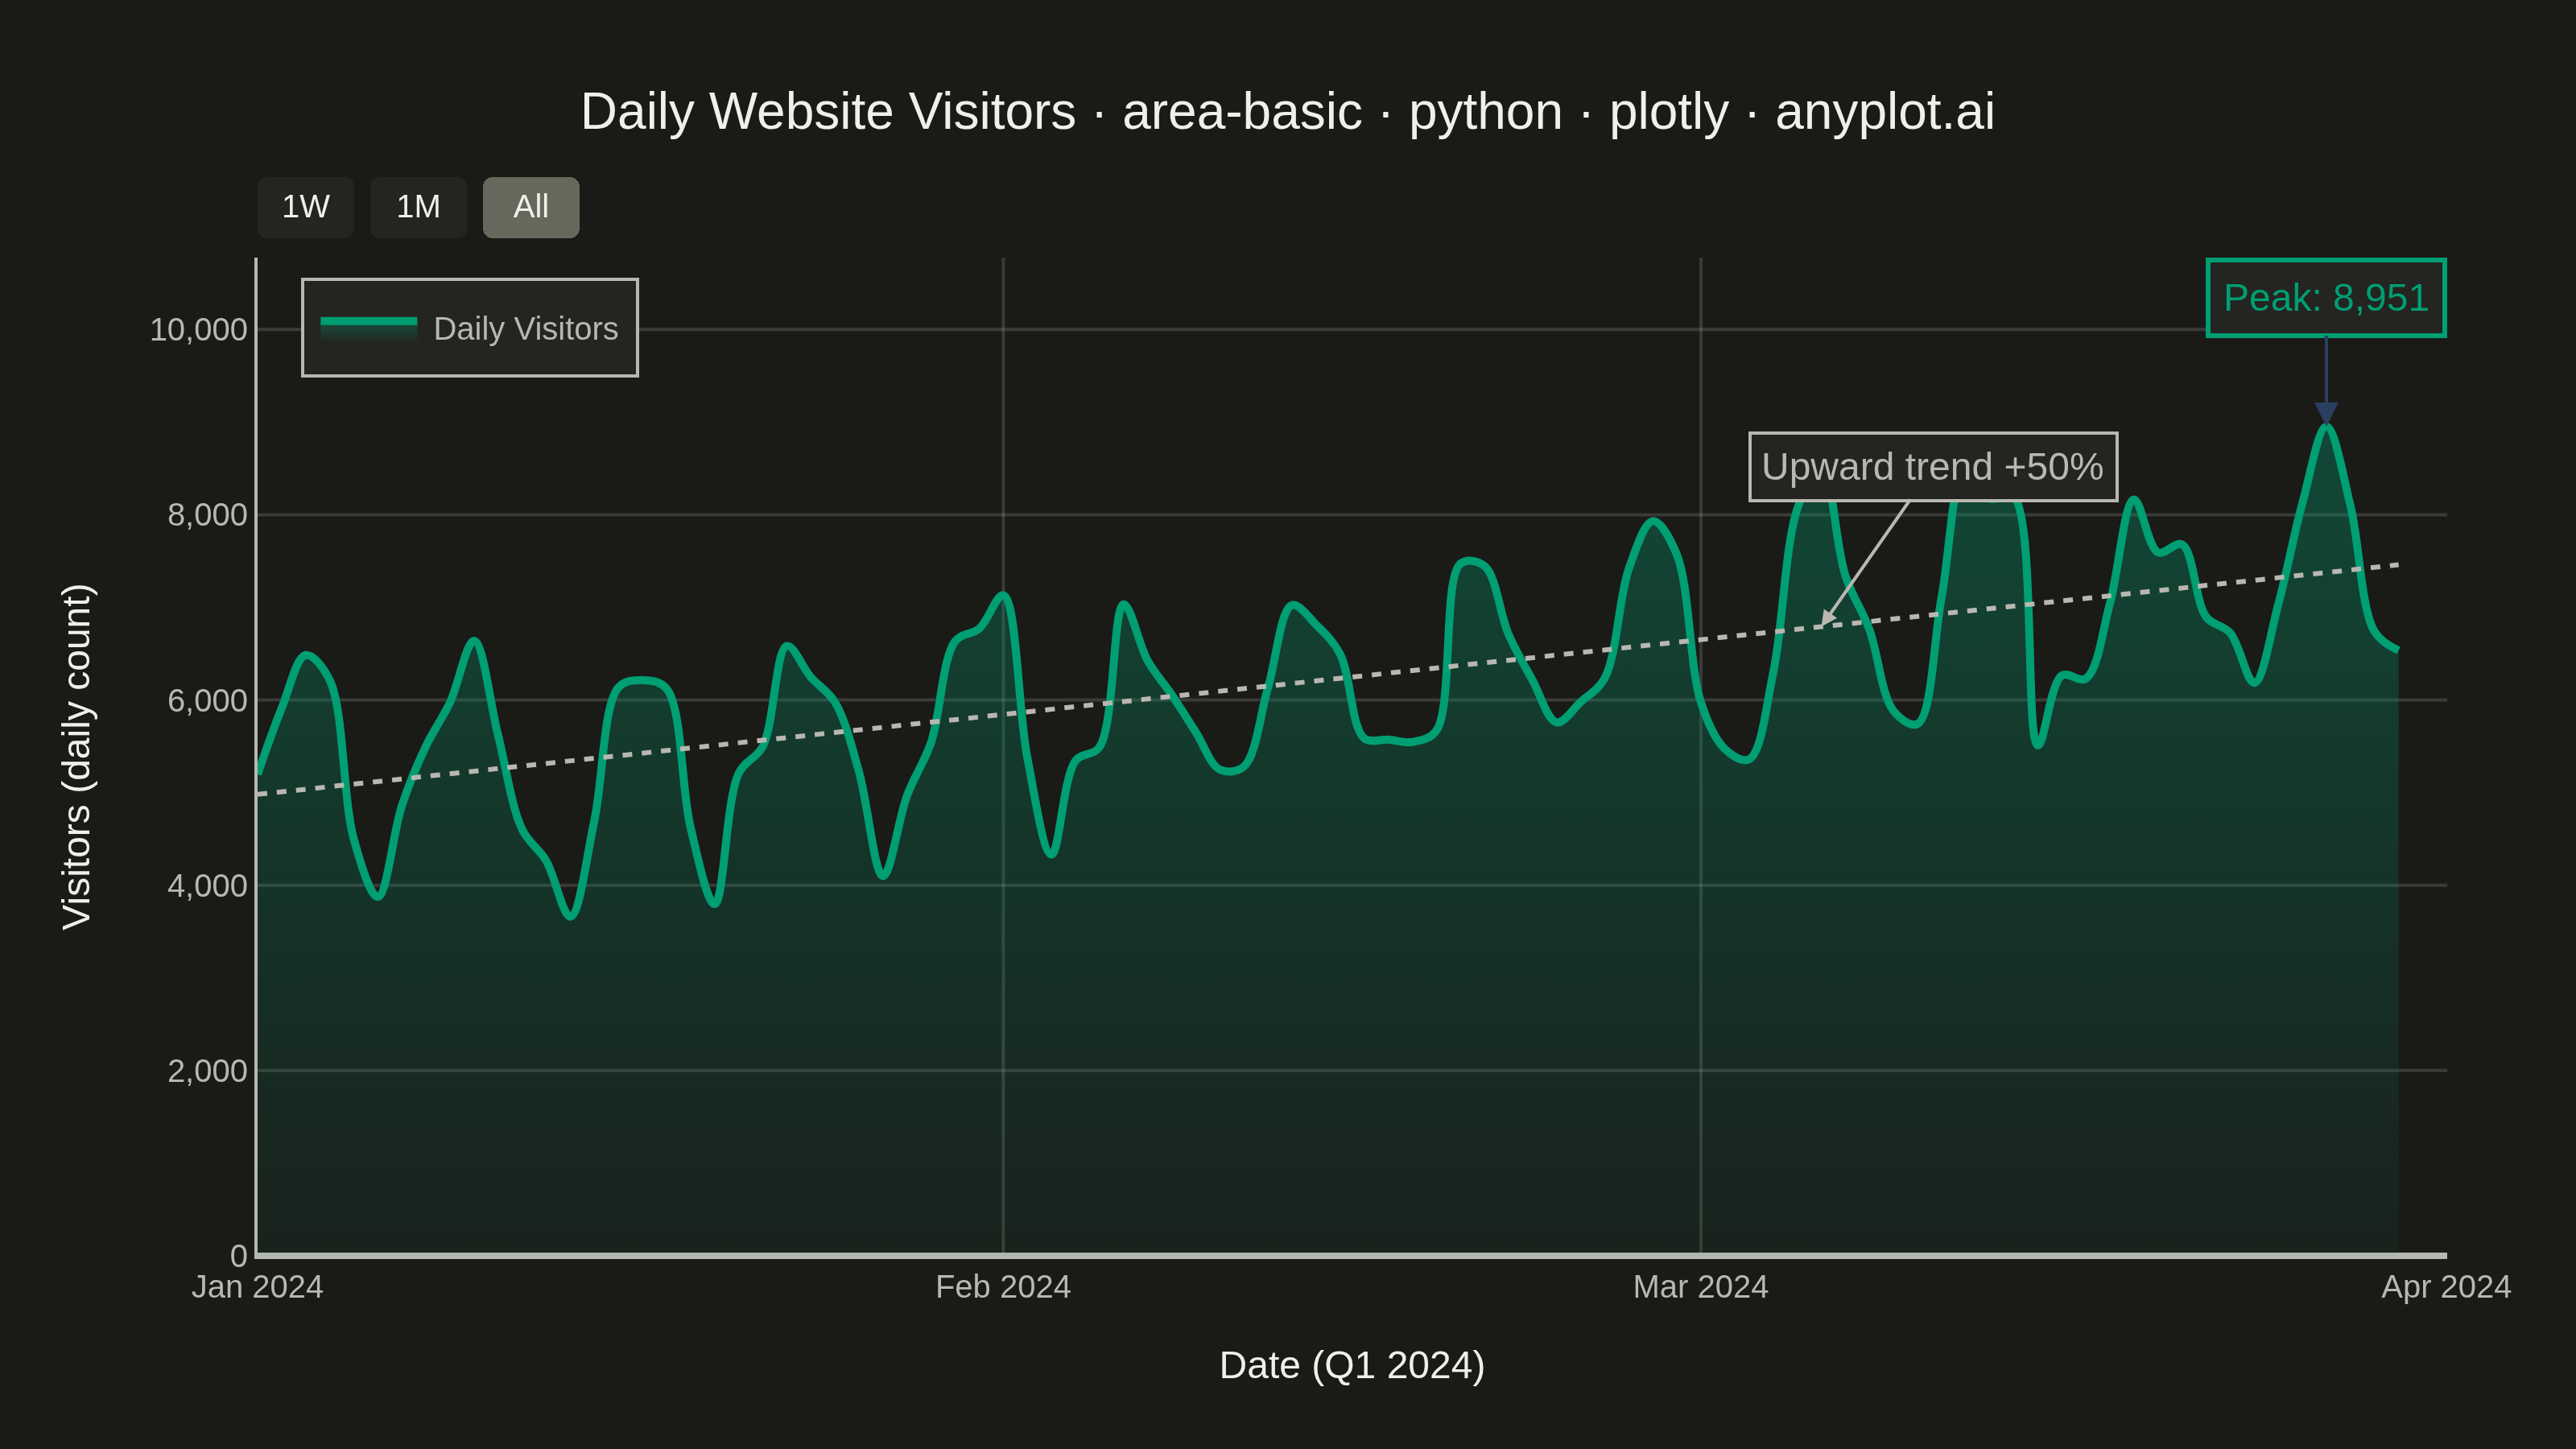
An area chart showing quantitative data over a continuous axis with the area below the line filled. It emphasizes the magnitude of values over time by filling the space between the line and axis, creating visual weight that helps readers understand volume and trends. Particularly effective for showing cumulative totals, resource consumption, or any data where the "amount" is as important as the trend.
Preview render from the Plotly implementation.