The same plot in 14 other libraries — Python: Altair, Bokeh, lets-plot, Matplotlib, Plotly, plotnine, Pygal, Seaborn; R: ggplot2; JavaScript: Chart.js, D3.js, Apache ECharts, Highcharts, MUI X Charts. Compare all 15 side by side: Basic Area Chart in Python, R, Julia and JavaScript.
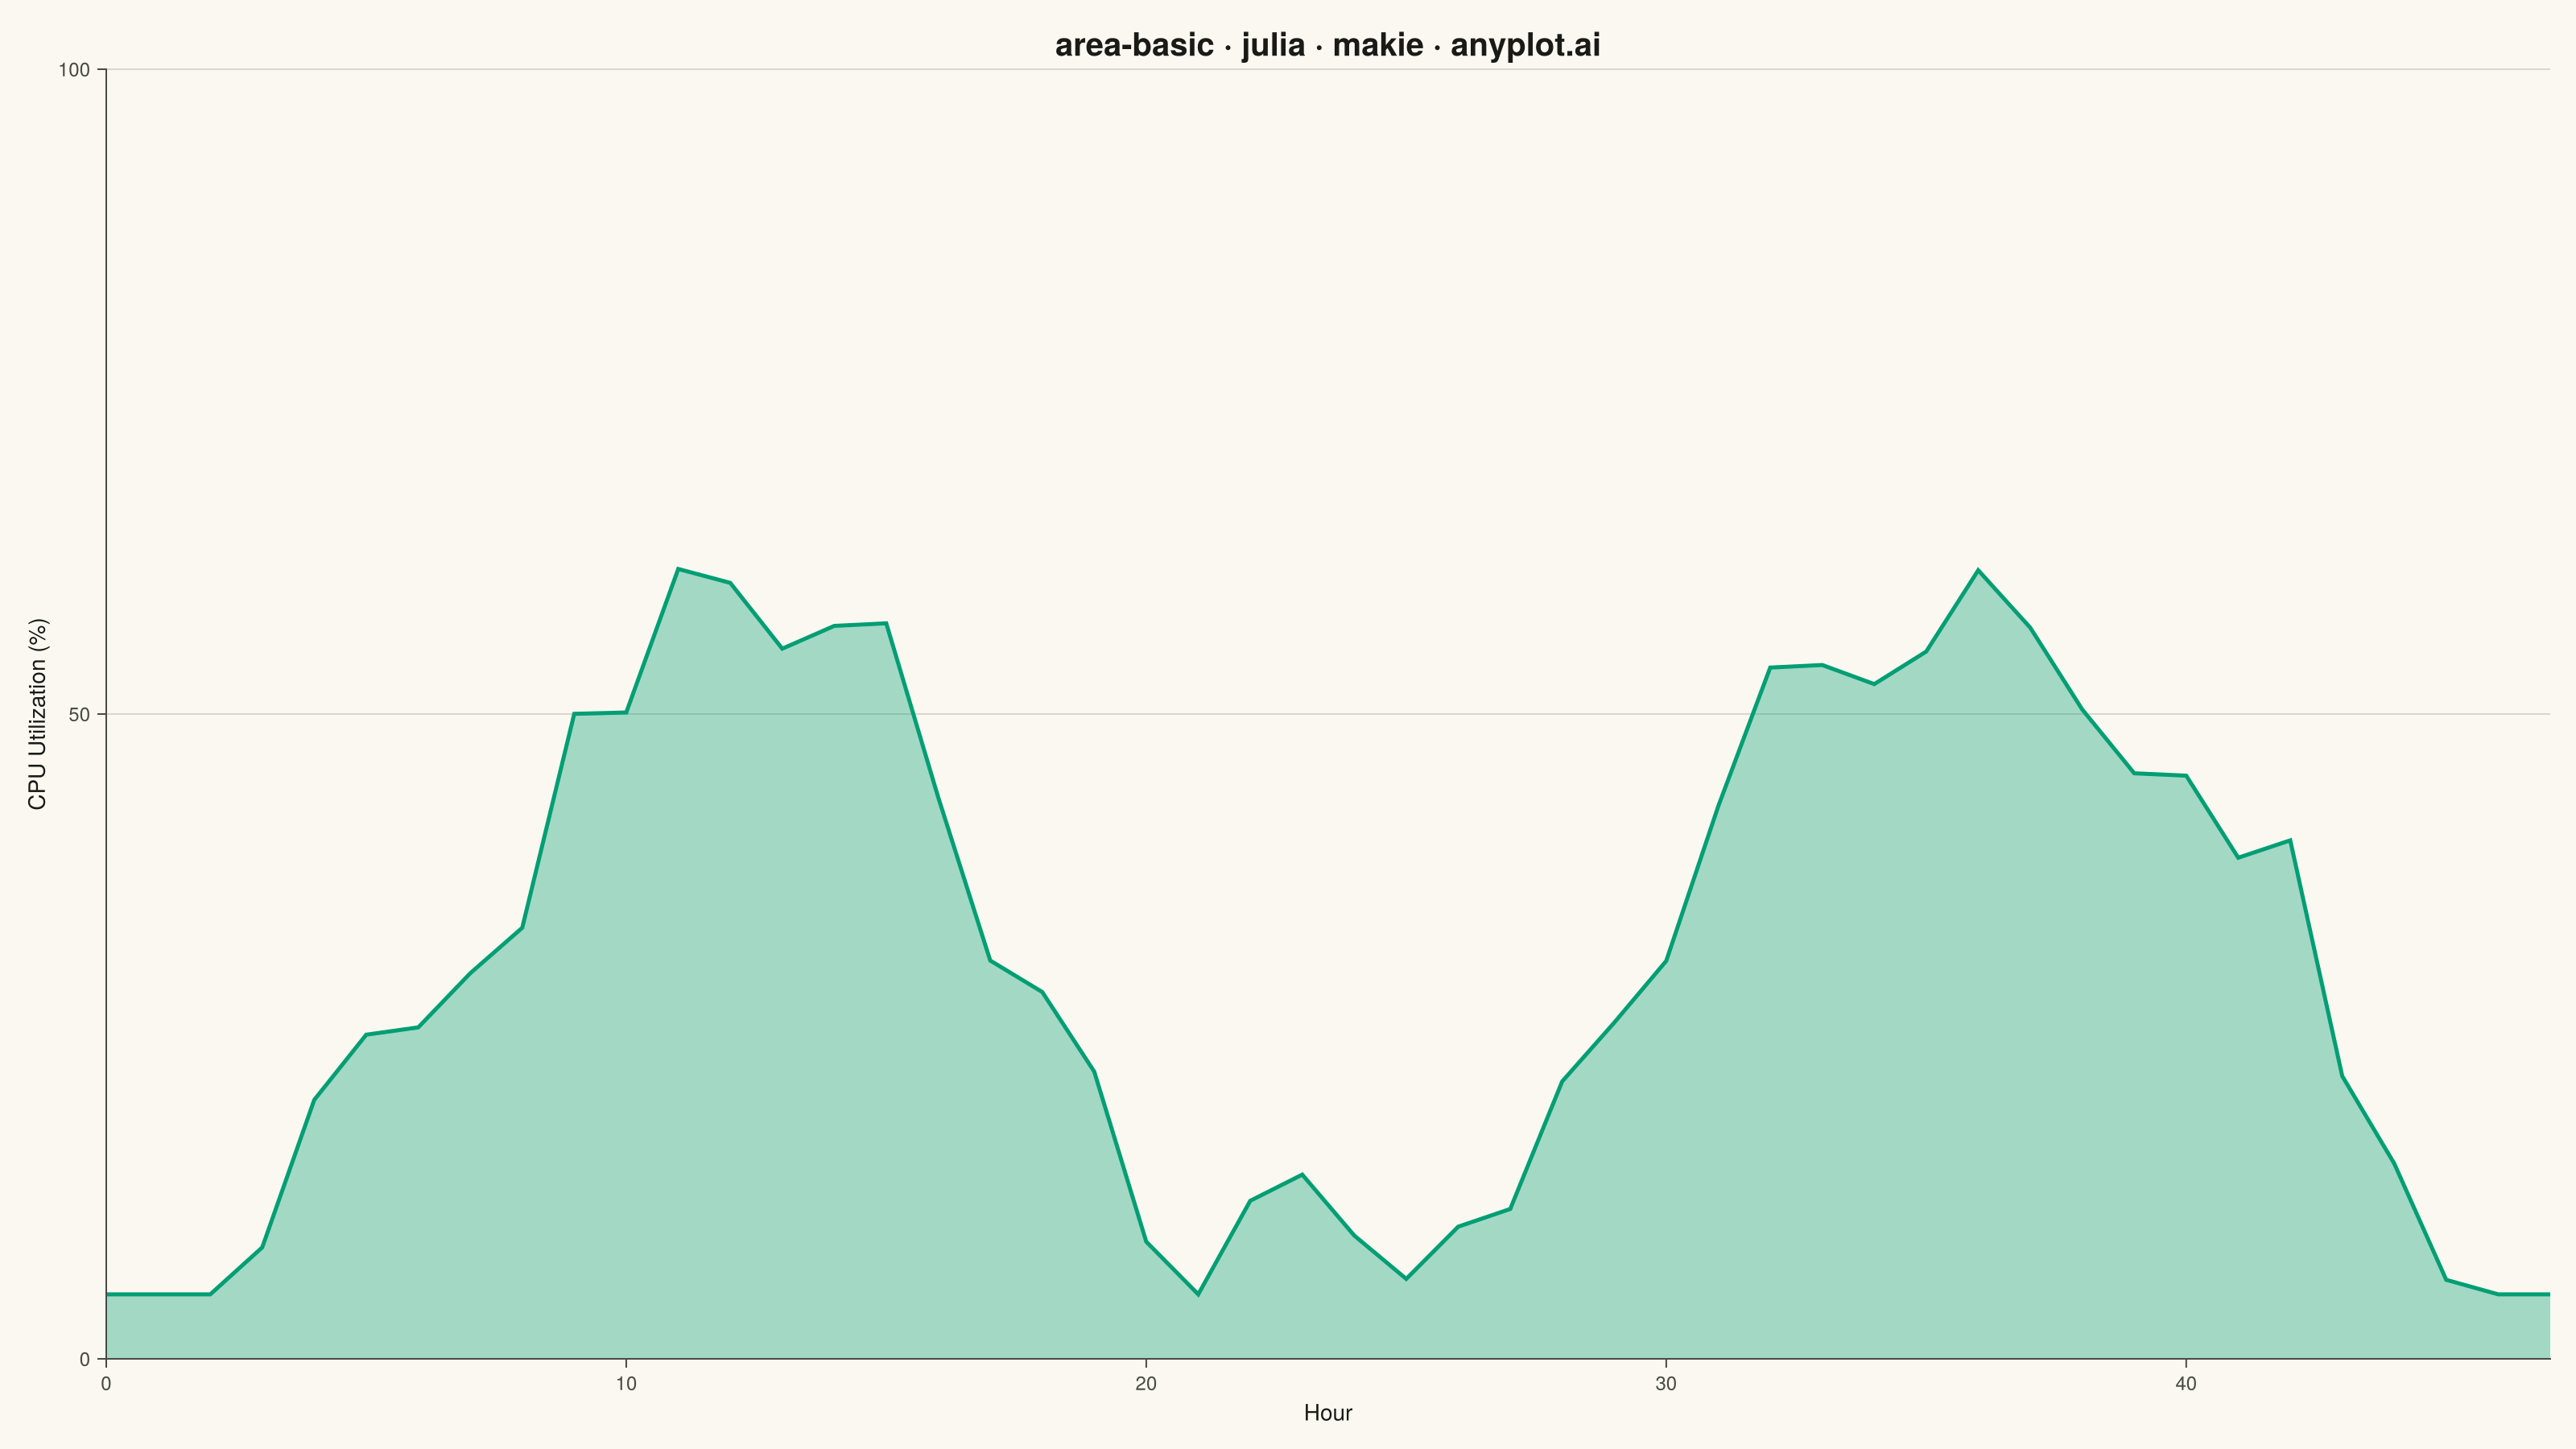
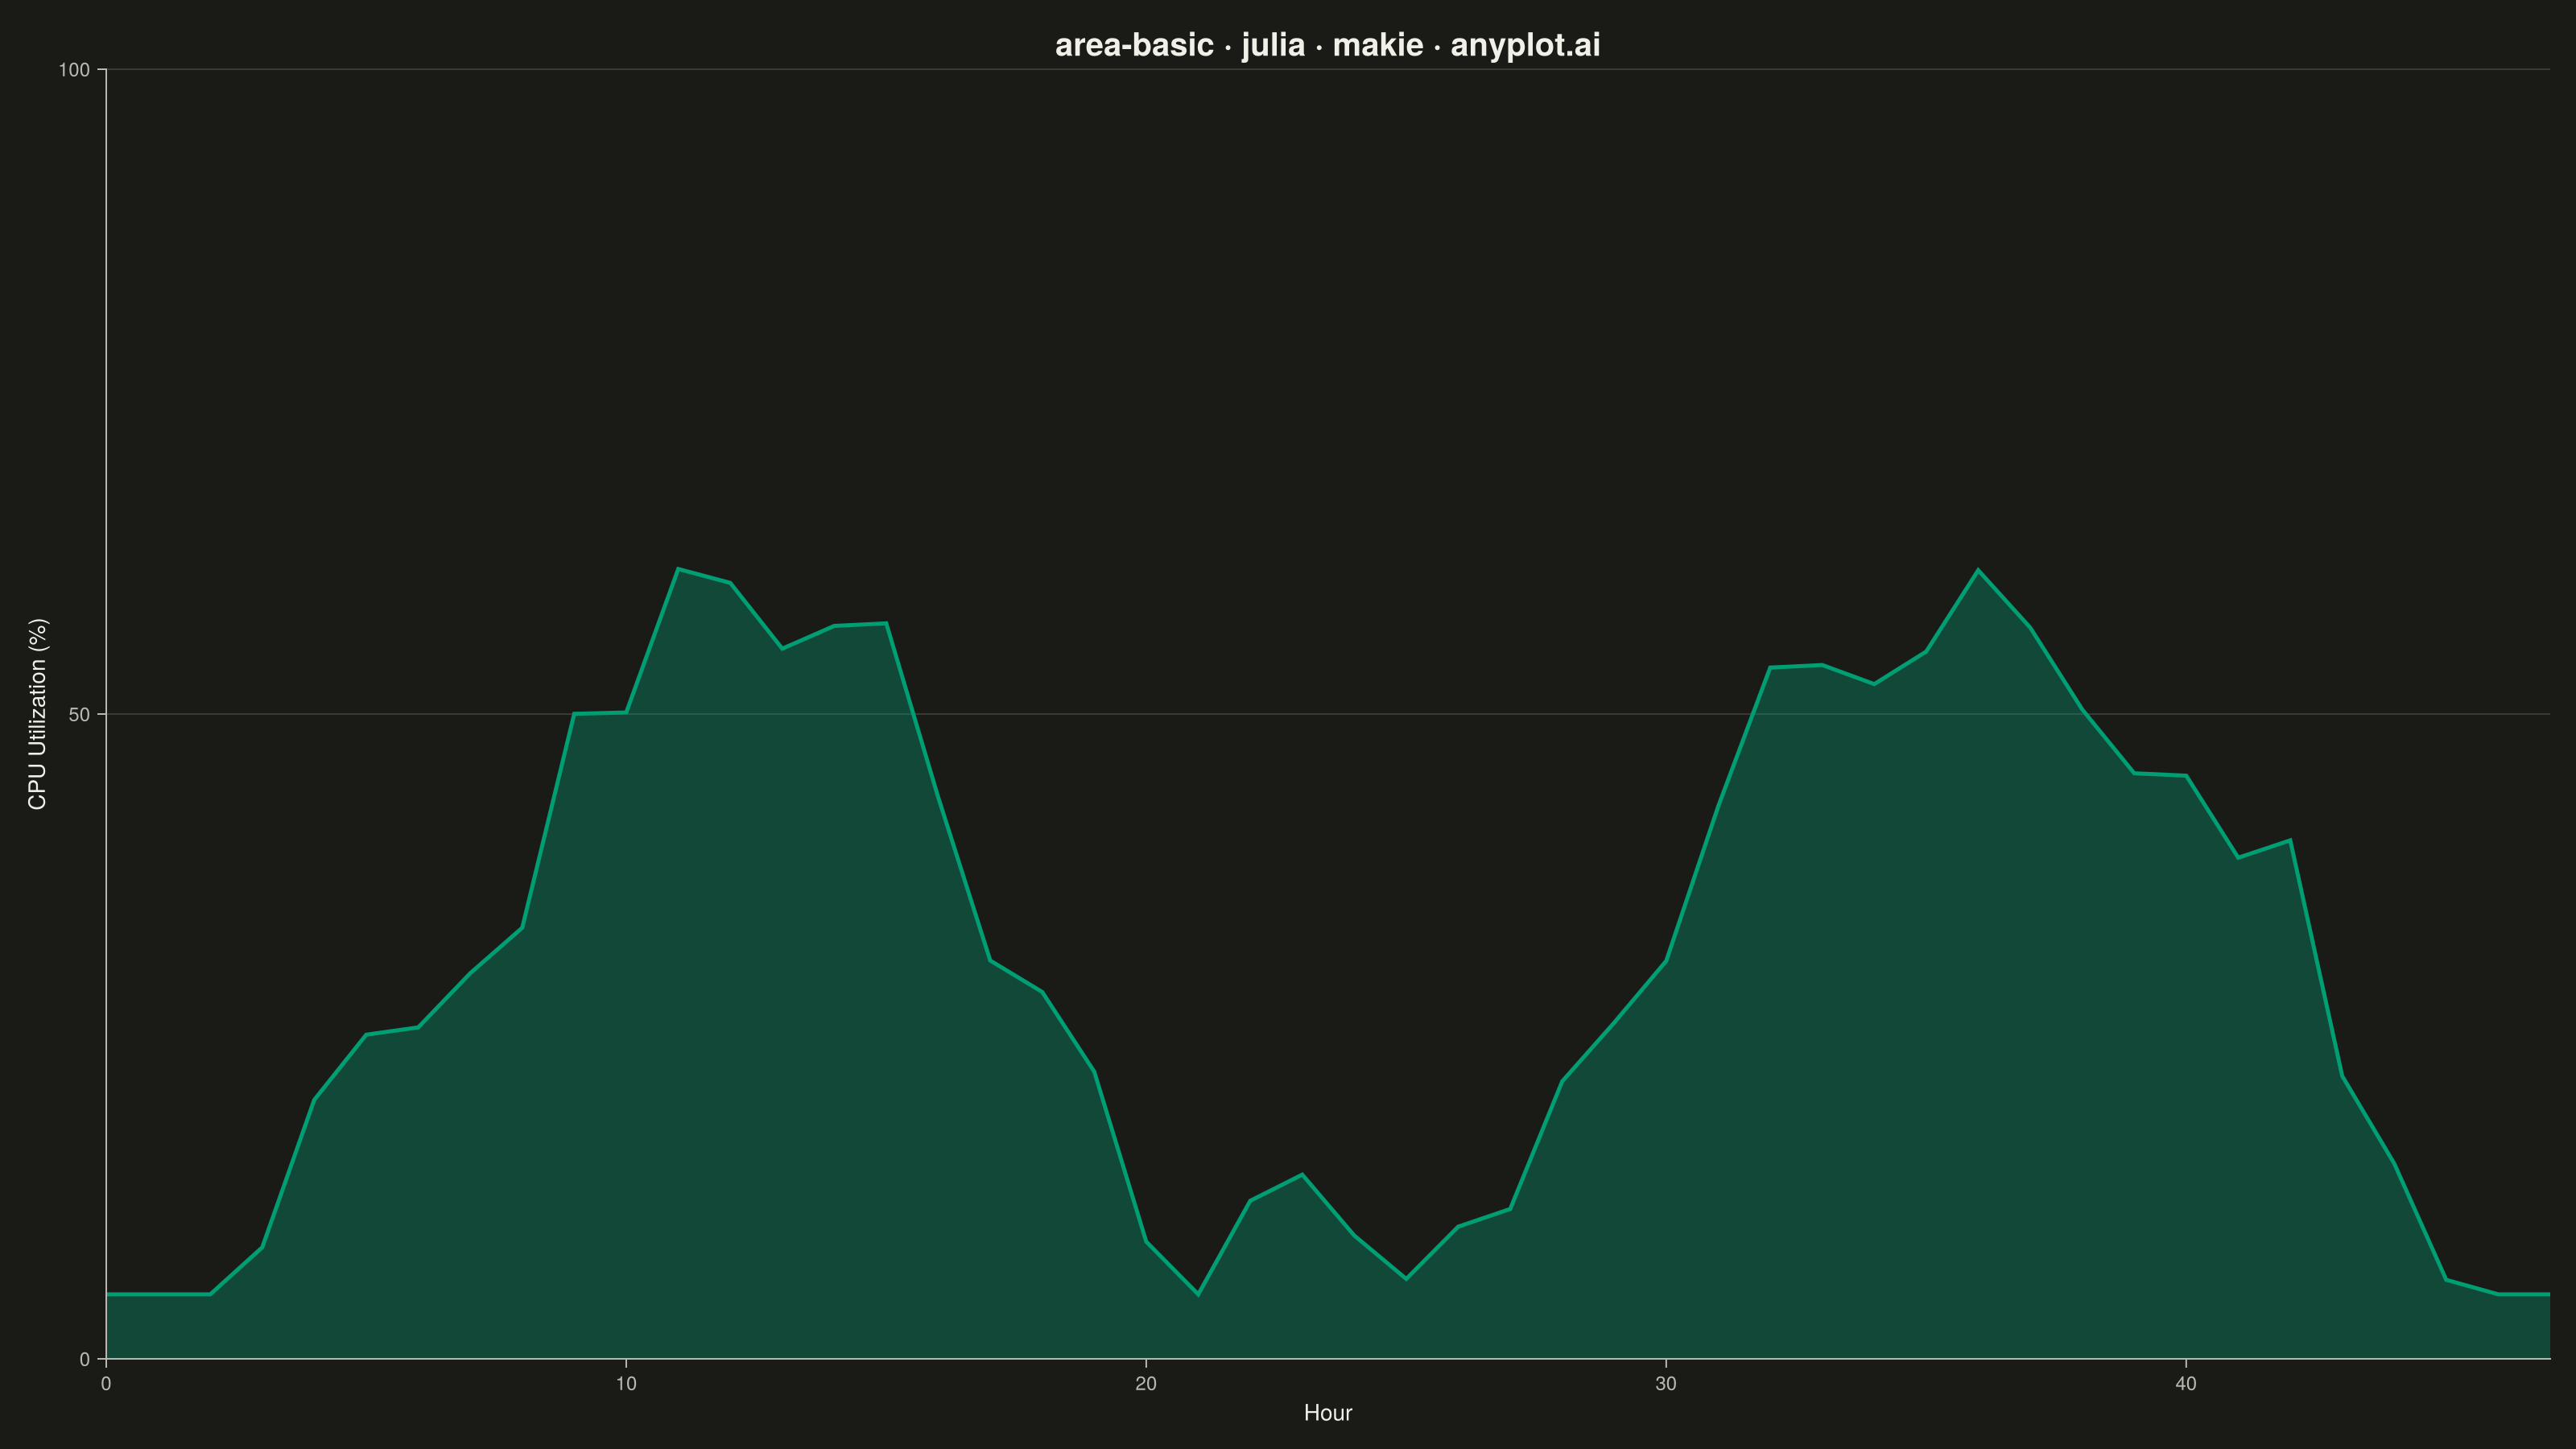
An area chart showing quantitative data over a continuous axis with the area below the line filled. It emphasizes the magnitude of values over time by filling the space between the line and axis, creating visual weight that helps readers understand volume and trends. Particularly effective for showing cumulative totals, resource consumption, or any data where the "amount" is as important as the trend.
# anyplot.ai
# area-basic: Basic Area Chart
# Library: makie 0.22.10 | Julia 1.11.9
# Quality: 91/100 | Created: 2026-05-28

using CairoMakie
using Colors
using Random

Random.seed!(42)

# Theme tokens
const THEME       = get(ENV, "ANYPLOT_THEME", "light")
const PAGE_BG     = THEME == "light" ? colorant"#FAF8F1" : colorant"#1A1A17"
const INK         = THEME == "light" ? colorant"#1A1A17" : colorant"#F0EFE8"
const INK_SOFT    = THEME == "light" ? colorant"#4A4A44" : colorant"#B8B7B0"
const IMPRINT_PALETTE = [
    colorant"#009E73", colorant"#C475FD", colorant"#4467A3", colorant"#BD8233",
    colorant"#AE3030", colorant"#2ABCCD", colorant"#954477", colorant"#99B314",
]

# Data: hourly CPU utilization over 48 hours (diurnal workload pattern)
n = 48
hours = collect(0:(n - 1))
base_load = 30.0 .+ 28.0 .* sin.(2π .* (hours .- 6) ./ 24)
noise = 5.0 .* randn(n)
cpu_usage = clamp.(base_load .+ noise, 5.0, 95.0)

# Plot
fig = Figure(
    size            = (1600, 900),
    fontsize        = 14,
    backgroundcolor = PAGE_BG,
)

ax = Axis(
    fig[1, 1];
    title              = "area-basic · julia · makie · anyplot.ai",
    titlesize          = 20,
    titlecolor         = INK,
    xlabel             = "Hour",
    ylabel             = "CPU Utilization (%)",
    xlabelsize         = 14,
    ylabelsize         = 14,
    xlabelcolor        = INK,
    ylabelcolor        = INK,
    xticklabelsize     = 12,
    yticklabelsize     = 12,
    xticklabelcolor    = INK_SOFT,
    yticklabelcolor    = INK_SOFT,
    xtickcolor         = INK_SOFT,
    ytickcolor         = INK_SOFT,
    backgroundcolor    = PAGE_BG,
    topspinevisible    = false,
    rightspinevisible  = false,
    leftspinecolor     = INK_SOFT,
    bottomspinecolor   = INK_SOFT,
    xgridvisible       = false,
    ygridcolor         = RGBAf(Float32(INK.r), Float32(INK.g), Float32(INK.b), 0.15f0),
    yticks             = [0, 25, 50, 75, 100],
    yminorgridvisible  = false,
    xminorgridvisible  = false,
)

# Area fill (semi-transparent)
band!(ax, hours, zeros(n), cpu_usage;
    color = (IMPRINT_PALETTE[1], 0.35))

# Line on top
lines!(ax, hours, cpu_usage;
    color     = IMPRINT_PALETTE[1],
    linewidth = 2.5)

# Day boundary — vertical dashed separator at hour 24
vlines!(ax, [24]; color = (INK_SOFT, 0.5), linewidth = 1.5, linestyle = :dash)

# Day labels near the top of the plot area
text!(ax, 12, 93; text = "Day 1", color = INK_SOFT, fontsize = 12, align = (:center, :top))
text!(ax, 36, 93; text = "Day 2", color = INK_SOFT, fontsize = 12, align = (:center, :top))

ylims!(ax, 0, 100)
xlims!(ax, 0, n - 1)

# Save
save("plot-$(THEME).png", fig; px_per_unit = 2)
Runnable source as JSON, for any HTTP client: https://api.anyplot.ai/specs/area-basic/makie/code. Any spec id and library id listed in llms-full.txt fit the same URL shape; every URL below is complete and callable.
{
  "spec_id": "area-basic",
  "language": "julia",
  "library": "makie",
  "page": "https://anyplot.ai/area-basic/julia/makie",
  "hub": "https://anyplot.ai/area-basic",
  "code_json": "https://api.anyplot.ai/specs/area-basic/makie/code",
  "spec_json": "https://api.anyplot.ai/specs/area-basic",
  "render_light_png": "https://storage.googleapis.com/anyplot-images/plots/area-basic/julia/makie/plot-light.png",
  "render_dark_png": "https://storage.googleapis.com/anyplot-images/plots/area-basic/julia/makie/plot-dark.png",
  "quality_score": 91.0,
  "license": "MIT",
  "guide": "https://anyplot.ai/llms.txt"
}
Part of Basic Area Chart on anyplot.ai.