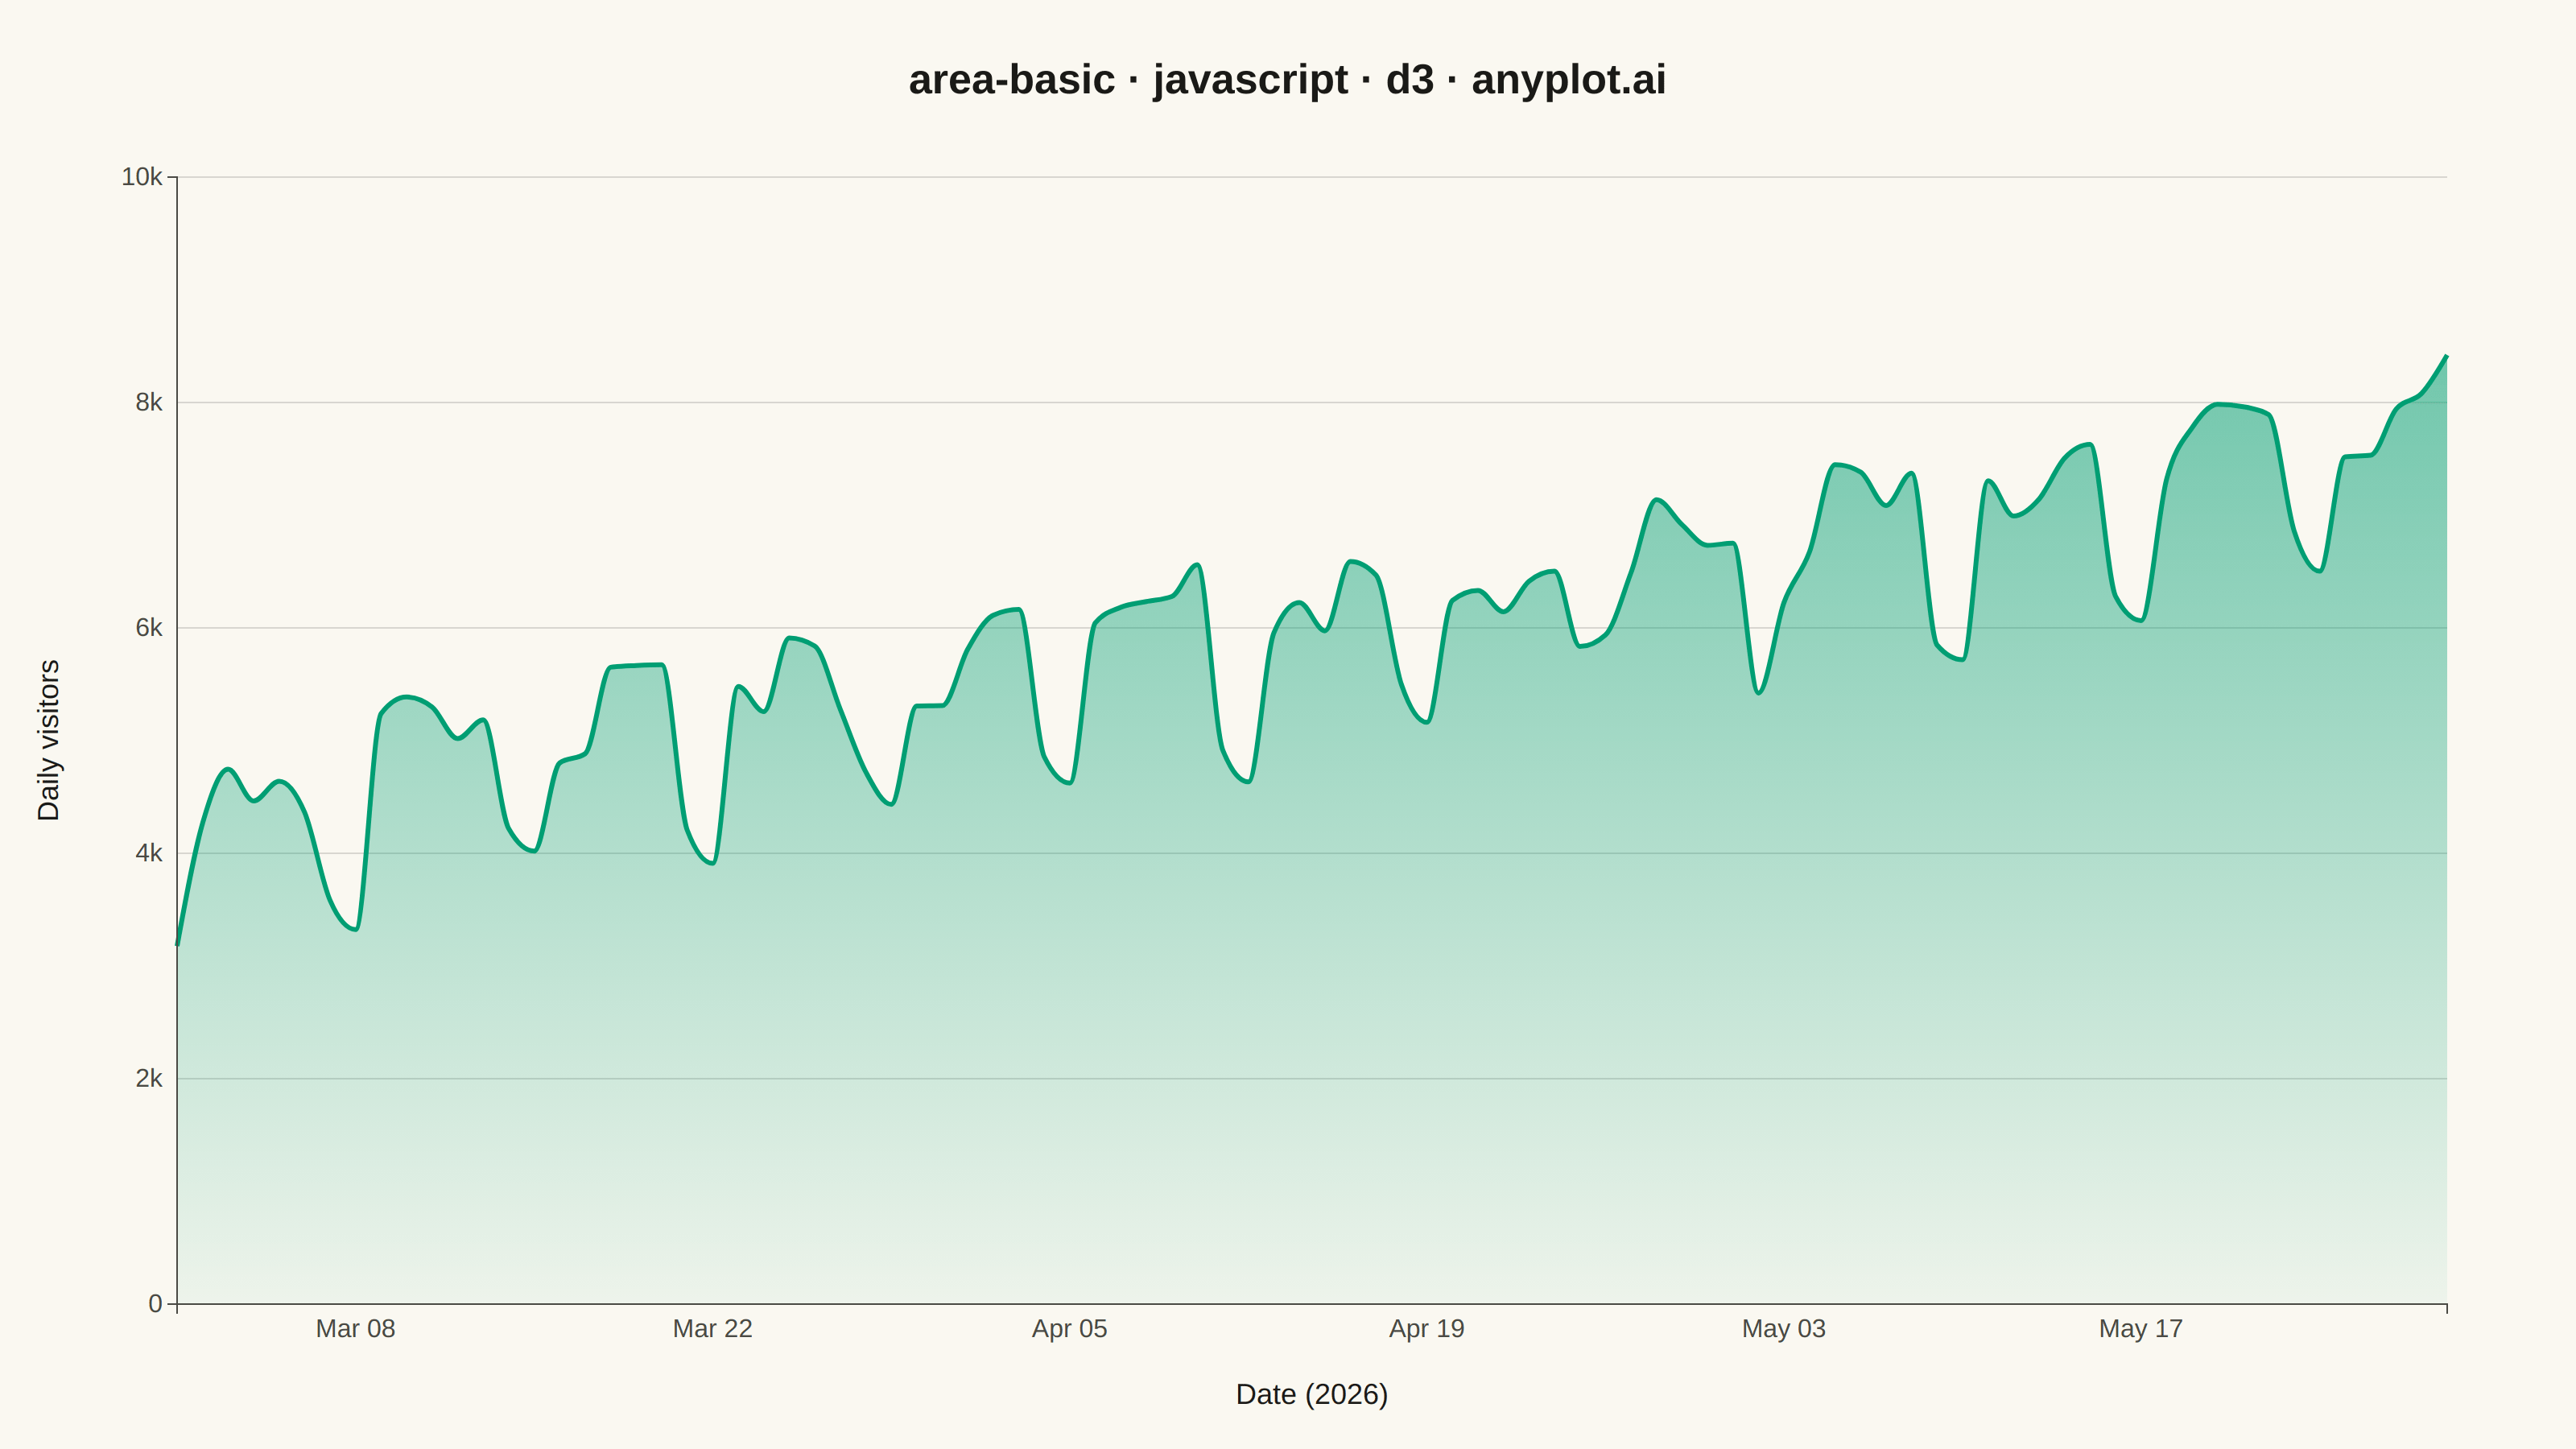
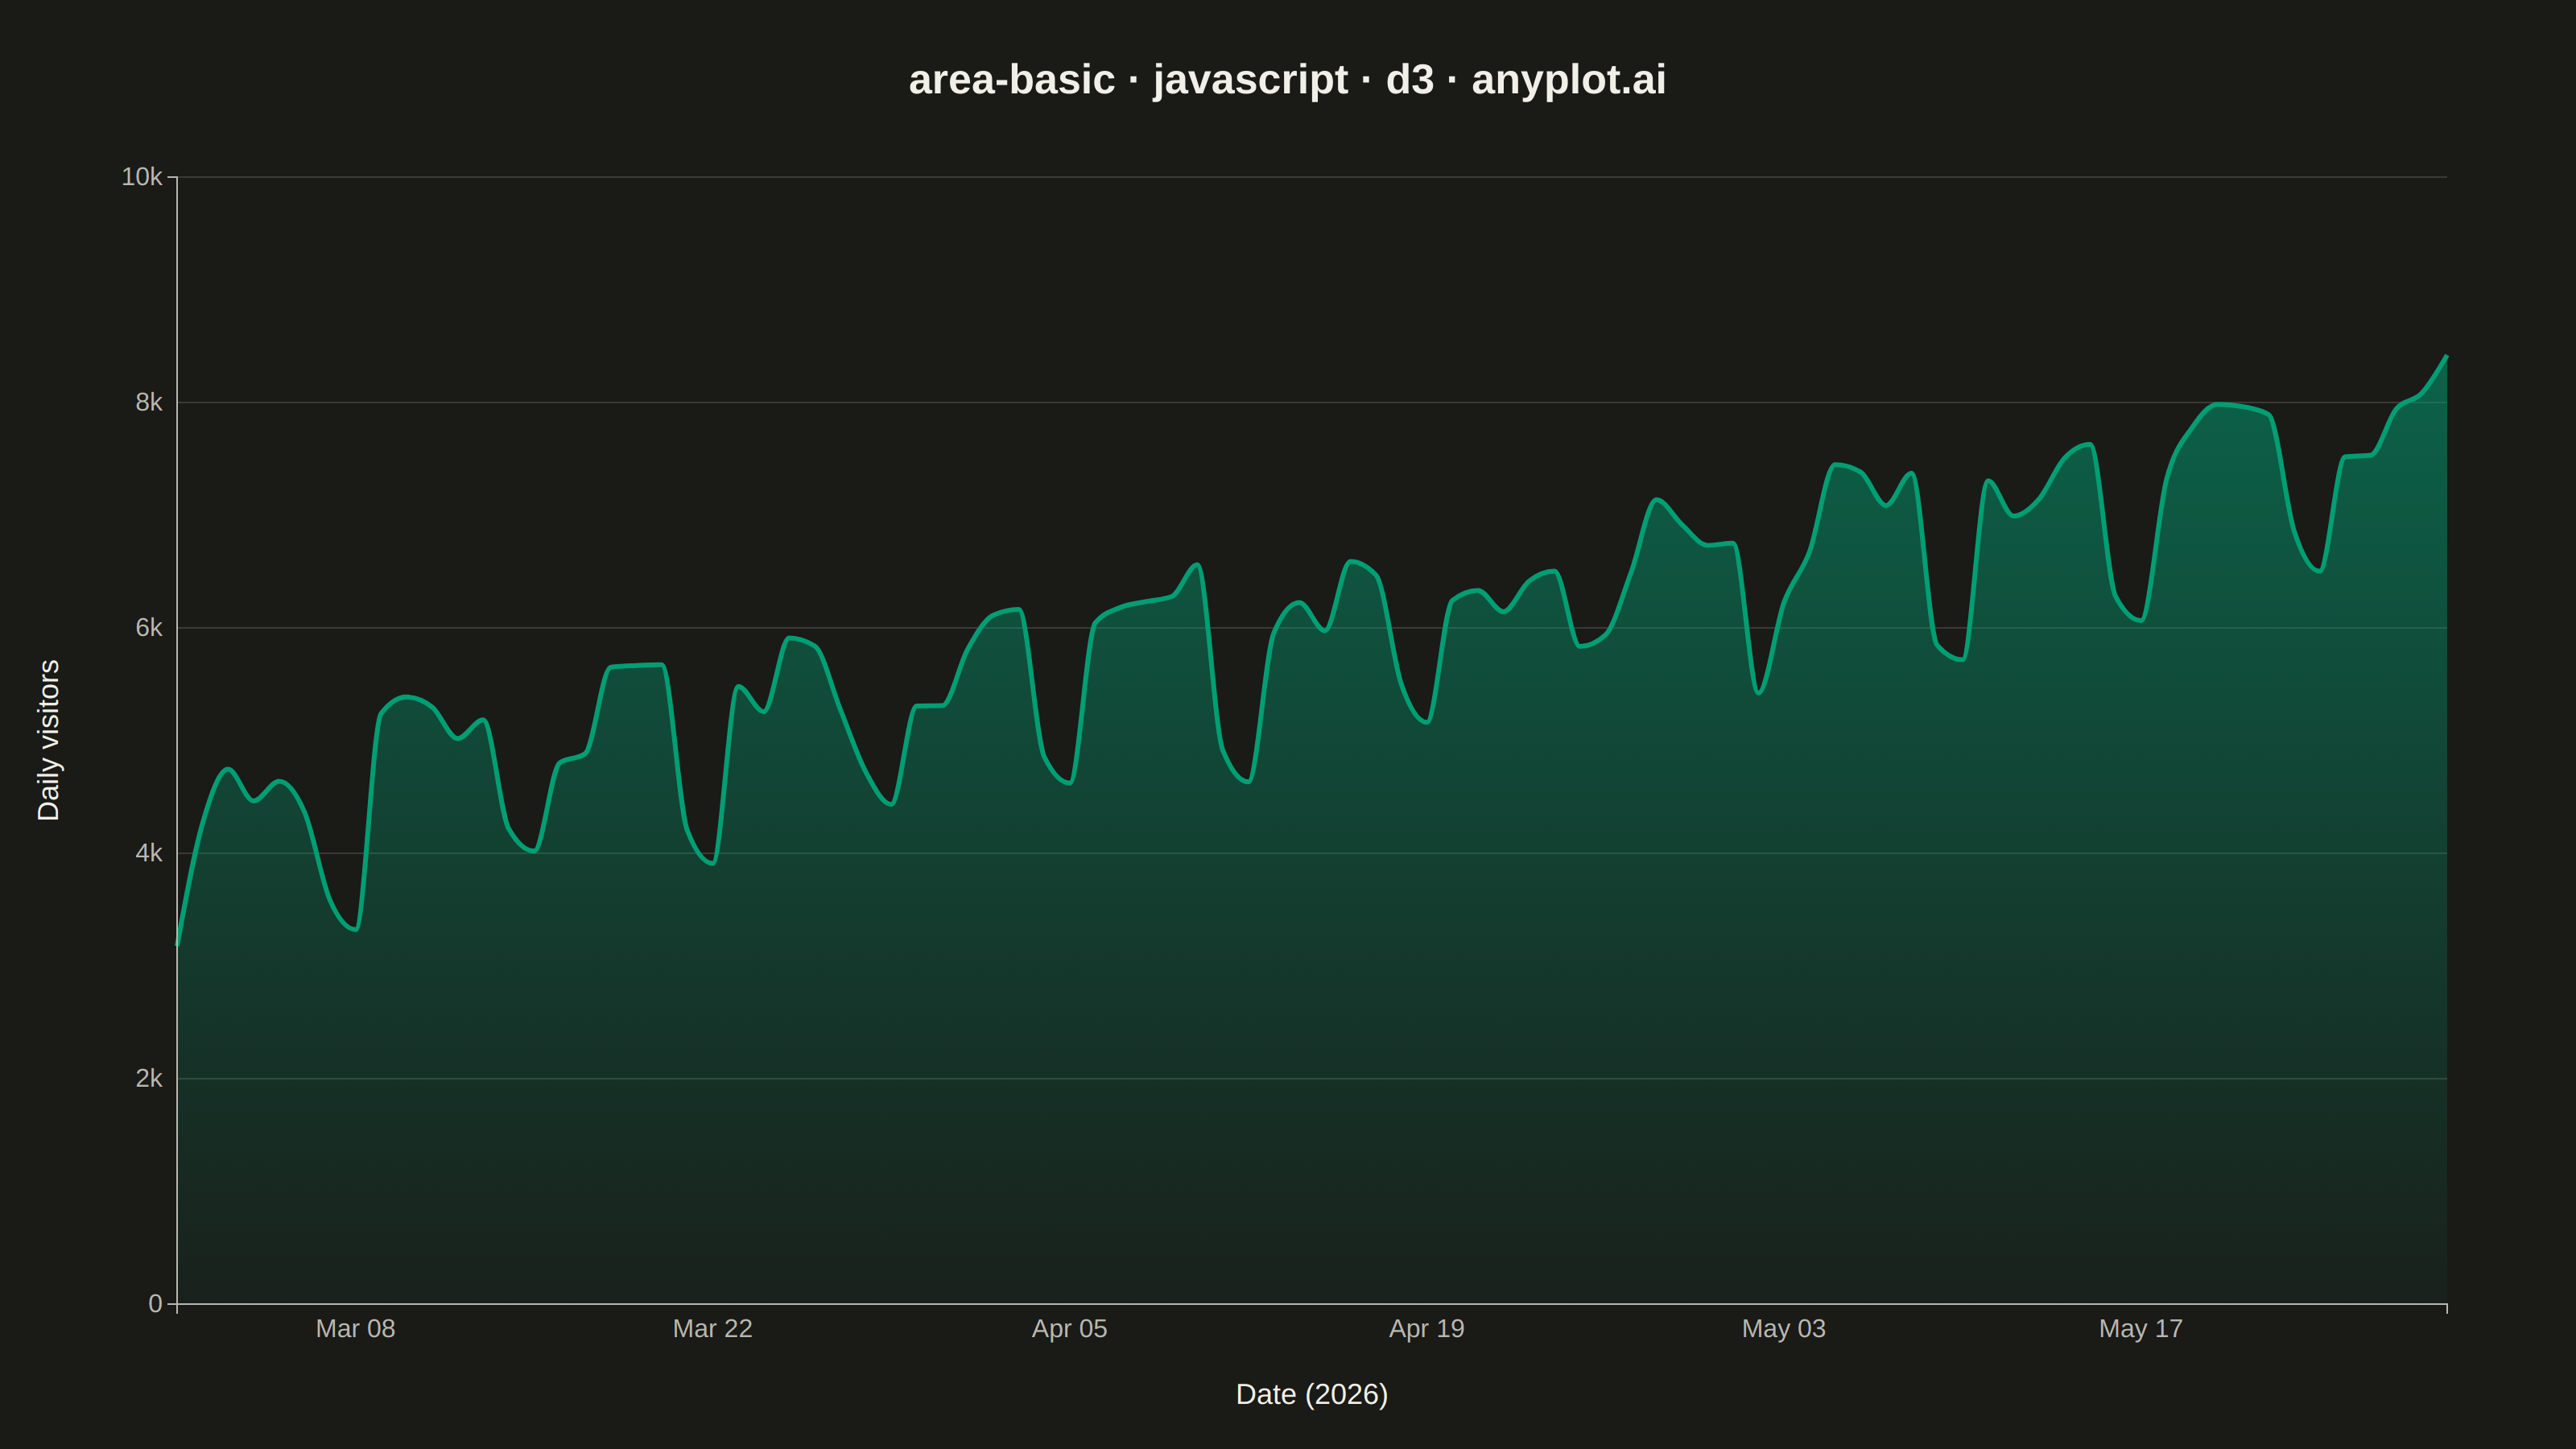
The same plot in 14 other libraries — JavaScript: Chart.js, Apache ECharts, Highcharts, MUI X Charts; Python: Altair, Bokeh, lets-plot, Matplotlib, Plotly, plotnine, Pygal, Seaborn; R: ggplot2; Julia: Makie.jl. Compare all 15 side by side: Basic Area Chart in Python, R, Julia and JavaScript.
An area chart showing quantitative data over a continuous axis with the area below the line filled. It emphasizes the magnitude of values over time by filling the space between the line and axis, creating visual weight that helps readers understand volume and trends. Particularly effective for showing cumulative totals, resource consumption, or any data where the "amount" is as important as the trend.
// anyplot.ai
// area-basic: Basic Area Chart
// Library: d3 7.9.0 | JavaScript 22.22.3
// Quality: 93/100 | Created: 2026-06-02
//# anyplot-orientation: landscape

const t = window.ANYPLOT_TOKENS;
const { width, height } = window.ANYPLOT_SIZE;
const margin = { top: 110, right: 80, bottom: 90, left: 110 };
const iw = width - margin.left - margin.right;
const ih = height - margin.top - margin.bottom;

// Data — daily visitors to a documentation site across a quarter
function lcg(seed) {
  let s = seed >>> 0;
  return () => {
    s = (s * 1664525 + 1013904223) >>> 0;
    return s / 4294967296;
  };
}
const rnd = lcg(42);
const startDate = new Date(2026, 2, 1);
const data = [];
for (let i = 0; i < 90; i++) {
  const date = new Date(startDate.getTime() + i * 86400000);
  const dayOfWeek = date.getDay();
  const weekendDip = dayOfWeek === 0 || dayOfWeek === 6 ? -1200 : 0;
  const trend = i * 38;
  const noise = (rnd() - 0.5) * 900;
  const visitors = Math.max(0, Math.round(4600 + trend + weekendDip + noise));
  data.push({ date, visitors });
}

// SVG mount
const svg = d3
  .select("#container")
  .append("svg")
  .attr("width", width)
  .attr("height", height);
const g = svg
  .append("g")
  .attr("transform", `translate(${margin.left},${margin.top})`);

// Scales
const x = d3
  .scaleTime()
  .domain(d3.extent(data, (d) => d.date))
  .range([0, iw]);
const y = d3
  .scaleLinear()
  .domain([0, d3.max(data, (d) => d.visitors) * 1.08])
  .nice()
  .range([ih, 0]);

// Gridlines — y-axis only
g.append("g")
  .attr("class", "grid")
  .call(d3.axisLeft(y).tickSize(-iw).tickFormat("").ticks(6))
  .call((axis) => {
    axis.select(".domain").remove();
    axis.selectAll("line").attr("stroke", t.grid).attr("stroke-width", 1);
  });

// Gradient — brand green fading toward the page background
const defs = svg.append("defs");
const gradient = defs
  .append("linearGradient")
  .attr("id", "area-fill")
  .attr("x1", 0)
  .attr("y1", 0)
  .attr("x2", 0)
  .attr("y2", 1);
gradient
  .append("stop")
  .attr("offset", "0%")
  .attr("stop-color", t.palette[0])
  .attr("stop-opacity", 0.55);
gradient
  .append("stop")
  .attr("offset", "100%")
  .attr("stop-color", t.palette[0])
  .attr("stop-opacity", 0.05);

// Area
const area = d3
  .area()
  .x((d) => x(d.date))
  .y0(ih)
  .y1((d) => y(d.visitors))
  .curve(d3.curveMonotoneX);

g.append("path").datum(data).attr("fill", "url(#area-fill)").attr("d", area);

// Line on top of area for definition
const line = d3
  .line()
  .x((d) => x(d.date))
  .y((d) => y(d.visitors))
  .curve(d3.curveMonotoneX);

g.append("path")
  .datum(data)
  .attr("fill", "none")
  .attr("stroke", t.palette[0])
  .attr("stroke-width", 3)
  .attr("d", line);

// Axes
const xAxis = g
  .append("g")
  .attr("transform", `translate(0,${ih})`)
  .call(
    d3
      .axisBottom(x)
      .ticks(d3.timeWeek.every(2))
      .tickFormat(d3.timeFormat("%b %d")),
  );

const yAxis = g
  .append("g")
  .call(d3.axisLeft(y).ticks(6).tickFormat(d3.format("~s")));

for (const ax of [xAxis, yAxis]) {
  ax.selectAll("text").attr("fill", t.inkSoft).style("font-size", "16px");
  ax.select(".domain").attr("stroke", t.inkSoft).attr("stroke-width", 1);
  ax.selectAll(".tick line").remove();
}

// Axis labels
svg
  .append("text")
  .attr("x", margin.left + iw / 2)
  .attr("y", height - 28)
  .attr("text-anchor", "middle")
  .attr("fill", t.ink)
  .style("font-size", "18px")
  .text("Date (2026)");

svg
  .append("text")
  .attr("transform", `translate(36, ${margin.top + ih / 2}) rotate(-90)`)
  .attr("text-anchor", "middle")
  .attr("fill", t.ink)
  .style("font-size", "18px")
  .text("Daily visitors");

// Title
svg
  .append("text")
  .attr("x", width / 2)
  .attr("y", 58)
  .attr("text-anchor", "middle")
  .attr("fill", t.ink)
  .style("font-size", "26px")
  .style("font-weight", "600")
  .text("area-basic · javascript · d3 · anyplot.ai");
Runnable source as JSON, for any HTTP client: https://api.anyplot.ai/specs/area-basic/d3/code. Any spec id and library id listed in llms-full.txt fit the same URL shape; every URL below is complete and callable.
{
  "spec_id": "area-basic",
  "language": "javascript",
  "library": "d3",
  "page": "https://anyplot.ai/area-basic/javascript/d3",
  "hub": "https://anyplot.ai/area-basic",
  "code_json": "https://api.anyplot.ai/specs/area-basic/d3/code",
  "spec_json": "https://api.anyplot.ai/specs/area-basic",
  "render_light_png": "https://storage.googleapis.com/anyplot-images/plots/area-basic/javascript/d3/plot-light.png",
  "render_dark_png": "https://storage.googleapis.com/anyplot-images/plots/area-basic/javascript/d3/plot-dark.png",
  "interactive_light_html": "https://storage.googleapis.com/anyplot-images/plots/area-basic/javascript/d3/plot-light.html",
  "interactive_dark_html": "https://storage.googleapis.com/anyplot-images/plots/area-basic/javascript/d3/plot-dark.html",
  "quality_score": 93.0,
  "license": "MIT",
  "guide": "https://anyplot.ai/llms.txt"
}
Part of Basic Area Chart on anyplot.ai.