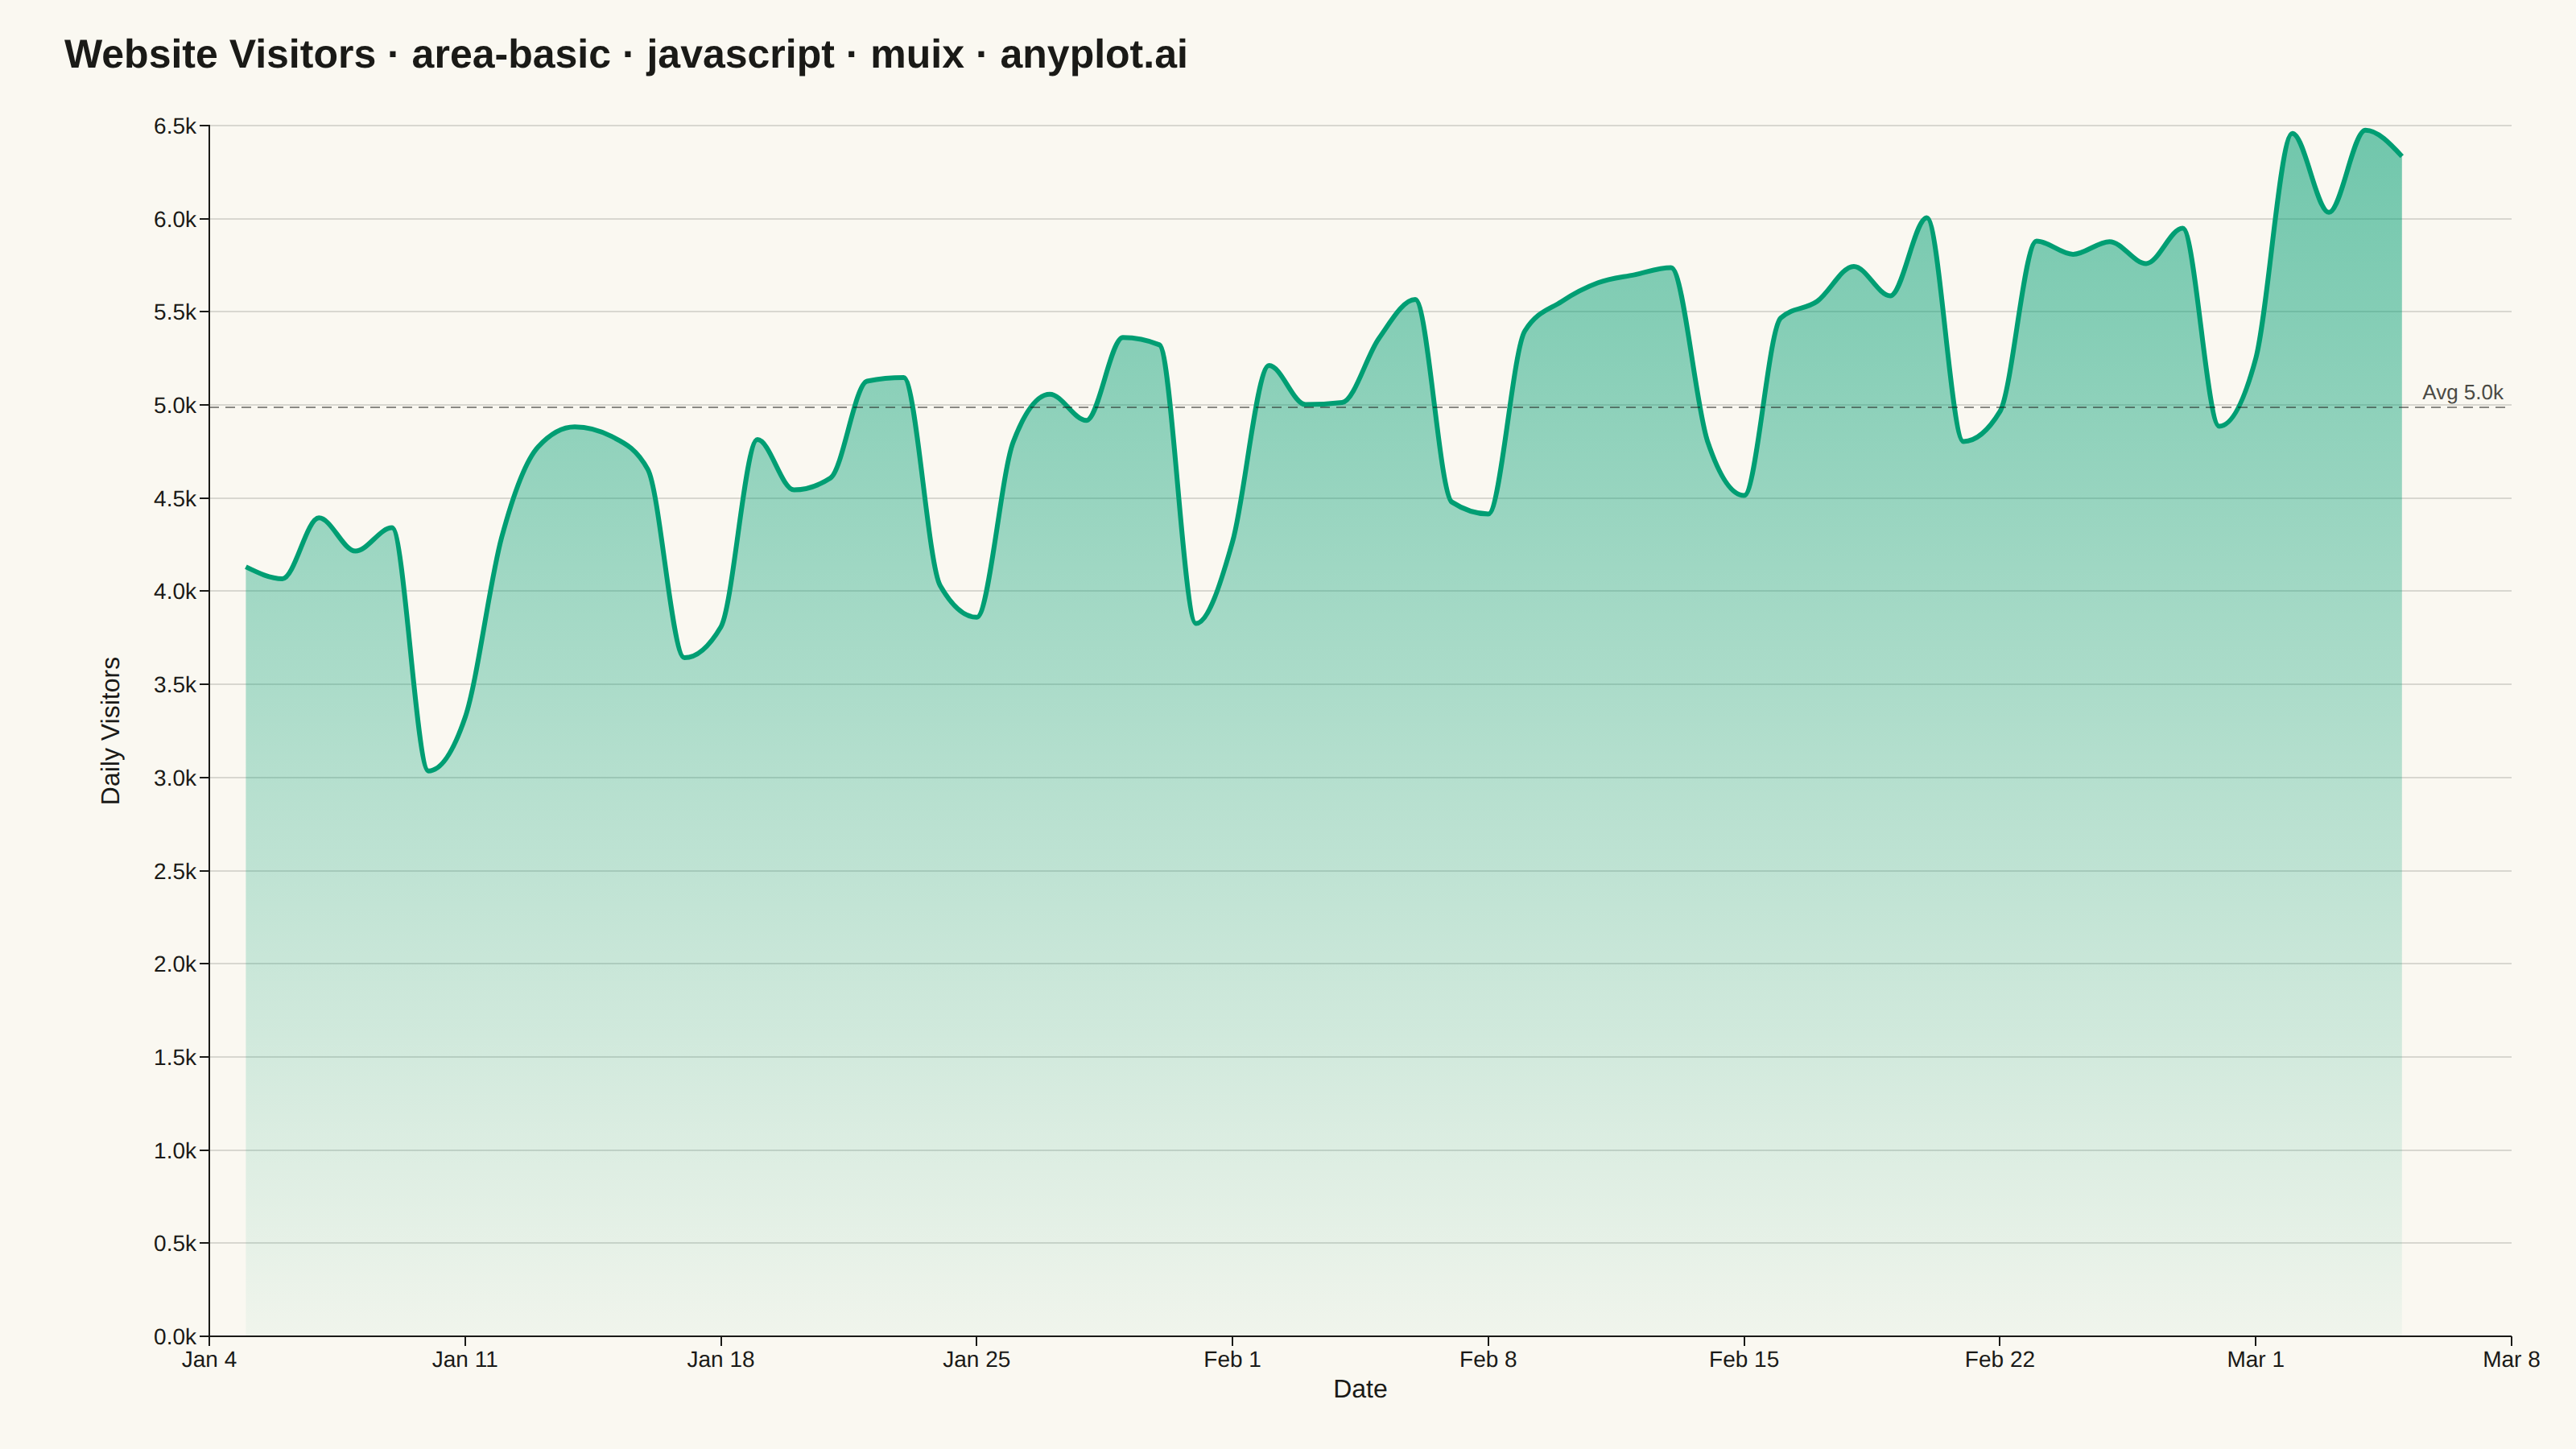
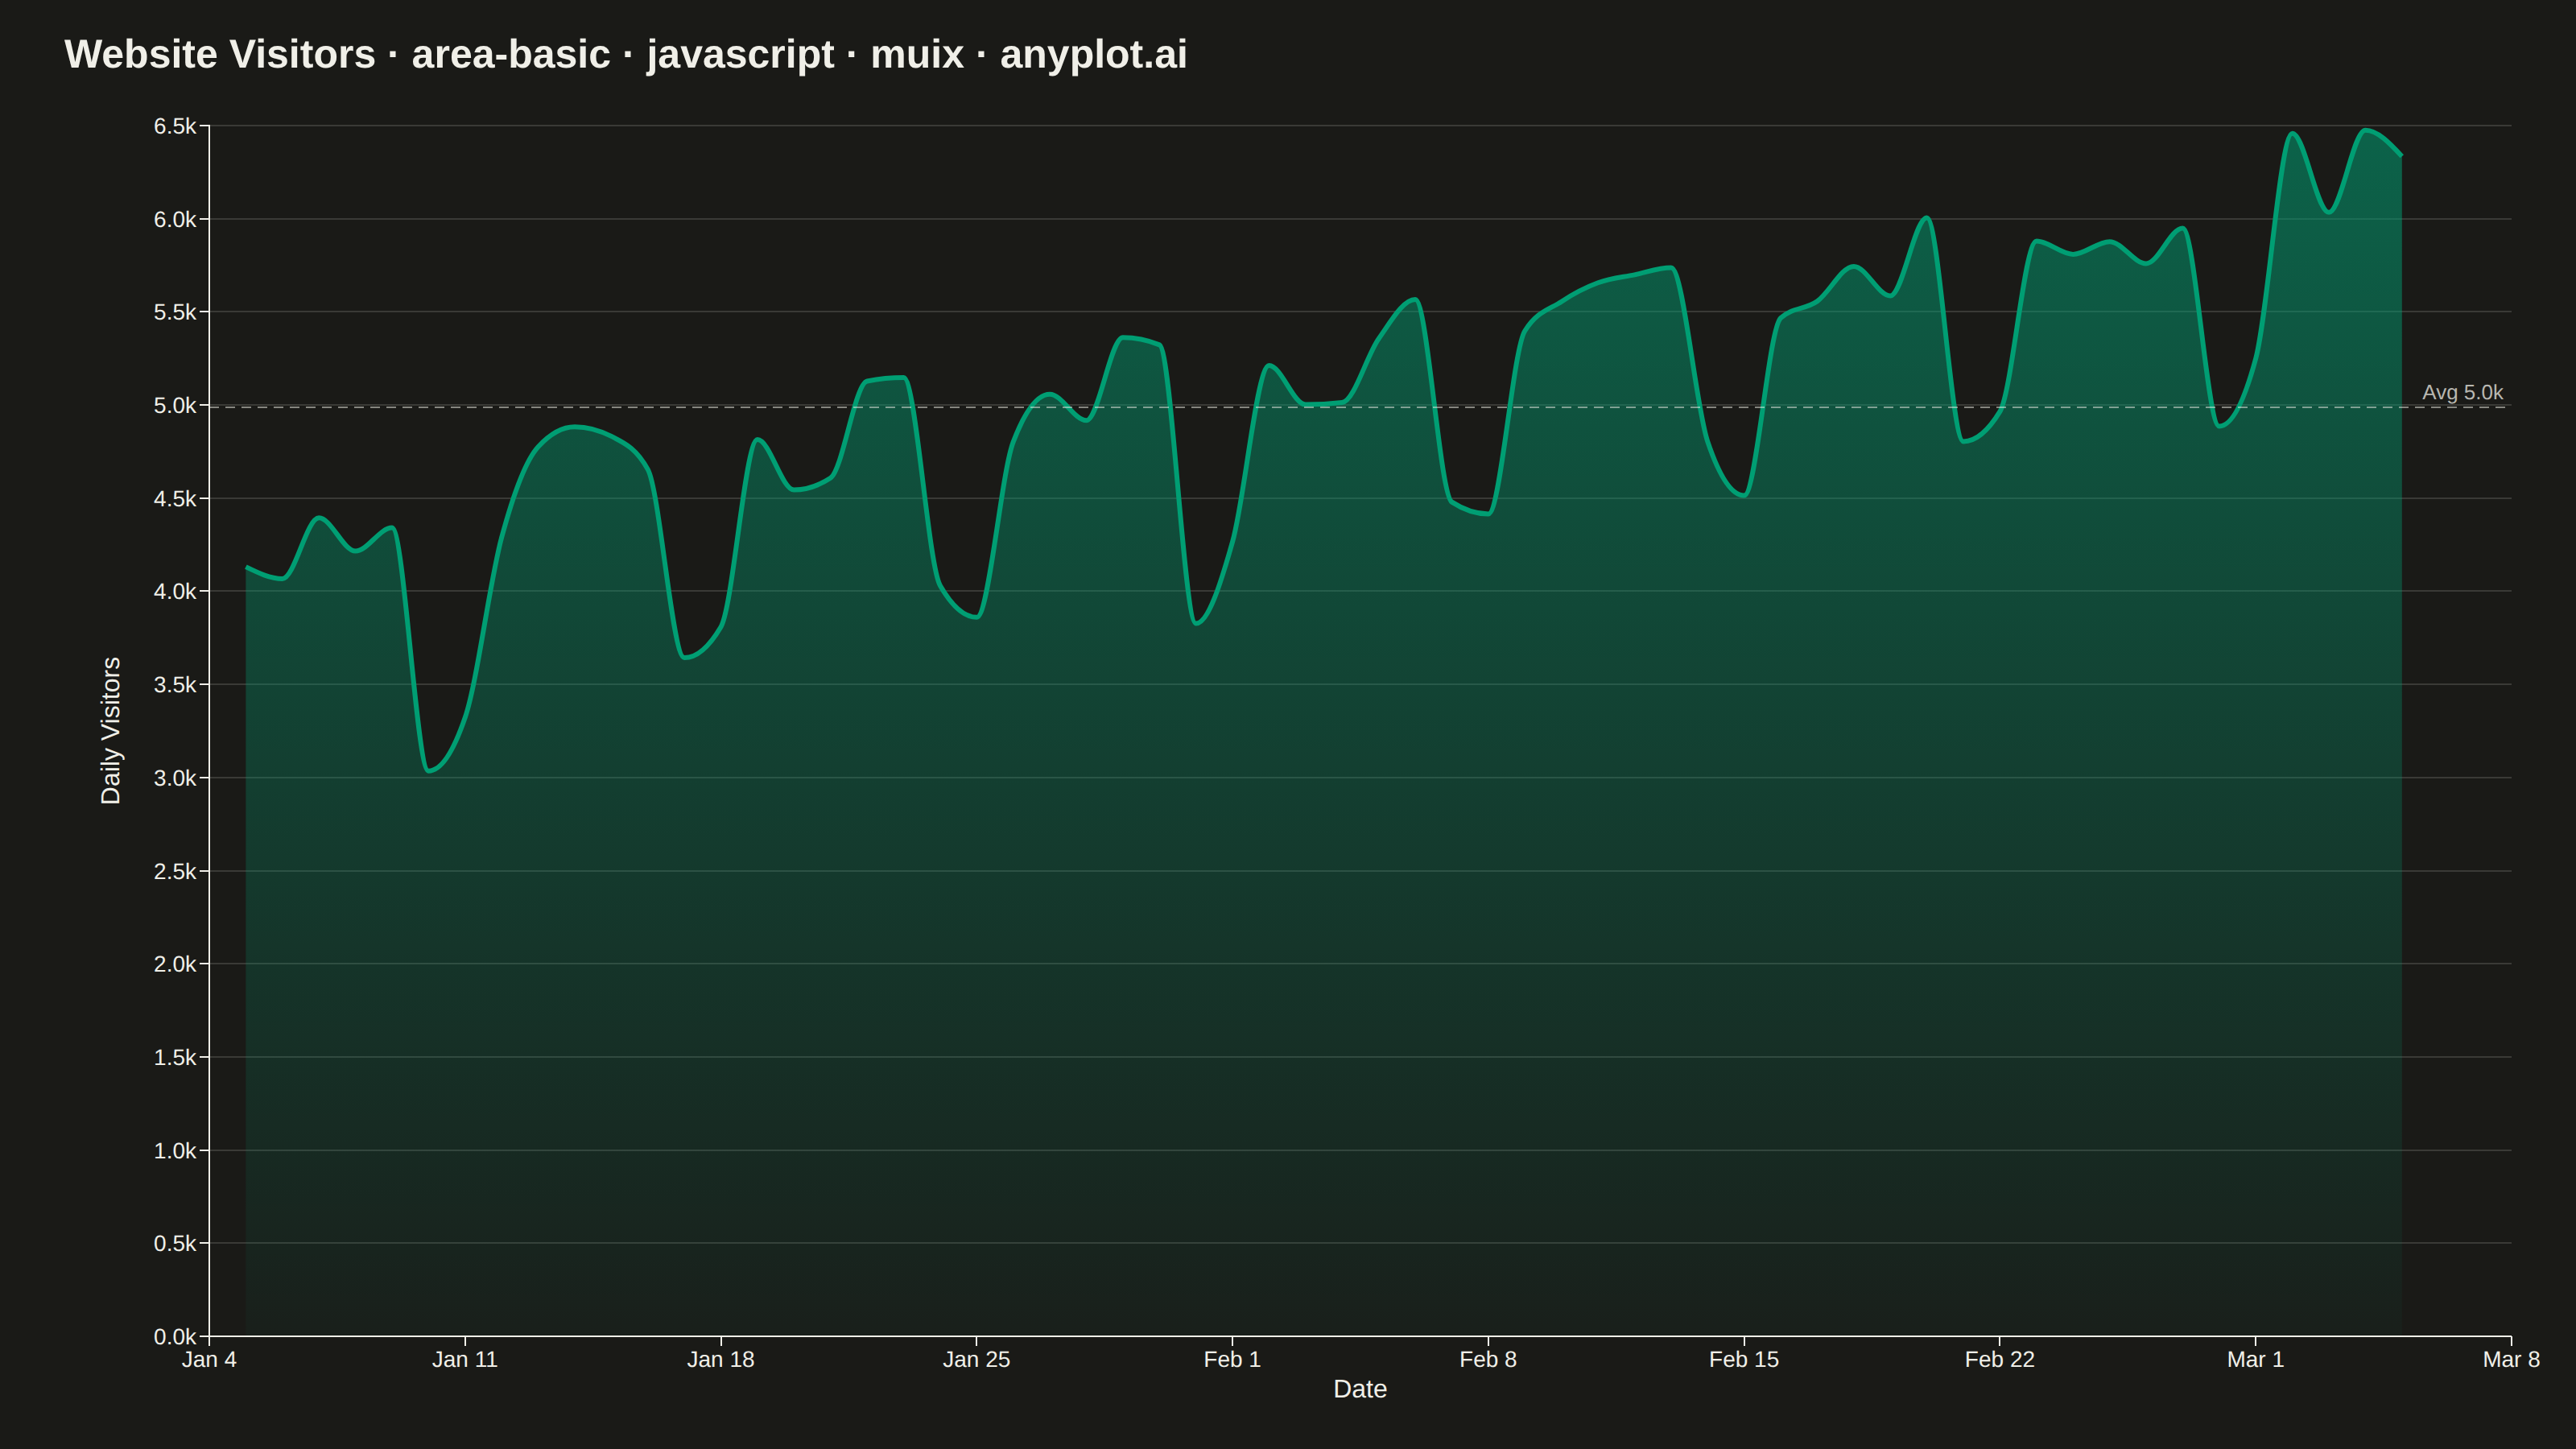
The same plot in 14 other libraries — JavaScript: Chart.js, D3.js, Apache ECharts, Highcharts; Python: Altair, Bokeh, lets-plot, Matplotlib, Plotly, plotnine, Pygal, Seaborn; R: ggplot2; Julia: Makie.jl. Compare all 15 side by side: Basic Area Chart in Python, R, Julia and JavaScript.
An area chart showing quantitative data over a continuous axis with the area below the line filled. It emphasizes the magnitude of values over time by filling the space between the line and axis, creating visual weight that helps readers understand volume and trends. Particularly effective for showing cumulative totals, resource consumption, or any data where the "amount" is as important as the trend.
// anyplot.ai
// area-basic: Basic Area Chart
// Library: muix 7.29.1 | JavaScript 22.23.2
// Quality: 83/100 | Created: 2026-08-20
import { LineChart } from "@mui/x-charts/LineChart";
import { ChartsReferenceLine } from "@mui/x-charts/ChartsReferenceLine";
import Box from "@mui/material/Box";
import Typography from "@mui/material/Typography";

const t = window.ANYPLOT_TOKENS;

// --- Data (in-memory, deterministic) ----------------------------------------

// Tiny fixed-seed LCG — the browser has no seeded RNG
function lcg(seed: number) {
  let s = seed >>> 0;
  return () => {
    s = (Math.imul(1664525, s) + 1013904223) >>> 0;
    return s / 4294967295;
  };
}
const rand = lcg(42);

// Daily website visitors over two months, with weekday/weekend seasonality
// and a gradual growth trend.
const DAY_COUNT = 60;
const startDate = new Date(2026, 0, 5);
const dates = Array.from({ length: DAY_COUNT }, (_, i) => {
  const d = new Date(startDate);
  d.setDate(d.getDate() + i);
  return d;
});
const visitors = dates.map((d, i) => {
  const trend = 4100 + i * 34;
  const isWeekend = d.getDay() === 0 || d.getDay() === 6;
  const seasonality = isWeekend ? -950 : 180;
  const noise = (rand() - 0.5) * 600;
  return Math.max(0, Math.round(trend + seasonality + noise));
});
const avgVisitors = visitors.reduce((a, b) => a + b, 0) / visitors.length;

const TITLE = "Website Visitors · area-basic · javascript · muix · anyplot.ai";
const TITLE_H = 58;
const AREA_GRADIENT_ID = "areaBasicFillGradient";

// --- Chart (default-exported component — the harness mounts it) ------------

export default function Chart() {
  const { width, height } = window.ANYPLOT_SIZE;

  return (
    <Box
      sx={{
        width,
        height,
        bgcolor: t.pageBg,
        display: "flex",
        flexDirection: "column",
      }}
    >
      <Box
        sx={{
          height: TITLE_H,
          display: "flex",
          alignItems: "center",
          px: "40px",
          pt: "10px",
        }}
      >
        <Typography
          sx={{
            color: t.ink,
            fontSize: "25px",
            fontWeight: 600,
            lineHeight: 1,
          }}
        >
          {TITLE}
        </Typography>
      </Box>

      <LineChart
        width={width}
        height={height - TITLE_H}
        skipAnimation
        grid={{ horizontal: true }}
        xAxis={[
          {
            data: dates,
            scaleType: "time",
            valueFormatter: (v: Date) =>
              v.toLocaleDateString("en-US", { month: "short", day: "numeric" }),
            tickNumber: 8,
            label: "Date",
            tickLabelStyle: { fontSize: 14 },
            labelStyle: { fontSize: 16 },
          },
        ]}
        yAxis={[
          {
            min: 0,
            label: "Daily Visitors",
            valueFormatter: (v: number) => `${(v / 1000).toFixed(1)}k`,
            // tickFontSize drives the auto-computed label offset (see MUI X
            // ChartsYAxis: labelRefPoint.x = -(tickFontSize + tickSize + 10));
            // set it wide enough to clear the "6.5k"-style tick text, while
            // tickLabelStyle.fontSize keeps the rendered tick size correct.
            tickFontSize: 40,
            tickLabelStyle: { fontSize: 14 },
            labelStyle: { fontSize: 16 },
          },
        ]}
        series={[
          {
            id: "visitors",
            data: visitors,
            label: "Visitors",
            color: t.palette[0],
            area: true,
            showMark: false,
            curve: "monotoneX",
            baseline: 0,
          },
        ]}
        margin={{ top: 20, bottom: 70, left: 130, right: 40 }}
        sx={{
          "& .MuiAreaElement-root": { fill: `url(#${AREA_GRADIENT_ID})` },
          "& .MuiLineElement-root": { strokeWidth: 3 },
          "& .MuiChartsGrid-line": { stroke: t.grid, strokeWidth: 1 },
        }}
        slotProps={{ legend: { hidden: true } }}
      >
        {/* Fade the fill from the line down to the baseline — the spec's
            suggested "gradient fill for visual appeal", not a decorative one:
            it keeps visual weight on the trend line and lightens near zero. */}
        <defs>
          <linearGradient id={AREA_GRADIENT_ID} x1="0" y1="0" x2="0" y2="1">
            <stop offset="0%" stopColor={t.palette[0]} stopOpacity={0.55} />
            <stop offset="100%" stopColor={t.palette[0]} stopOpacity={0.04} />
          </linearGradient>
        </defs>
        <ChartsReferenceLine
          y={avgVisitors}
          label={`Avg ${(avgVisitors / 1000).toFixed(1)}k`}
          labelAlign="end"
          lineStyle={{ stroke: t.ink, strokeDasharray: "6 4", strokeOpacity: 0.5 }}
          labelStyle={{ fill: t.inkSoft, fontSize: 13 }}
        />
      </LineChart>
    </Box>
  );
}
Runnable source as JSON, for any HTTP client: https://api.anyplot.ai/specs/area-basic/muix/code. Any spec id and library id listed in llms-full.txt fit the same URL shape; every URL below is complete and callable.
{
  "spec_id": "area-basic",
  "language": "javascript",
  "library": "muix",
  "page": "https://anyplot.ai/area-basic/javascript/muix",
  "hub": "https://anyplot.ai/area-basic",
  "code_json": "https://api.anyplot.ai/specs/area-basic/muix/code",
  "spec_json": "https://api.anyplot.ai/specs/area-basic",
  "render_light_png": "https://storage.googleapis.com/anyplot-images/plots/area-basic/javascript/muix/plot-light.png",
  "render_dark_png": "https://storage.googleapis.com/anyplot-images/plots/area-basic/javascript/muix/plot-dark.png",
  "interactive_light_html": "https://storage.googleapis.com/anyplot-images/plots/area-basic/javascript/muix/plot-light.html",
  "interactive_dark_html": "https://storage.googleapis.com/anyplot-images/plots/area-basic/javascript/muix/plot-dark.html",
  "quality_score": 83.0,
  "license": "MIT",
  "guide": "https://anyplot.ai/llms.txt"
}
Part of Basic Area Chart on anyplot.ai.