The same plot in 14 other libraries — JavaScript: D3.js, Apache ECharts, Highcharts, MUI X Charts; Python: Altair, Bokeh, lets-plot, Matplotlib, Plotly, plotnine, Pygal, Seaborn; R: ggplot2; Julia: Makie.jl. Compare all 15 side by side: Terrain Elevation Profile Along Transect in Python, R, Julia and JavaScript.
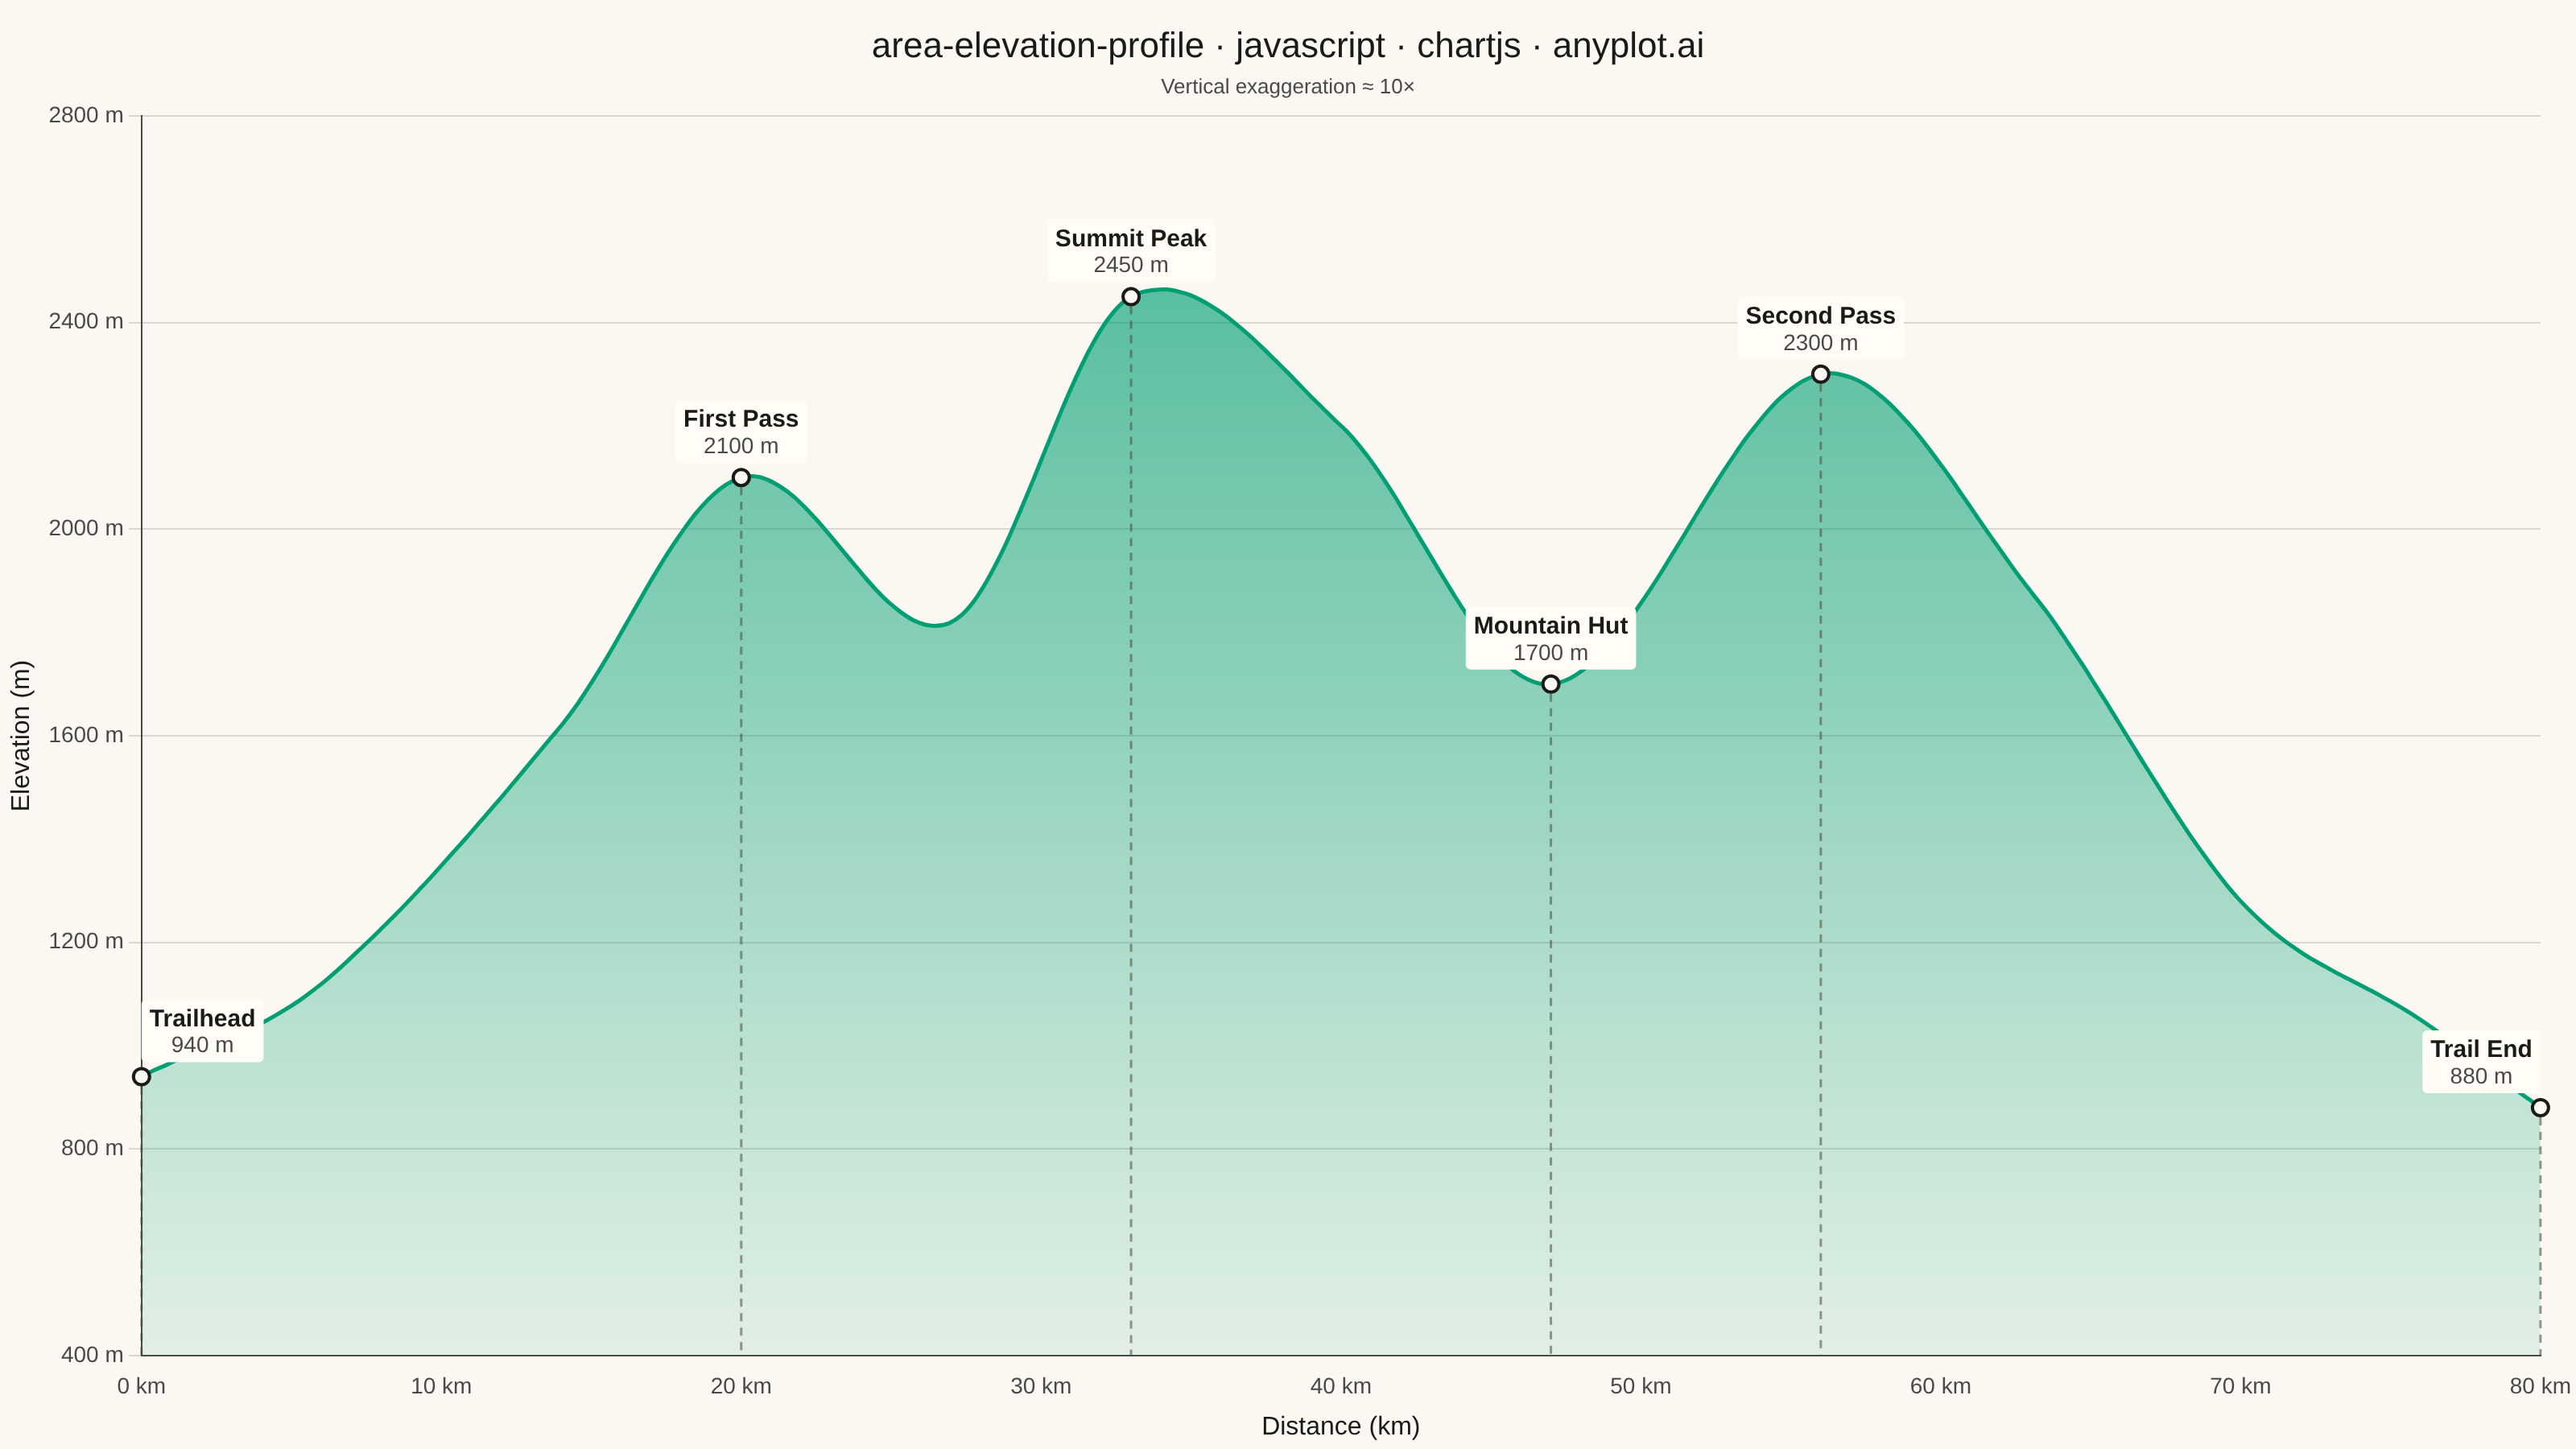
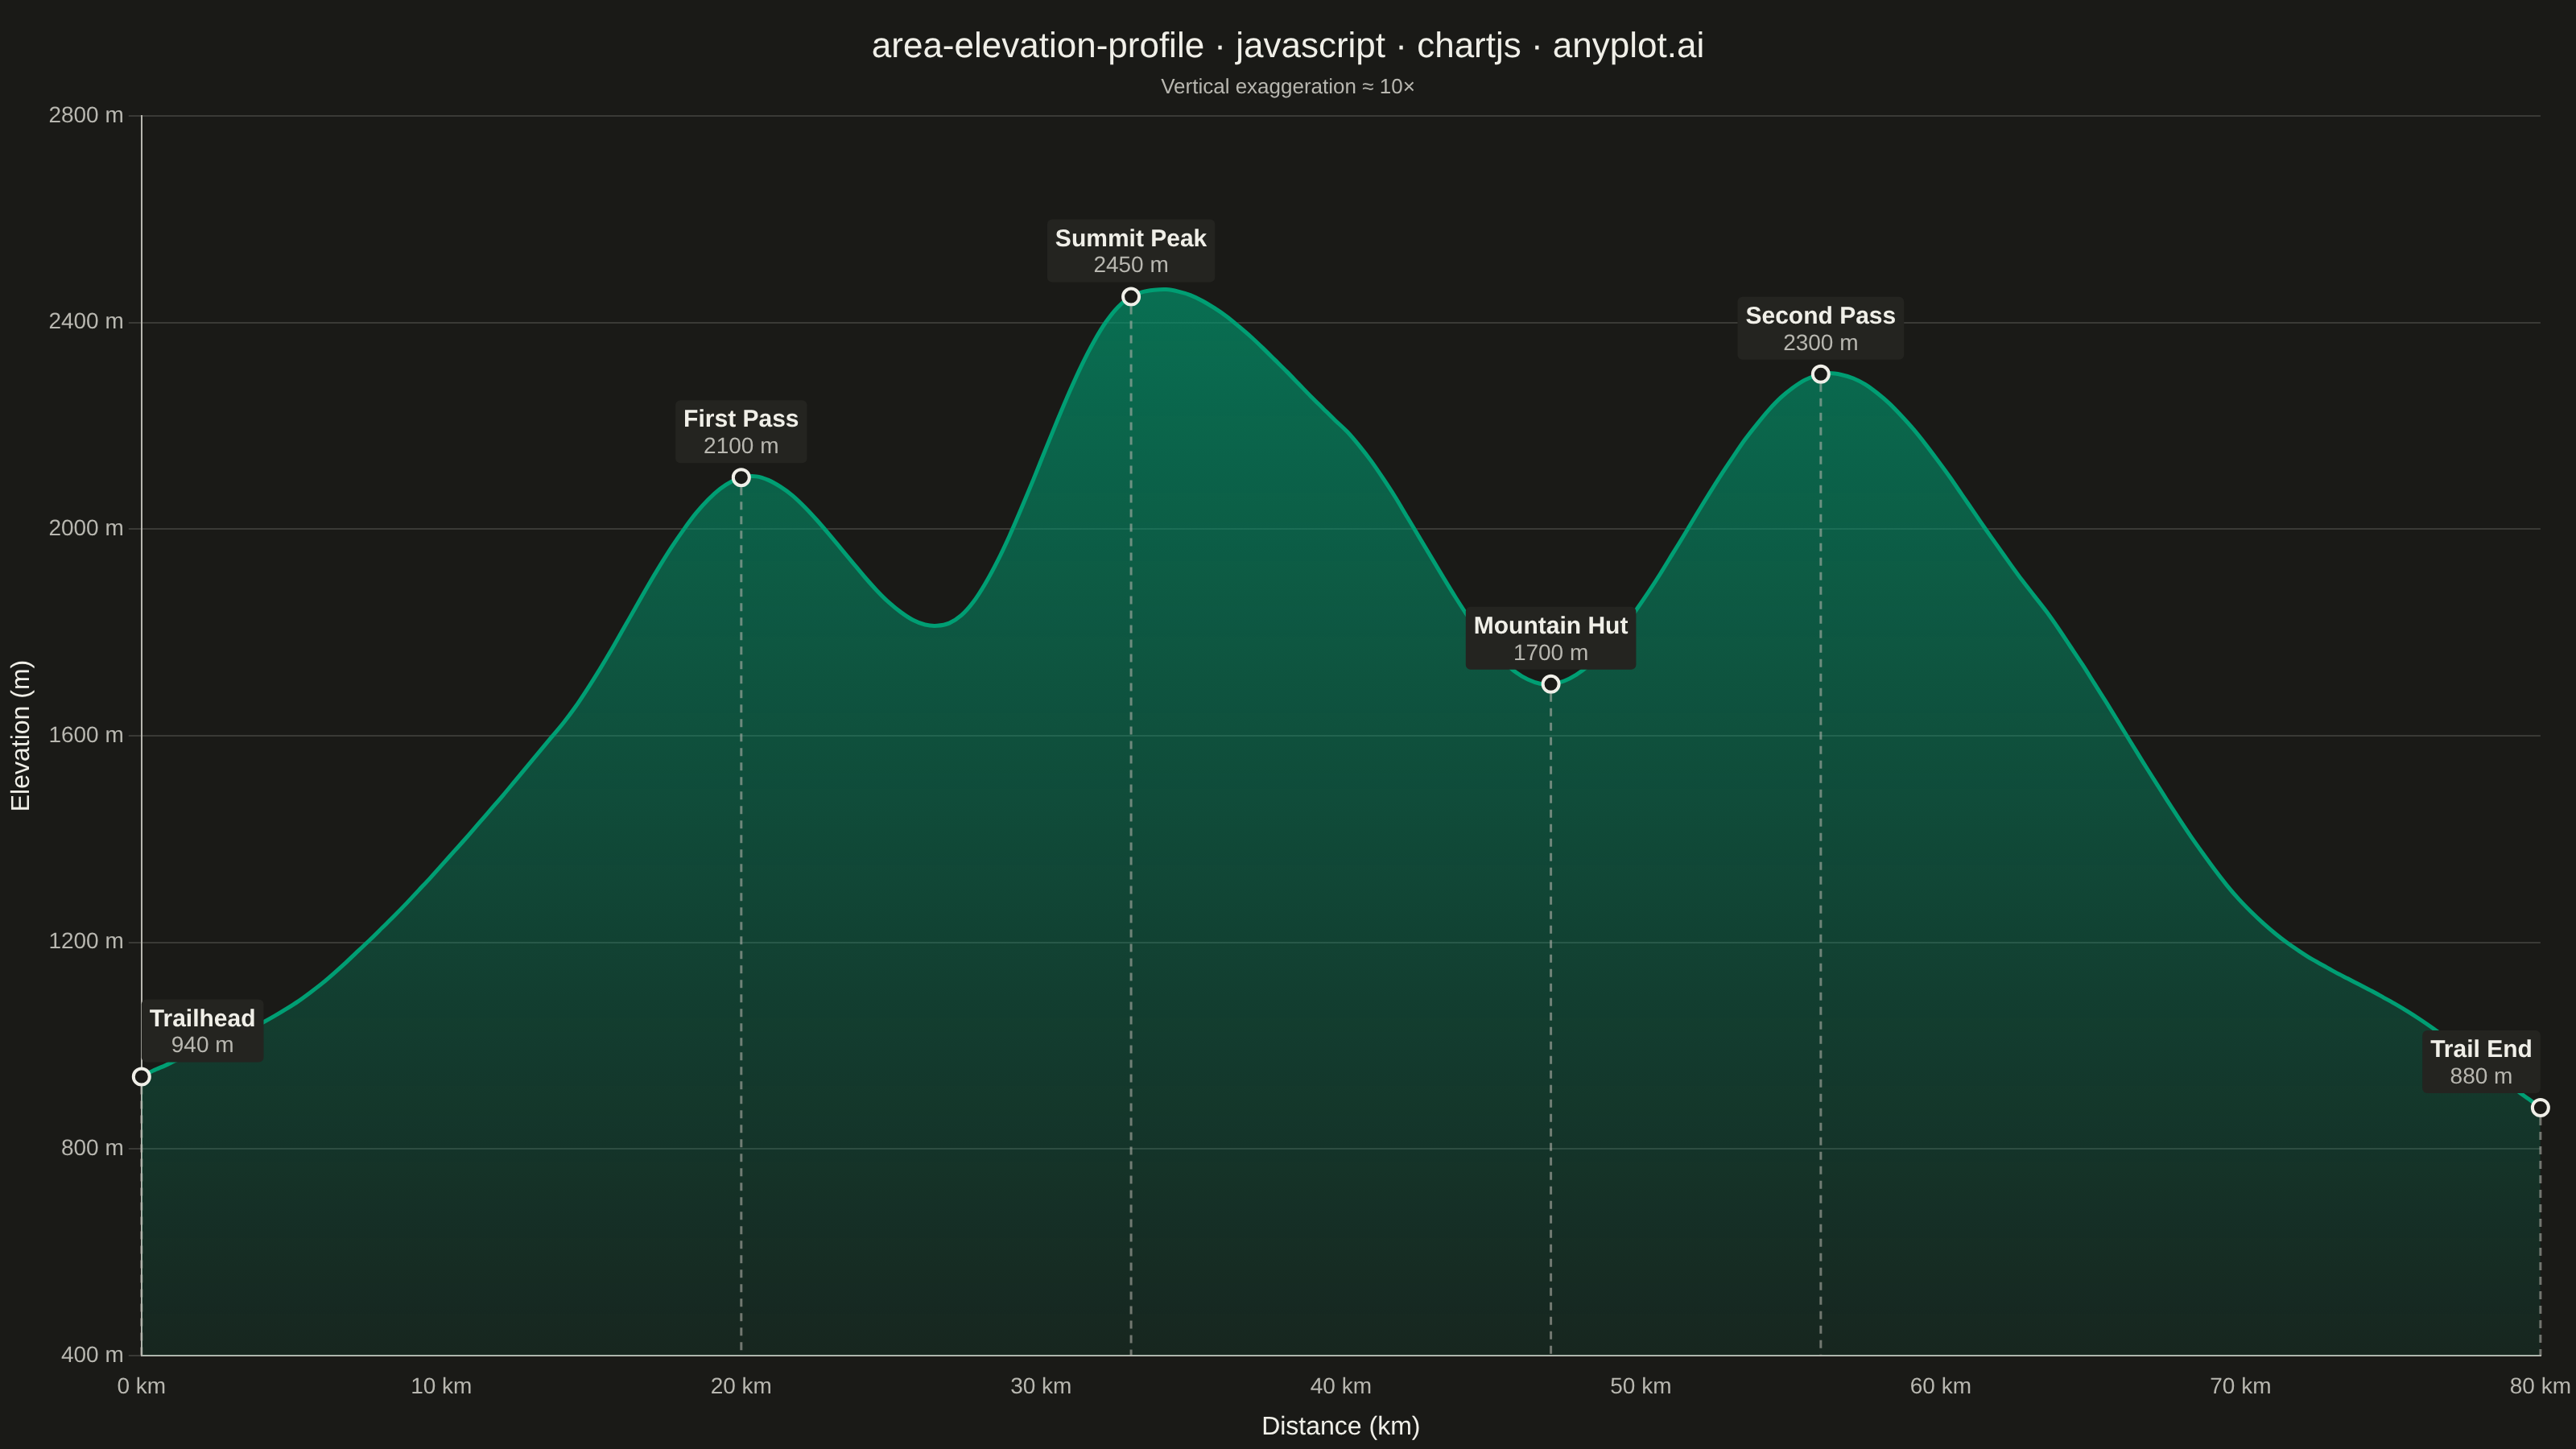
A cross-sectional line plot showing ground elevation along a path or transect line, with the area below the profile filled to create a terrain silhouette. Distance along the transect is plotted on the x-axis and elevation on the y-axis. This visualization is widely used in hiking and cycling route planning, civil engineering corridor design, and geomorphology to convey terrain shape and difficulty at a glance.
// anyplot.ai
// area-elevation-profile: Terrain Elevation Profile Along Transect
// Library: chartjs 4.4.7 | JavaScript 22.22.3
// Quality: 90/100 | Created: 2026-06-10

//# anyplot-orientation: landscape
const t = window.ANYPLOT_TOKENS;

// Alpine trail — control points (distance km, elevation m)
const ctrlPoints = [
  { d: 0,  e: 940  },
  { d: 6,  e: 1120 },
  { d: 14, e: 1620 },
  { d: 20, e: 2100 },
  { d: 27, e: 1820 },
  { d: 33, e: 2450 },
  { d: 40, e: 2200 },
  { d: 47, e: 1700 },
  { d: 56, e: 2300 },
  { d: 63, e: 1880 },
  { d: 70, e: 1280 },
  { d: 76, e: 1050 },
  { d: 80, e: 880  },
];

// Landmarks to annotate (trailhead, passes, summit, hut, end)
const landmarks = [
  { d: 0,  e: 940,  name: "Trailhead",    elev: "940 m"  },
  { d: 20, e: 2100, name: "First Pass",   elev: "2100 m" },
  { d: 33, e: 2450, name: "Summit Peak",  elev: "2450 m" },
  { d: 47, e: 1700, name: "Mountain Hut", elev: "1700 m" },
  { d: 56, e: 2300, name: "Second Pass",  elev: "2300 m" },
  { d: 80, e: 880,  name: "Trail End",    elev: "880 m"  },
];

// Cubic Hermite spline interpolation for smooth elevation profile
function hermite(x, pts) {
  const n = pts.length;
  if (x <= pts[0].d) return pts[0].e;
  if (x >= pts[n - 1].d) return pts[n - 1].e;
  let i = 1;
  while (i < n - 1 && pts[i].d < x) i++;
  i--;
  const p0 = pts[Math.max(0, i - 1)];
  const p1 = pts[i];
  const p2 = pts[i + 1];
  const p3 = pts[Math.min(n - 1, i + 2)];
  const tl = (x - p1.d) / (p2.d - p1.d);
  const dt = p2.d - p1.d;
  const m1 = (p2.e - p0.e) / (p2.d - p0.d);
  const m2 = (p3.e - p1.e) / (p3.d - p1.d);
  const h00 = 2*tl*tl*tl - 3*tl*tl + 1;
  const h10 = tl*tl*tl - 2*tl*tl + tl;
  const h01 = -2*tl*tl*tl + 3*tl*tl;
  const h11 = tl*tl*tl - tl*tl;
  return h00*p1.e + h10*dt*m1 + h01*p2.e + h11*dt*m2;
}

// Sample 200 points along the trail
const N = 200;
const distances = [];
const elevations = [];
for (let i = 0; i < N; i++) {
  const d = (i / (N - 1)) * 80;
  distances.push(parseFloat(d.toFixed(3)));
  elevations.push(Math.round(hermite(d, ctrlPoints)));
}

// Mount canvas
const canvas = document.createElement("canvas");
document.getElementById("container").appendChild(canvas);

// Custom plugin: draws vertical dashed guide lines + label boxes at each landmark
const landmarkPlugin = {
  id: "landmarks",
  afterDraw(chart) {
    const { ctx: c, chartArea, scales } = chart;
    const xSc = scales.x;
    const ySc = scales.y;
    c.save();

    landmarks.forEach(lm => {
      const xPx = xSc.getPixelForValue(lm.d);
      const yPx = ySc.getPixelForValue(lm.e);
      const lineH = 17;
      const pad = 5;
      const gap = 9;

      // Dashed vertical guide from terrain dot down to x-axis baseline
      c.beginPath();
      c.setLineDash([5, 4]);
      c.strokeStyle = t.inkSoft + "90";
      c.lineWidth = 1.5;
      c.moveTo(xPx, yPx + 6);
      c.lineTo(xPx, chartArea.bottom);
      c.stroke();
      c.setLineDash([]);

      // Hollow dot at terrain elevation
      c.beginPath();
      c.arc(xPx, yPx, 5, 0, 2 * Math.PI);
      c.fillStyle = t.pageBg;
      c.fill();
      c.beginPath();
      c.arc(xPx, yPx, 5, 0, 2 * Math.PI);
      c.strokeStyle = t.ink;
      c.lineWidth = 2;
      c.stroke();

      // Measure label box dimensions
      c.font = "bold 15px sans-serif";
      const nameW = c.measureText(lm.name).width;
      c.font = "14px sans-serif";
      const elevW = c.measureText(lm.elev).width;
      const boxW = Math.max(nameW, elevW) + pad * 2;
      const boxH = lineH * 2 + pad;

      // Place label above dot; flip below if too close to chart top
      const flipBelow = (yPx - gap - boxH) < chartArea.top + 5;
      const boxTop = flipBelow ? yPx + gap : yPx - gap - boxH;

      // Clamp box horizontally to stay within chart area (handles edge landmarks)
      let boxLeft = xPx - boxW / 2;
      boxLeft = Math.max(chartArea.left, Math.min(chartArea.right - boxW, boxLeft));
      const boxCenterX = boxLeft + boxW / 2;

      // Background box for readability
      c.fillStyle = t.elevatedBg;
      c.beginPath();
      c.roundRect(boxLeft, boxTop, boxW, boxH, 3);
      c.fill();

      // Landmark name (bold)
      c.font = "bold 15px sans-serif";
      c.fillStyle = t.ink;
      c.textAlign = "center";
      c.textBaseline = "top";
      c.fillText(lm.name, boxCenterX, boxTop + pad);

      // Elevation value (regular, secondary)
      c.font = "14px sans-serif";
      c.fillStyle = t.inkSoft;
      c.fillText(lm.elev, boxCenterX, boxTop + pad + lineH);
    });

    c.restore();
  },
};

new Chart(canvas, {
  type: "line",
  data: {
    labels: distances,
    datasets: [{
      label: "Elevation",
      data: elevations,
      borderColor: t.palette[0],
      borderWidth: 2.5,
      fill: "start",
      backgroundColor(ctx) {
        const chart = ctx.chart;
        const { ctx: c, chartArea } = chart;
        if (!chartArea) return t.palette[0] + "60";
        const grad = c.createLinearGradient(0, chartArea.top, 0, chartArea.bottom);
        grad.addColorStop(0, t.palette[0] + "BB");
        grad.addColorStop(1, t.palette[0] + "18");
        return grad;
      },
      pointRadius: 0,
      tension: 0.3,
    }],
  },
  options: {
    responsive: true,
    maintainAspectRatio: false,
    animation: false,
    plugins: {
      title: {
        display: true,
        text: "area-elevation-profile · javascript · chartjs · anyplot.ai",
        color: t.ink,
        font: { size: 22, weight: "500" },
        padding: { top: 16, bottom: 4 },
      },
      subtitle: {
        display: true,
        text: "Vertical exaggeration ≈ 10×",
        color: t.inkSoft,
        font: { size: 13 },
        padding: { bottom: 10 },
      },
      legend: { display: false },
    },
    scales: {
      x: {
        type: "linear",
        min: 0,
        max: 80,
        ticks: {
          color: t.inkSoft,
          font: { size: 14 },
          stepSize: 10,
          callback: (v) => v + " km",
        },
        grid: { display: false },
        title: {
          display: true,
          text: "Distance (km)",
          color: t.ink,
          font: { size: 16 },
        },
        border: { color: t.inkSoft },
      },
      y: {
        min: 400,
        max: 2800,
        ticks: {
          color: t.inkSoft,
          font: { size: 14 },
          stepSize: 400,
          callback: (v) => v + " m",
        },
        grid: { color: t.grid },
        title: {
          display: true,
          text: "Elevation (m)",
          color: t.ink,
          font: { size: 16 },
        },
        border: { color: t.inkSoft },
      },
    },
  },
  plugins: [landmarkPlugin],
});
Runnable source as JSON, for any HTTP client: https://api.anyplot.ai/specs/area-elevation-profile/chartjs/code. Any spec id and library id listed in llms-full.txt fit the same URL shape; every URL below is complete and callable.
{
  "spec_id": "area-elevation-profile",
  "language": "javascript",
  "library": "chartjs",
  "page": "https://anyplot.ai/area-elevation-profile/javascript/chartjs",
  "hub": "https://anyplot.ai/area-elevation-profile",
  "code_json": "https://api.anyplot.ai/specs/area-elevation-profile/chartjs/code",
  "spec_json": "https://api.anyplot.ai/specs/area-elevation-profile",
  "render_light_png": "https://storage.googleapis.com/anyplot-images/plots/area-elevation-profile/javascript/chartjs/plot-light.png",
  "render_dark_png": "https://storage.googleapis.com/anyplot-images/plots/area-elevation-profile/javascript/chartjs/plot-dark.png",
  "interactive_light_html": "https://storage.googleapis.com/anyplot-images/plots/area-elevation-profile/javascript/chartjs/plot-light.html",
  "interactive_dark_html": "https://storage.googleapis.com/anyplot-images/plots/area-elevation-profile/javascript/chartjs/plot-dark.html",
  "quality_score": 90.0,
  "license": "MIT",
  "guide": "https://anyplot.ai/llms.txt"
}
Part of Terrain Elevation Profile Along Transect on anyplot.ai.