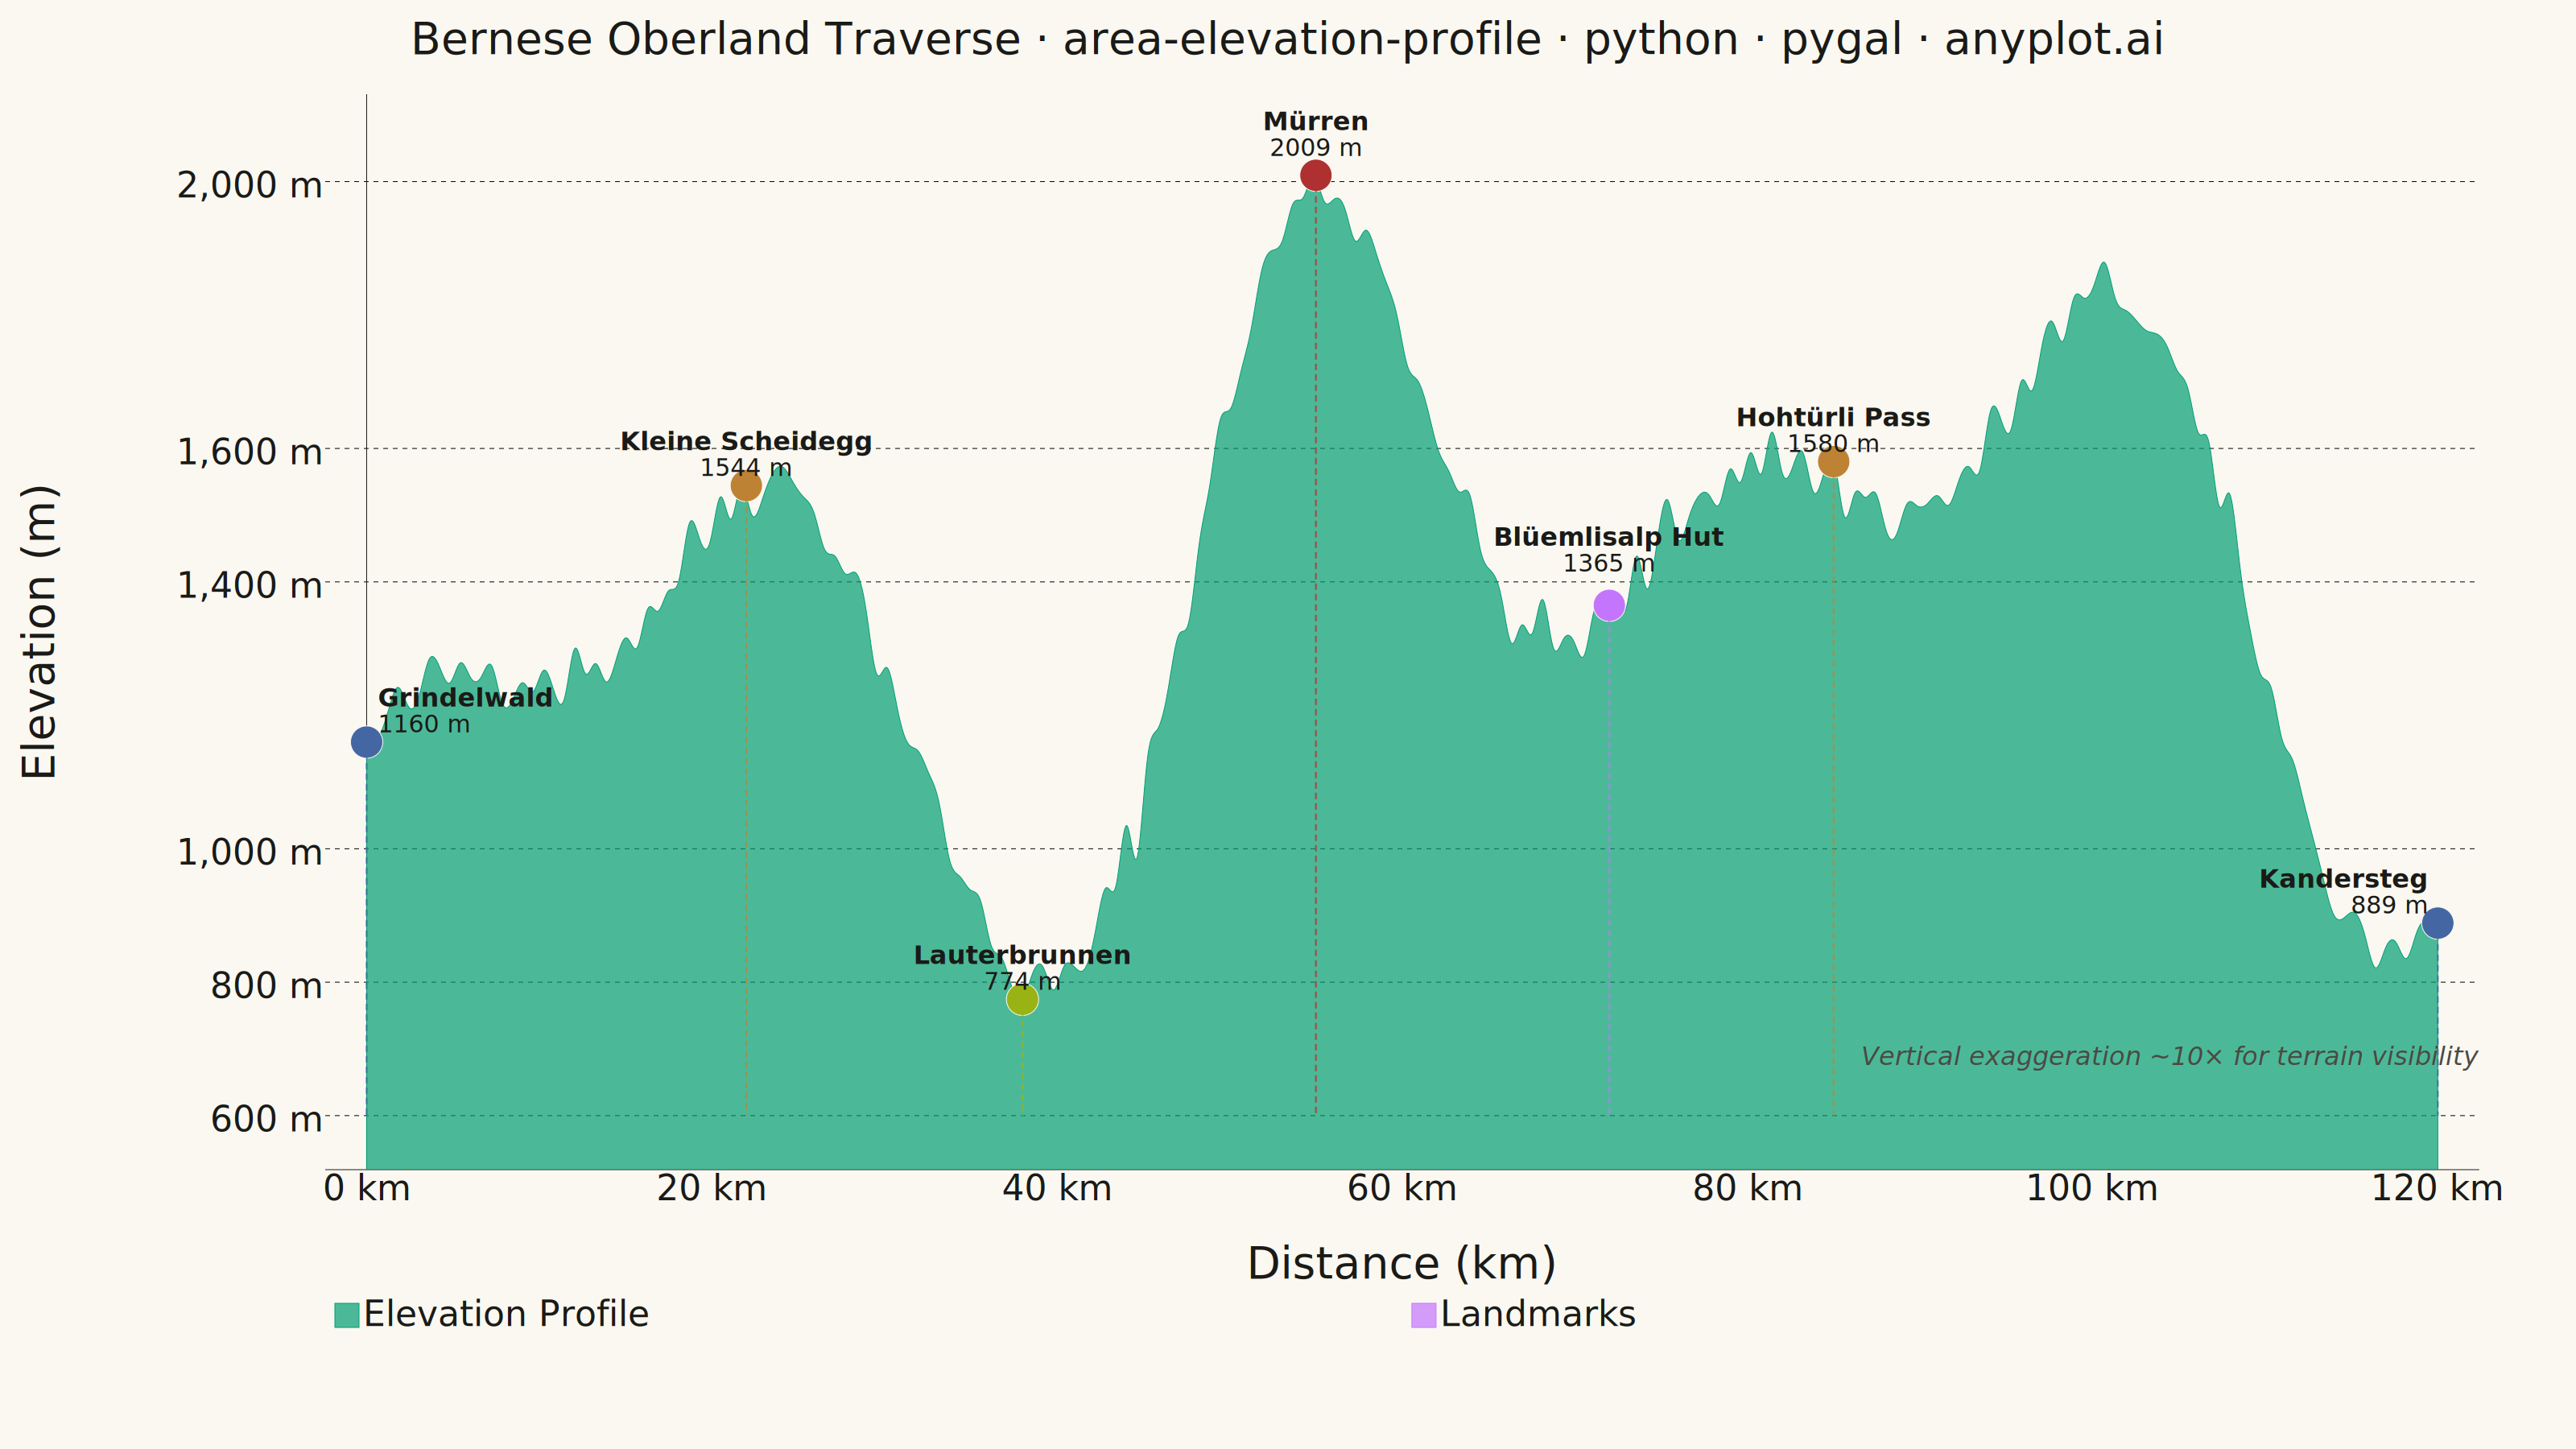
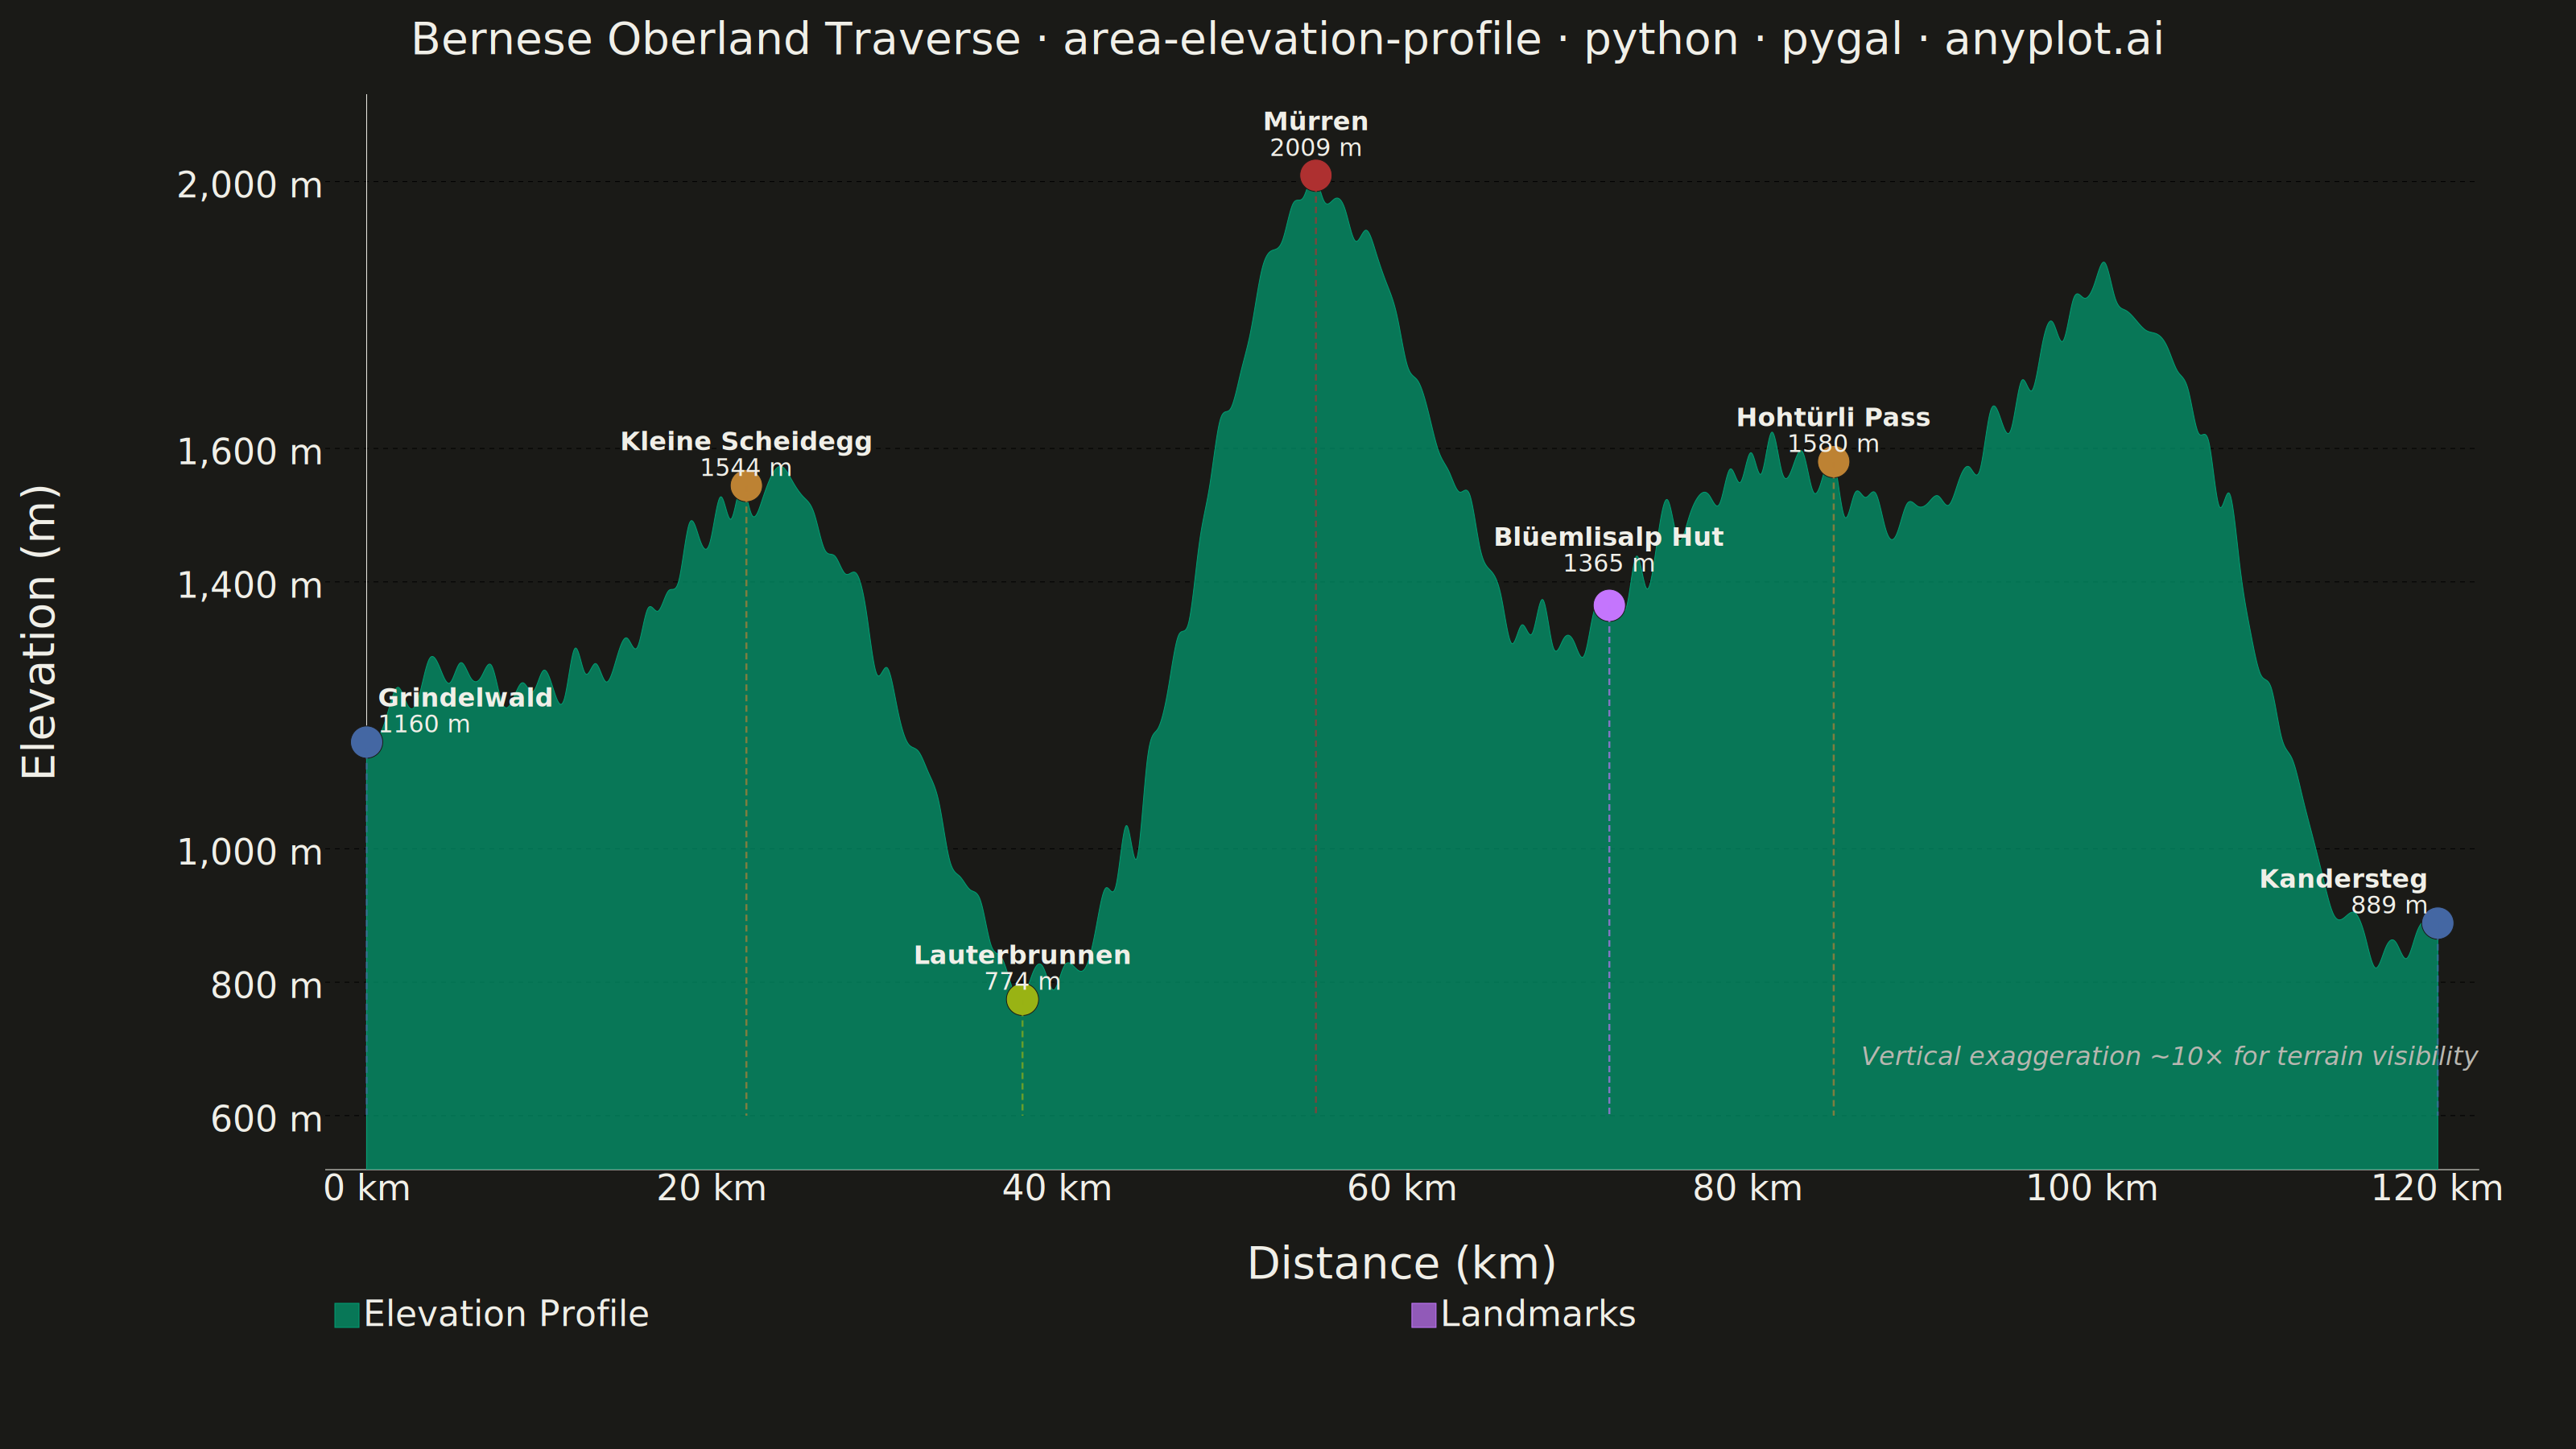
A cross-sectional line plot showing ground elevation along a path or transect line, with the area below the profile filled to create a terrain silhouette. Distance along the transect is plotted on the x-axis and elevation on the y-axis. This visualization is widely used in hiking and cycling route planning, civil engineering corridor design, and geomorphology to convey terrain shape and difficulty at a glance.
""" anyplot.ai
area-elevation-profile: Terrain Elevation Profile Along Transect
Library: pygal 3.1.0 | Python 3.13.13
Quality: 88/100 | Updated: 2026-06-10
"""

import os
import re
import xml.etree.ElementTree as ET

import cairosvg
import numpy as np
import pygal
from pygal.style import Style


# Theme tokens — Imprint palette
THEME = os.getenv("ANYPLOT_THEME", "light")
PAGE_BG = "#FAF8F1" if THEME == "light" else "#1A1A17"
INK = "#1A1A17" if THEME == "light" else "#F0EFE8"
INK_SOFT = "#4A4A44" if THEME == "light" else "#B8B7B0"
INK_MUTED = "#6B6A63" if THEME == "light" else "#A8A79F"

IMPRINT_PALETTE = ("#009E73", "#C475FD", "#4467A3", "#BD8233", "#AE3030", "#2ABCCD", "#954477", "#99B314")

# Landmark type colors — Imprint palette with semantic cues
TYPE_COLORS = {
    "summit": "#AE3030",  # matte red — elevation peak, highest difficulty
    "pass": "#BD8233",  # ochre — earthy mountain col
    "hut": "#C475FD",  # lavender — alpine shelter, distinctive
    "valley": "#99B314",  # lime — green valley floor
    "town": "#4467A3",  # blue — settlement / trailhead
}

# Data — Alpine hiking trail elevation profile (120 km transect)
np.random.seed(42)
distances_km = np.linspace(0, 120, 200)

base_terrain = (
    800
    + 600 * np.sin(distances_km * np.pi / 40) ** 2
    + 400 * np.sin(distances_km * np.pi / 25 + 1.2) ** 2
    + 300 * np.exp(-((distances_km - 55) ** 2) / 80)
    + 500 * np.exp(-((distances_km - 85) ** 2) / 120)
    - 200 * np.exp(-((distances_km - 30) ** 2) / 50)
)
noise = np.random.normal(0, 25, len(distances_km))
elevation_m = base_terrain + noise
elevation_m = np.maximum(elevation_m, 650)

landmarks = [
    {"name": "Grindelwald", "km": 0, "type": "town"},
    {"name": "Kleine Scheidegg", "km": 22, "type": "pass"},
    {"name": "Lauterbrunnen", "km": 38, "type": "valley"},
    {"name": "Mürren", "km": 55, "type": "summit"},
    {"name": "Blüemlisalp Hut", "km": 72, "type": "hut"},
    {"name": "Hohtürli Pass", "km": 85, "type": "pass"},
    {"name": "Kandersteg", "km": 120, "type": "town"},
]

for lm in landmarks:
    idx = np.argmin(np.abs(distances_km - lm["km"]))
    lm["elev"] = float(elevation_m[idx])

# Title length: 80 chars → fontsize = round(66 × 67 / 80) = 55
TITLE = "Bernese Oberland Traverse · area-elevation-profile · python · pygal · anyplot.ai"

custom_style = Style(
    background=PAGE_BG,
    plot_background=PAGE_BG,
    foreground=INK,
    foreground_strong=INK,
    foreground_subtle=INK_MUTED,
    colors=IMPRINT_PALETTE,
    font_family="DejaVu Sans, Helvetica, Arial, sans-serif",
    title_font_family="DejaVu Sans, Helvetica, Arial, sans-serif",
    title_font_size=55,
    label_font_size=56,
    major_label_font_size=44,
    value_font_size=36,
    legend_font_size=44,
    legend_font_family="DejaVu Sans, Helvetica, Arial, sans-serif",
    label_font_family="DejaVu Sans, Helvetica, Arial, sans-serif",
    major_label_font_family="DejaVu Sans, Helvetica, Arial, sans-serif",
    value_font_family="DejaVu Sans, Helvetica, Arial, sans-serif",
    opacity=0.70,
    opacity_hover=0.85,
    stroke_opacity=1.0,
    stroke_opacity_hover=1.0,
    tooltip_font_size=32,
    tooltip_font_family="DejaVu Sans, Helvetica, Arial, sans-serif",
    tooltip_border_radius=8,
)

chart = pygal.XY(
    width=3200,
    height=1800,
    title=TITLE,
    x_title="Distance (km)",
    y_title="Elevation (m)",
    style=custom_style,
    fill=True,
    show_dots=False,
    stroke_style={"width": 4},
    show_y_guides=True,
    show_x_guides=False,
    show_legend=True,
    legend_at_bottom=True,
    legend_box_size=30,
    value_formatter=lambda x: f"{x:,.0f} m",
    x_value_formatter=lambda x: f"{x:.0f} km",
    interpolate="cubic",
    interpolation_precision=300,
    min_scale=5,
    max_scale=10,
    margin_bottom=90,
    margin_left=90,
    margin_right=120,
    margin_top=50,
    spacing=12,
    tooltip_fancy_mode=True,
    range=(550, 2100),
    xrange=(0, 125),
    show_minor_x_labels=False,
    show_minor_y_labels=False,
    truncate_legend=-1,
    dynamic_print_values=True,
    print_values=False,
    show_x_labels=True,
    show_y_labels=True,
    x_labels_major_count=7,
    y_labels_major_count=6,
)

# Elevation profile — first series uses Imprint position 1 (#009E73)
profile_data = [
    {"value": (float(d), float(e)), "label": f"{d:.1f} km — {e:.0f} m"}
    for d, e in zip(distances_km, elevation_m, strict=True)
]
chart.add("Elevation Profile", profile_data)

# Landmark markers — colored by type in SVG post-processing below
landmark_data = [
    {"value": (float(lm["km"]), lm["elev"]), "label": f"{lm['name']} — {lm['elev']:.0f} m"} for lm in landmarks
]
chart.add("Landmarks", landmark_data, fill=False, show_dots=True, dots_size=20, stroke=False)

# Save interactive HTML with pygal's native tooltip support
chart.render_to_file(f"plot-{THEME}.html")

# Render SVG for annotation post-processing
svg_bytes = chart.render()
SVG_NS = "http://www.w3.org/2000/svg"
ET.register_namespace("", SVG_NS)
ET.register_namespace("xlink", "http://www.w3.org/1999/xlink")
root = ET.fromstring(svg_bytes)

parent_map = {child: parent for parent in root.iter() for child in parent}
circles = sorted(
    [c for c in root.iter(f"{{{SVG_NS}}}circle") if float(c.get("r", "0")) > 3], key=lambda c: float(c.get("cx", "0"))
)

# Find plot bottom from horizontal guide paths (format: "M0.0 Y h...")
plot_bottom_y = 0
for path in root.iter(f"{{{SVG_NS}}}path"):
    cls = path.get("class", "")
    d_attr = path.get("d", "")
    if "guide" in cls and " h" in d_attr:
        m = re.match(r"M[\d.]+ ([\d.]+) h", d_attr)
        if m:
            plot_bottom_y = max(plot_bottom_y, float(m.group(1)))

# Stagger closely-spaced labels to avoid overlap
label_offsets = {
    "Grindelwald": -44,
    "Kleine Scheidegg": -44,
    "Lauterbrunnen": -44,
    "Mürren": -56,
    "Blüemlisalp Hut": -74,
    "Hohtürli Pass": -44,
    "Kandersteg": -44,
}

ns = f"{{{SVG_NS}}}"
for i, circle in enumerate(circles[: len(landmarks)]):
    parent_elem = parent_map.get(circle)
    if parent_elem is None:
        continue

    cx, cy = float(circle.get("cx", "0")), float(circle.get("cy", "0"))
    lm = landmarks[i]
    lm_color = TYPE_COLORS.get(lm["type"], "#BD8233")
    y_off = label_offsets.get(lm["name"], -44)

    # Override circle fill to landmark-type color for clear visual differentiation
    circle.set("fill", lm_color)
    circle.set("stroke", PAGE_BG)
    circle.set("stroke-width", "3")

    # Text anchor by position along transect
    if i == 0:
        anchor, dx = "start", 14
    elif i == len(landmarks) - 1:
        anchor, dx = "end", -14
    else:
        anchor, dx = "middle", 0

    # Vertical dashed marker line from dot to plot baseline
    vline = ET.SubElement(parent_elem, f"{ns}line")
    for attr, val in [("x1", cx), ("y1", cy), ("x2", cx), ("y2", plot_bottom_y)]:
        vline.set(attr, f"{val:.1f}")
    vline.set("stroke", lm_color)
    vline.set("stroke-width", "2.5")
    vline.set("stroke-dasharray", "8,5")
    vline.set("opacity", "0.65")

    # Landmark name — bold, colored by type
    name_el = ET.SubElement(parent_elem, f"{ns}text")
    name_el.set("x", f"{cx + dx:.1f}")
    name_el.set("y", f"{cy + y_off:.1f}")
    name_el.set("text-anchor", anchor)
    name_el.set("font-size", "32")
    name_el.set("font-family", "DejaVu Sans, Helvetica, Arial, sans-serif")
    name_el.set("fill", lm_color)
    name_el.set("font-weight", "bold")
    name_el.text = lm["name"]

    # Elevation value — muted secondary label below name
    elev_el = ET.SubElement(parent_elem, f"{ns}text")
    elev_el.set("x", f"{cx + dx:.1f}")
    elev_el.set("y", f"{cy + y_off + 32:.1f}")
    elev_el.set("text-anchor", anchor)
    elev_el.set("font-size", "30")
    elev_el.set("font-family", "DejaVu Sans, Helvetica, Arial, sans-serif")
    elev_el.set("fill", INK_MUTED)
    elev_el.text = f"{lm['elev']:.0f} m"

# Vertical exaggeration note — bottom-right, more prominent than previous version
note_el = ET.SubElement(root, f"{ns}text")
note_el.set("x", "3080")
note_el.set("y", f"{plot_bottom_y + 54:.0f}")
note_el.set("text-anchor", "end")
note_el.set("font-size", "32")
note_el.set("font-family", "DejaVu Sans, Helvetica, Arial, sans-serif")
note_el.set("fill", INK_SOFT)
note_el.set("font-style", "italic")
note_el.text = "Vertical exaggeration ~10× for terrain visibility"

# Render final PNG
cairosvg.svg2png(bytestring=ET.tostring(root, encoding="unicode").encode("utf-8"), write_to=f"plot-{THEME}.png")
Runnable source as JSON, for any HTTP client: https://api.anyplot.ai/specs/area-elevation-profile/pygal/code. Any spec id and library id listed in llms-full.txt fit the same URL shape; every URL below is complete and callable.
{
  "spec_id": "area-elevation-profile",
  "language": "python",
  "library": "pygal",
  "page": "https://anyplot.ai/area-elevation-profile/python/pygal",
  "hub": "https://anyplot.ai/area-elevation-profile",
  "code_json": "https://api.anyplot.ai/specs/area-elevation-profile/pygal/code",
  "spec_json": "https://api.anyplot.ai/specs/area-elevation-profile",
  "render_light_png": "https://storage.googleapis.com/anyplot-images/plots/area-elevation-profile/python/pygal/plot-light.png",
  "render_dark_png": "https://storage.googleapis.com/anyplot-images/plots/area-elevation-profile/python/pygal/plot-dark.png",
  "interactive_light_html": "https://storage.googleapis.com/anyplot-images/plots/area-elevation-profile/python/pygal/plot-light.html",
  "interactive_dark_html": "https://storage.googleapis.com/anyplot-images/plots/area-elevation-profile/python/pygal/plot-dark.html",
  "quality_score": 88.0,
  "license": "MIT",
  "guide": "https://anyplot.ai/llms.txt"
}
Part of Terrain Elevation Profile Along Transect on anyplot.ai.