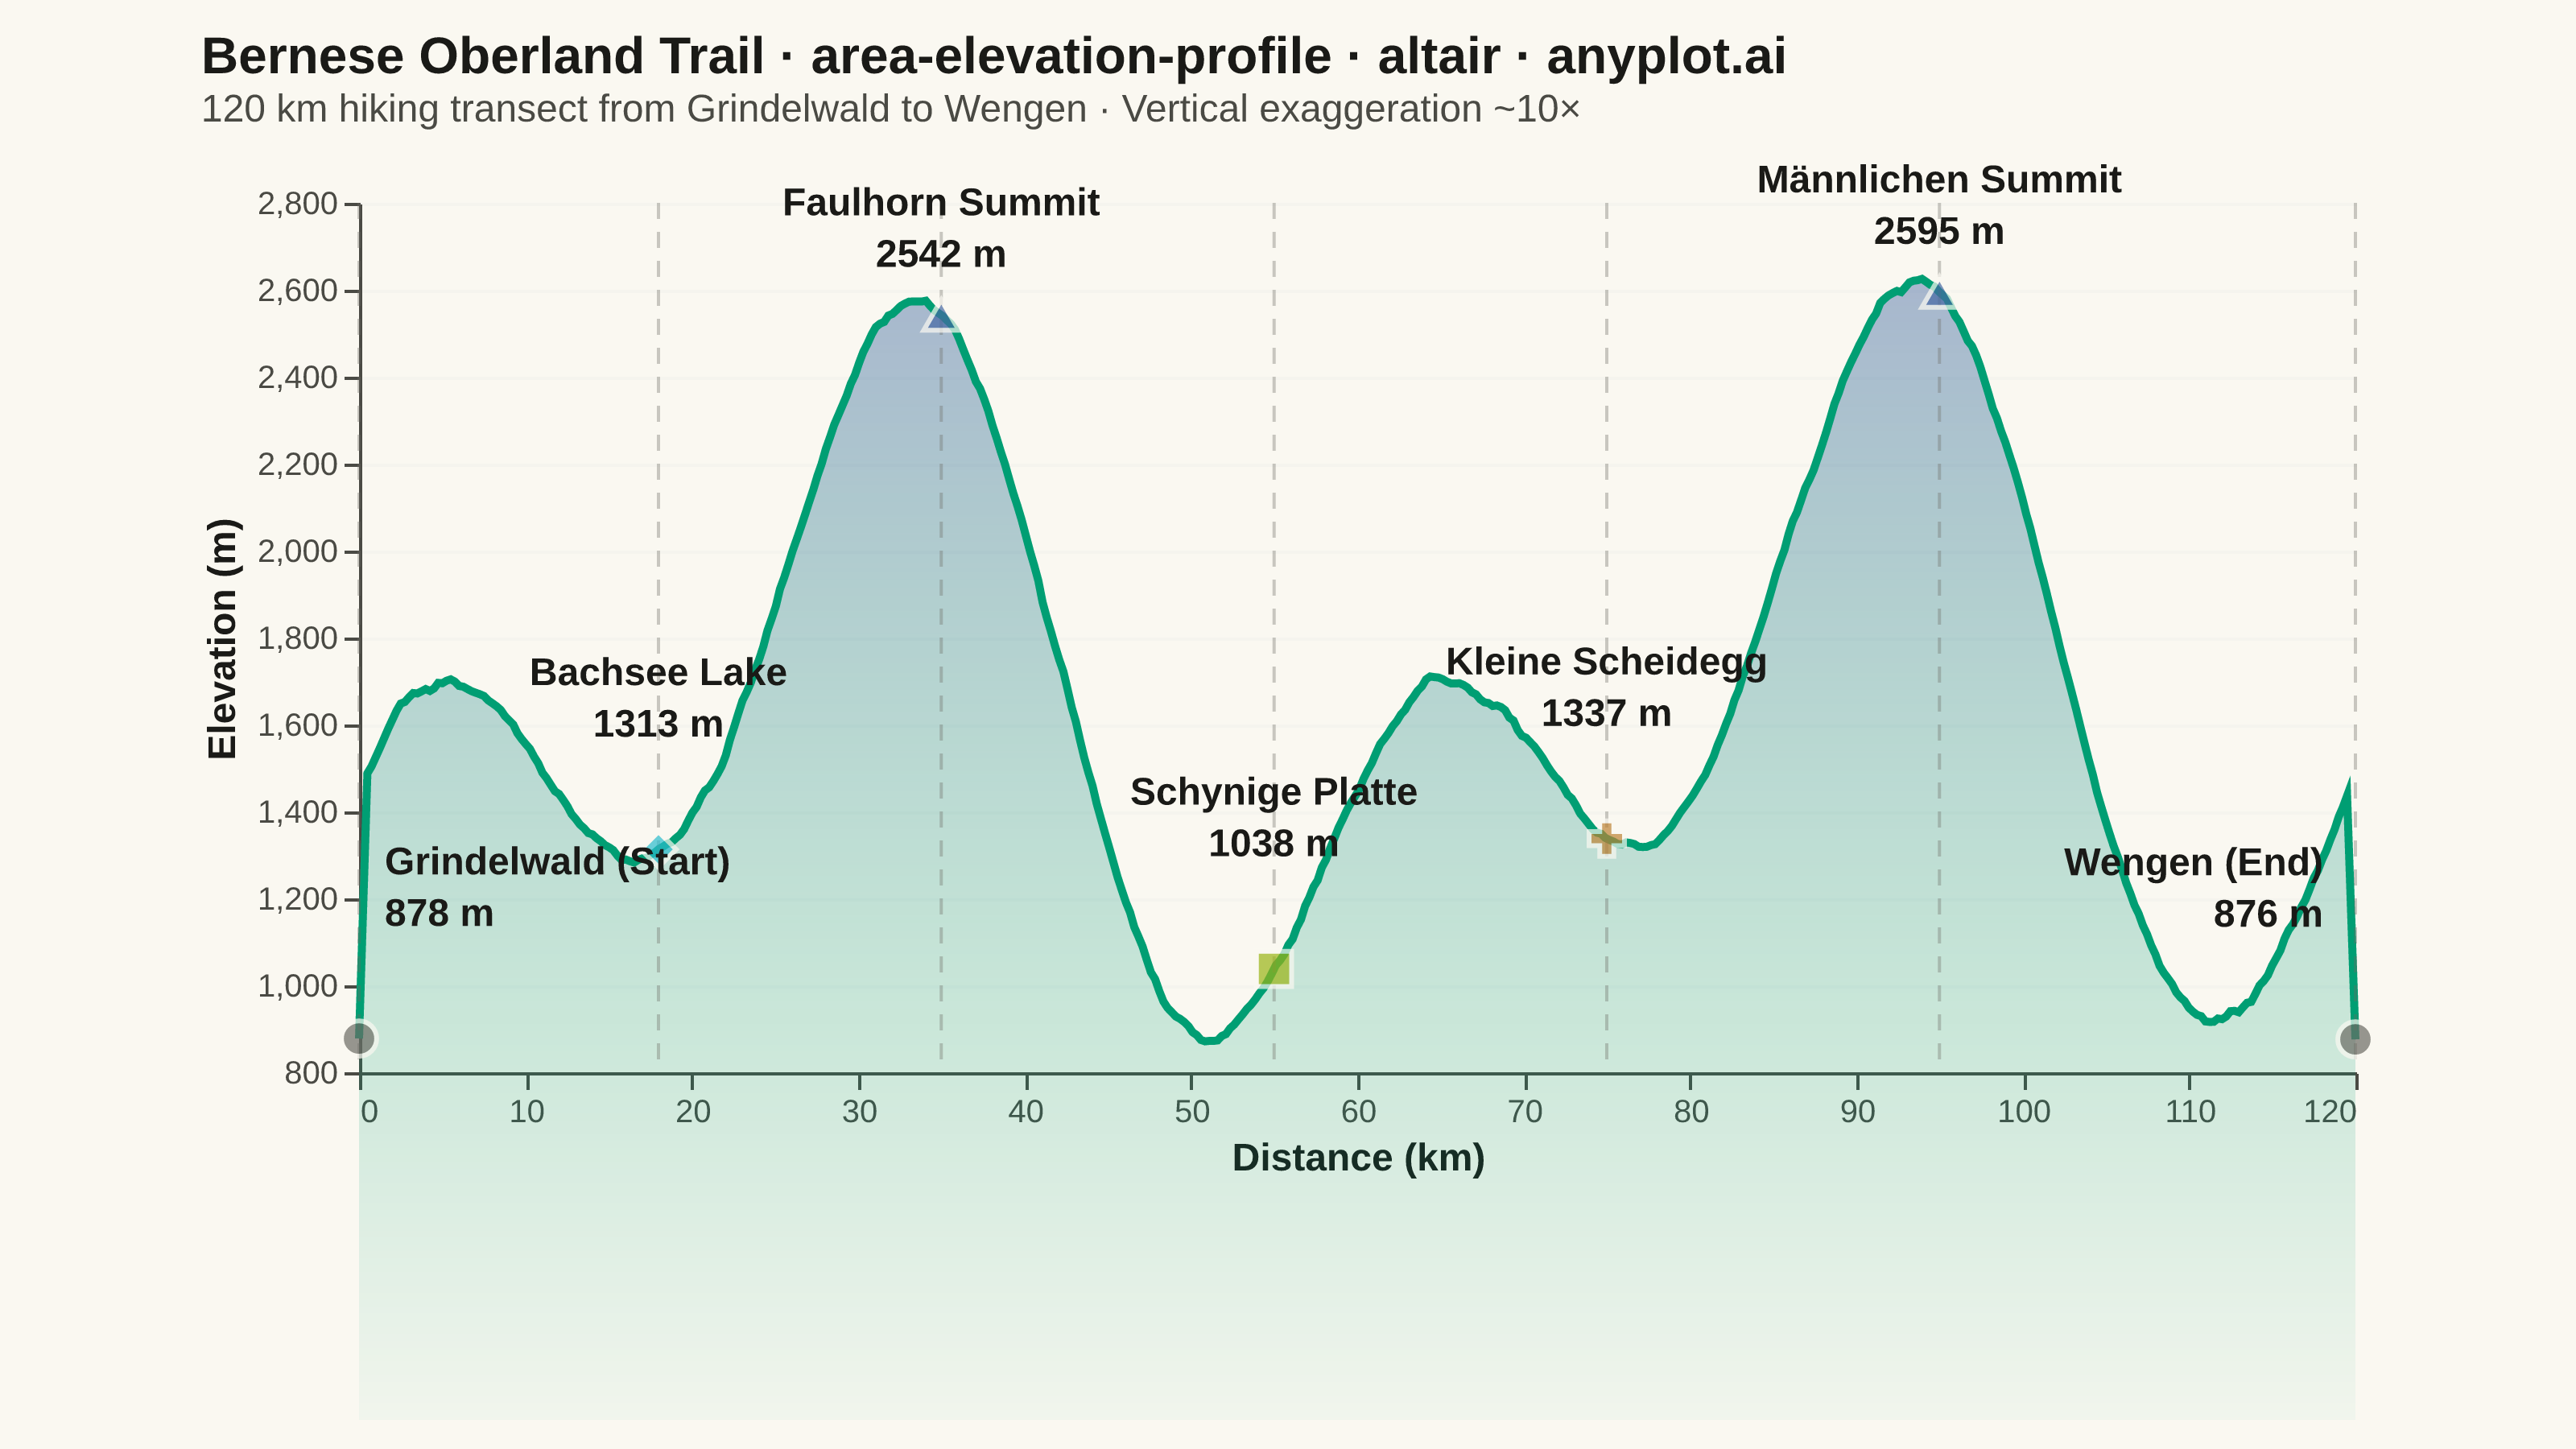
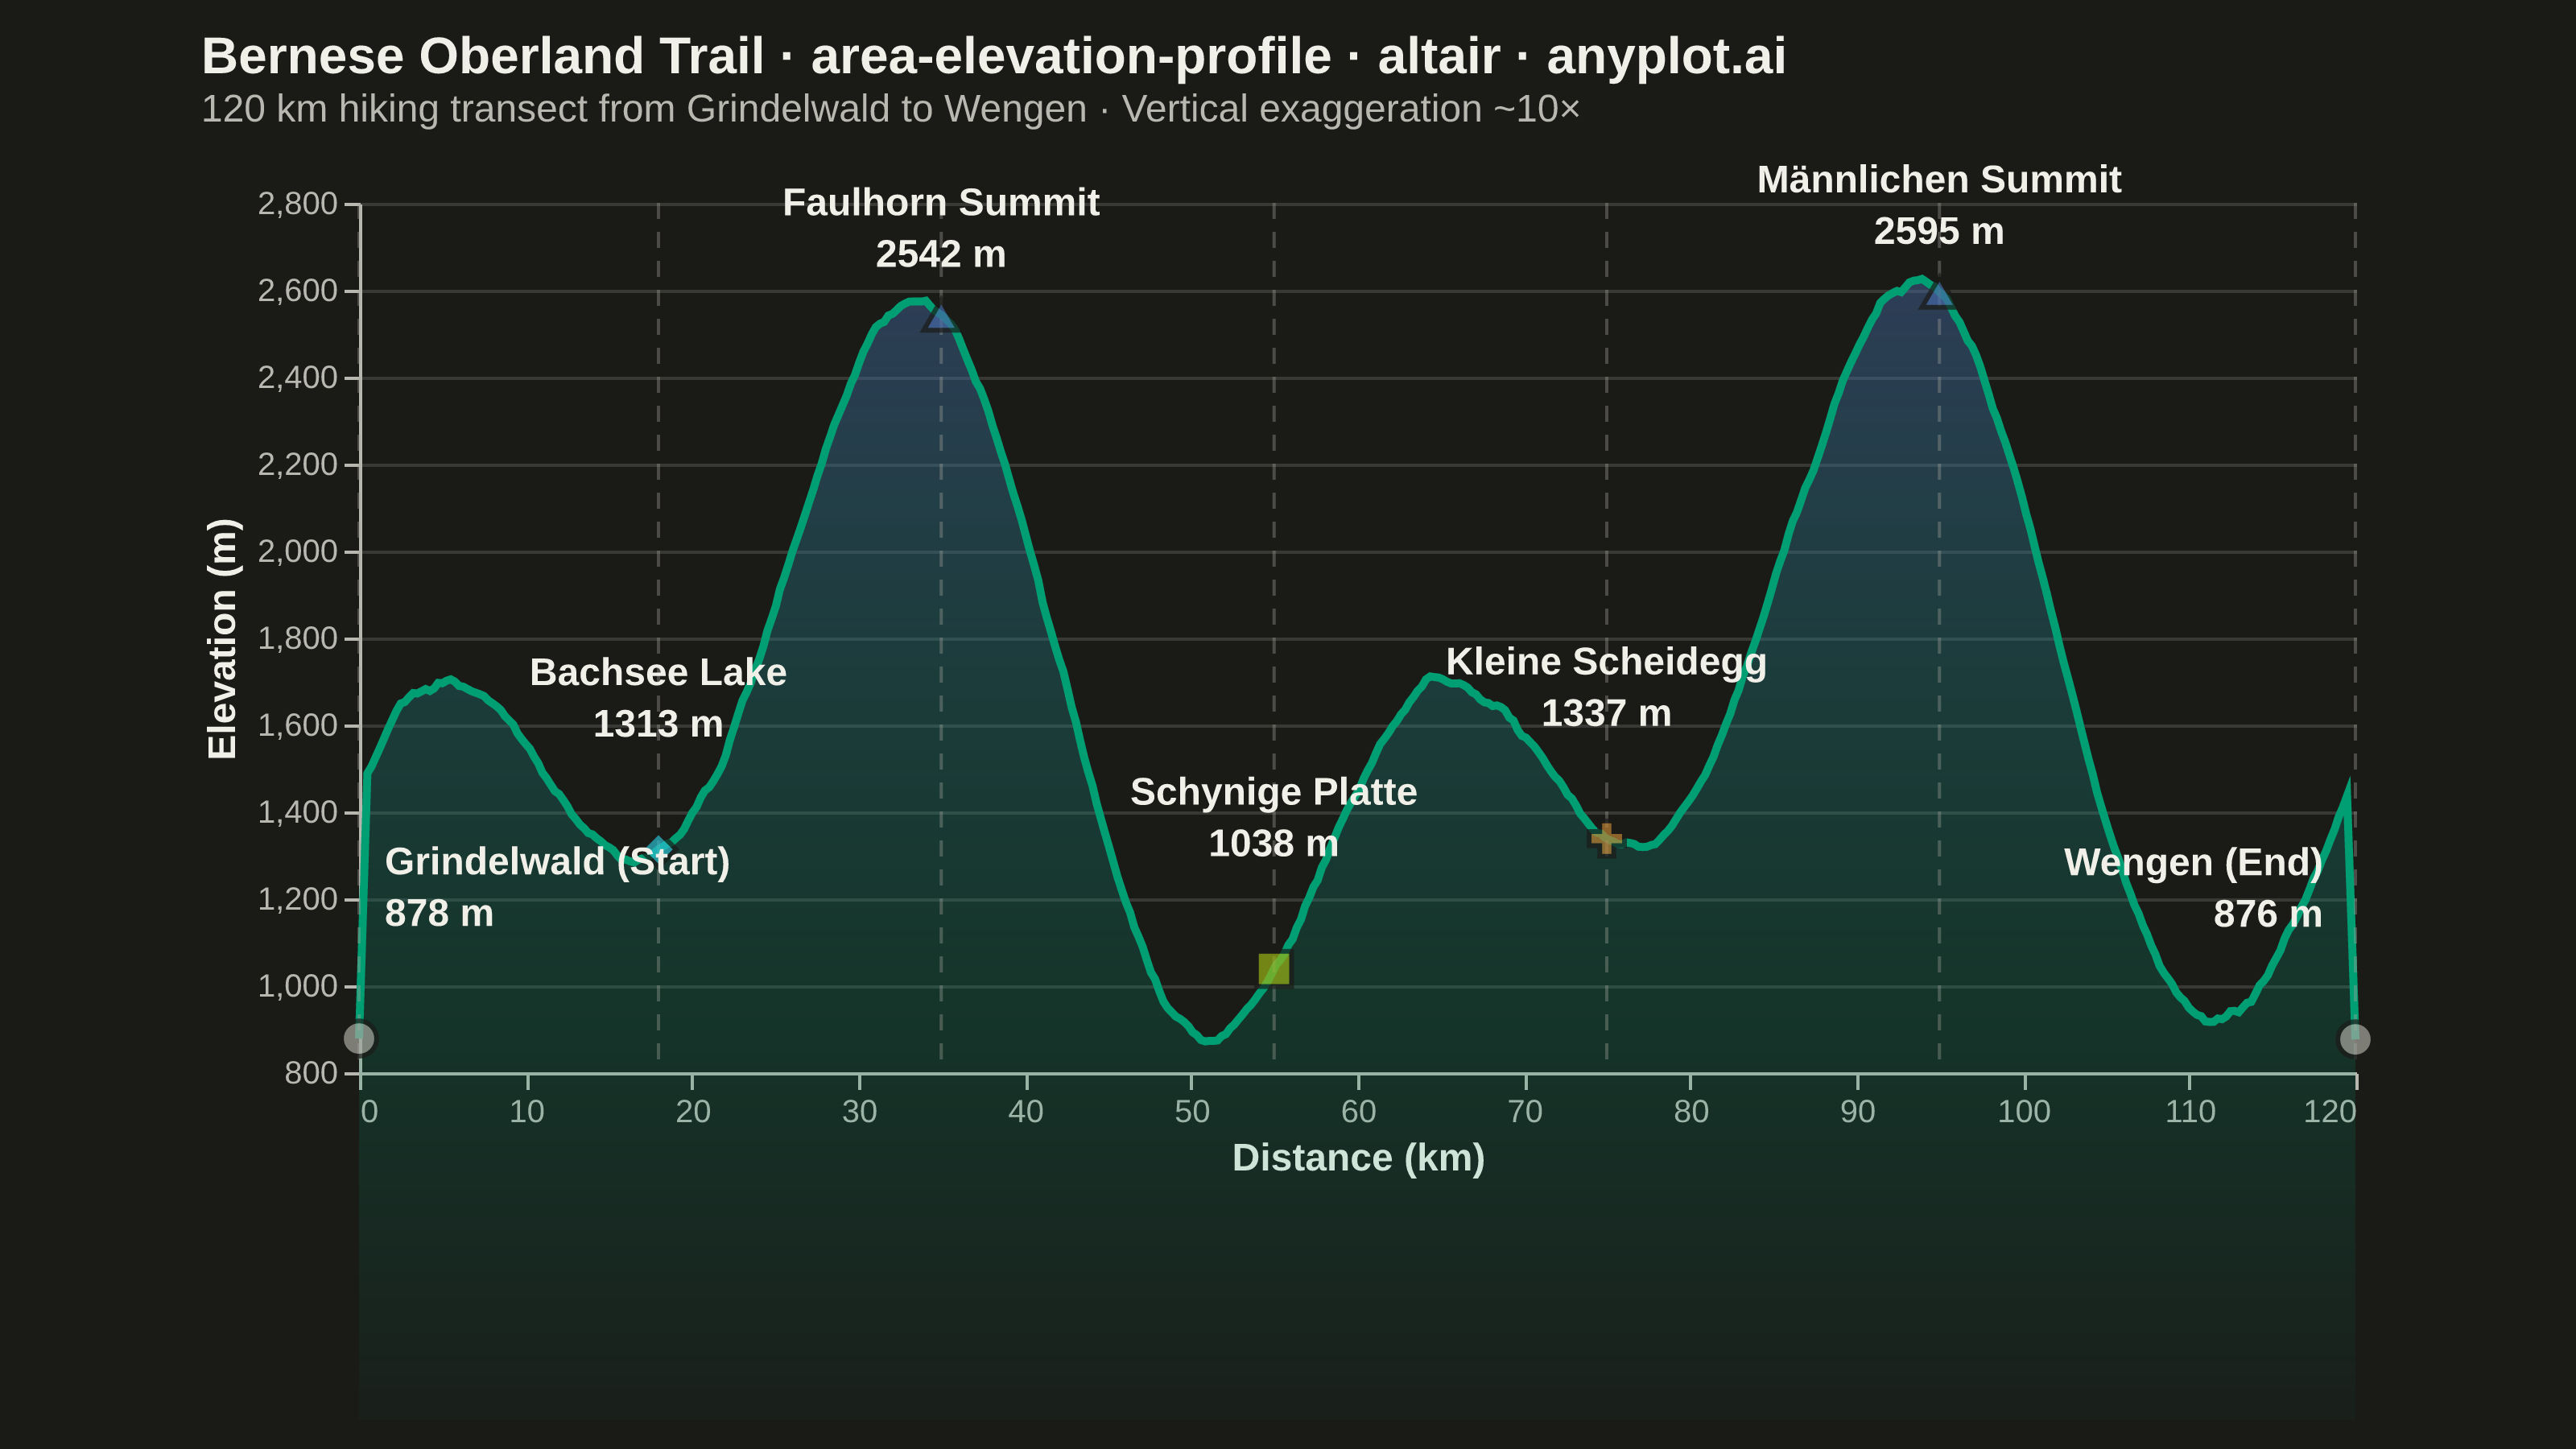
A cross-sectional line plot showing ground elevation along a path or transect line, with the area below the profile filled to create a terrain silhouette. Distance along the transect is plotted on the x-axis and elevation on the y-axis. This visualization is widely used in hiking and cycling route planning, civil engineering corridor design, and geomorphology to convey terrain shape and difficulty at a glance.
""" anyplot.ai
area-elevation-profile: Terrain Elevation Profile Along Transect
Library: altair 6.2.1 | Python 3.13.13
Quality: 88/100 | Updated: 2026-06-10
"""

import os
import sys


# Remove script directory from sys.path to avoid shadowing the altair library
_script_dir = os.path.dirname(os.path.abspath(__file__))
if _script_dir in sys.path:
    sys.path.remove(_script_dir)

import altair as alt
import numpy as np
import pandas as pd
from PIL import Image


# Theme-adaptive tokens (Imprint style guide)
THEME = os.getenv("ANYPLOT_THEME", "light")
PAGE_BG = "#FAF8F1" if THEME == "light" else "#1A1A17"
ELEVATED_BG = "#FFFDF6" if THEME == "light" else "#242420"
INK = "#1A1A17" if THEME == "light" else "#F0EFE8"
INK_SOFT = "#4A4A44" if THEME == "light" else "#B8B7B0"
INK_MUTED = "#6B6A63" if THEME == "light" else "#A8A79F"

# Imprint categorical palette (first series always #009E73)
IMPRINT_PALETTE = ["#009E73", "#C475FD", "#4467A3", "#BD8233", "#AE3030", "#2ABCCD", "#954477", "#99B314"]

# Landmark type → Imprint semantic color (water=cyan, sky/peak=blue, earth=ochre, vegetation=lime, built=muted)
LM_DOMAIN = ["summit", "lake", "pass", "plateau", "town"]
LM_COLORS = ["#4467A3", "#2ABCCD", "#BD8233", "#99B314", INK_MUTED]
LM_SHAPES = ["triangle-up", "diamond", "cross", "square", "circle"]

# --- Data: Alpine hiking trail ~120 km with realistic terrain ---
np.random.seed(42)
num_points = 480
distance = np.linspace(0, 120, num_points)

elevation = 900 + np.zeros(num_points)
elevation += 1000 * np.sin(distance * np.pi / 60) ** 2
elevation += 500 * np.sin(distance * np.pi / 30 + 1.2) ** 2
elevation += 250 * np.sin(distance * np.pi / 15 + 0.5)
elevation += np.cumsum(np.random.randn(num_points) * 3)
elevation += np.random.randn(num_points) * 15
kernel = np.ones(5) / 5
elevation = np.convolve(elevation, kernel, mode="same")
elevation = np.clip(elevation, 600, 2800)

df = pd.DataFrame({"distance": distance, "elevation": elevation})

landmarks = pd.DataFrame(
    {
        "name": [
            "Grindelwald (Start)",
            "Bachsee Lake",
            "Faulhorn Summit",
            "Schynige Platte",
            "Kleine Scheidegg",
            "Männlichen Summit",
            "Wengen (End)",
        ],
        "distance": [0.0, 18.0, 35.0, 55.0, 75.0, 95.0, 120.0],
        "type": ["town", "lake", "summit", "plateau", "pass", "summit", "town"],
    }
)
landmarks["elevation"] = np.interp(landmarks["distance"], distance, elevation)
landmarks["label"] = landmarks.apply(lambda r: f"{r['name']}\n{r['elevation']:.0f} m", axis=1)

y_min = int(np.floor(elevation.min() / 100) * 100)

# --- Chart layers ---

# Terrain silhouette: Imprint sequential gradient (green → blue, bottom-to-top)
area = (
    alt.Chart(df)
    .mark_area(
        line={"color": IMPRINT_PALETTE[0], "strokeWidth": 2.5},
        color=alt.Gradient(
            gradient="linear",
            stops=[
                alt.GradientStop(color="rgba(0,158,115,0.05)", offset=0),
                alt.GradientStop(color="rgba(0,158,115,0.28)", offset=0.35),
                alt.GradientStop(color="rgba(68,103,163,0.65)", offset=1),
            ],
            x1=1,
            x2=1,
            y1=1,
            y2=0,
        ),
    )
    .encode(
        x=alt.X("distance:Q", title="Distance (km)", scale=alt.Scale(domain=[0, 120])),
        y=alt.Y("elevation:Q", title="Elevation (m)", scale=alt.Scale(domain=[y_min, 2800])),
        tooltip=[
            alt.Tooltip("distance:Q", title="Distance (km)", format=".1f"),
            alt.Tooltip("elevation:Q", title="Elevation (m)", format=".0f"),
        ],
    )
)

# Dashed vertical rules at each landmark
landmark_rules = (
    alt.Chart(landmarks)
    .mark_rule(strokeWidth=1, strokeDash=[5, 4], opacity=0.35, color=INK_MUTED)
    .encode(x="distance:Q")
)

# Landmark points with Imprint semantic colors and shape-by-type
landmark_points = (
    alt.Chart(landmarks)
    .mark_point(size=120, filled=True, stroke=PAGE_BG, strokeWidth=1.5)
    .encode(
        x="distance:Q",
        y="elevation:Q",
        shape=alt.Shape("type:N", legend=None, scale=alt.Scale(domain=LM_DOMAIN, range=LM_SHAPES)),
        color=alt.Color("type:N", legend=None, scale=alt.Scale(domain=LM_DOMAIN, range=LM_COLORS)),
    )
)

# Labels: 4 lean layers (start / end / mid-low / mid-high) — common style via _kw
lm_start = landmarks[landmarks["distance"] == 0.0]
lm_end = landmarks[landmarks["distance"] == 120.0]
lm_mid = landmarks[(landmarks["distance"] > 0) & (landmarks["distance"] < 120)]
lm_mid_low = lm_mid[lm_mid["elevation"] < 1500]
lm_mid_high = lm_mid[lm_mid["elevation"] >= 1500]

_kw = {"fontSize": 12, "fontWeight": "bold", "lineBreak": "\n", "lineHeight": 16, "color": INK}

label_start = (
    alt.Chart(lm_start)
    .mark_text(align="left", dx=8, dy=-55, **_kw)
    .encode(x="distance:Q", y="elevation:Q", text="label:N")
)
label_end = (
    alt.Chart(lm_end)
    .mark_text(align="right", dx=-10, dy=-55, **_kw)
    .encode(x="distance:Q", y="elevation:Q", text="label:N")
)
label_mid_low = (
    alt.Chart(lm_mid_low)
    .mark_text(align="center", dy=-55, **_kw)
    .encode(x="distance:Q", y="elevation:Q", text="label:N")
)
label_mid_high = (
    alt.Chart(lm_mid_high)
    .mark_text(align="center", dy=-35, **_kw)
    .encode(x="distance:Q", y="elevation:Q", text="label:N")
)

# --- Compose ---
chart = (
    alt.layer(area, landmark_rules, landmark_points, label_start, label_mid_low, label_mid_high, label_end)
    .properties(
        width=620,
        height=270,
        background=PAGE_BG,
        title=alt.Title(
            "Bernese Oberland Trail · area-elevation-profile · altair · anyplot.ai",
            fontSize=16,
            subtitle="120 km hiking transect from Grindelwald to Wengen  ·  Vertical exaggeration ~10×",
            subtitleFontSize=12,
            subtitleColor=INK_SOFT,
            anchor="start",
            offset=10,
            color=INK,
        ),
    )
    .configure_view(fill=PAGE_BG, stroke=None)
    .configure_axis(
        labelFontSize=10,
        titleFontSize=12,
        gridOpacity=0.15,
        grid=True,
        domainColor=INK_SOFT,
        tickColor=INK_SOFT,
        labelColor=INK_SOFT,
        titleColor=INK,
    )
    .configure_axisX(grid=False)
    .configure_title(color=INK)
    .configure_legend(fillColor=ELEVATED_BG, strokeColor=INK_SOFT, labelColor=INK_SOFT, titleColor=INK)
)

# --- Save PNG with PAD-only to canonical 3200×1800 ---
TW, TH = 3200, 1800
chart.save(f"plot-{THEME}.png", scale_factor=4.0)
_img = Image.open(f"plot-{THEME}.png").convert("RGB")
_w, _h = _img.size
if _w > TW or _h > TH:
    raise SystemExit(
        f"altair vl-convert produced {_w}×{_h}, exceeds target {TW}×{TH}. "
        f"Shrink chart .properties(width=, height=) values and re-render."
    )
if _w < TW or _h < TH:
    _canvas = Image.new("RGB", (TW, TH), PAGE_BG)
    _canvas.paste(_img, ((TW - _w) // 2, (TH - _h) // 2))
    _canvas.save(f"plot-{THEME}.png")

# Save interactive HTML
chart.interactive().save(f"plot-{THEME}.html")
Runnable source as JSON, for any HTTP client: https://api.anyplot.ai/specs/area-elevation-profile/altair/code. Any spec id and library id listed in llms-full.txt fit the same URL shape; every URL below is complete and callable.
{
  "spec_id": "area-elevation-profile",
  "language": "python",
  "library": "altair",
  "page": "https://anyplot.ai/area-elevation-profile/python/altair",
  "hub": "https://anyplot.ai/area-elevation-profile",
  "code_json": "https://api.anyplot.ai/specs/area-elevation-profile/altair/code",
  "spec_json": "https://api.anyplot.ai/specs/area-elevation-profile",
  "render_light_png": "https://storage.googleapis.com/anyplot-images/plots/area-elevation-profile/python/altair/plot-light.png",
  "render_dark_png": "https://storage.googleapis.com/anyplot-images/plots/area-elevation-profile/python/altair/plot-dark.png",
  "interactive_light_html": "https://storage.googleapis.com/anyplot-images/plots/area-elevation-profile/python/altair/plot-light.html",
  "interactive_dark_html": "https://storage.googleapis.com/anyplot-images/plots/area-elevation-profile/python/altair/plot-dark.html",
  "quality_score": 88.0,
  "license": "MIT",
  "guide": "https://anyplot.ai/llms.txt"
}
Part of Terrain Elevation Profile Along Transect on anyplot.ai.