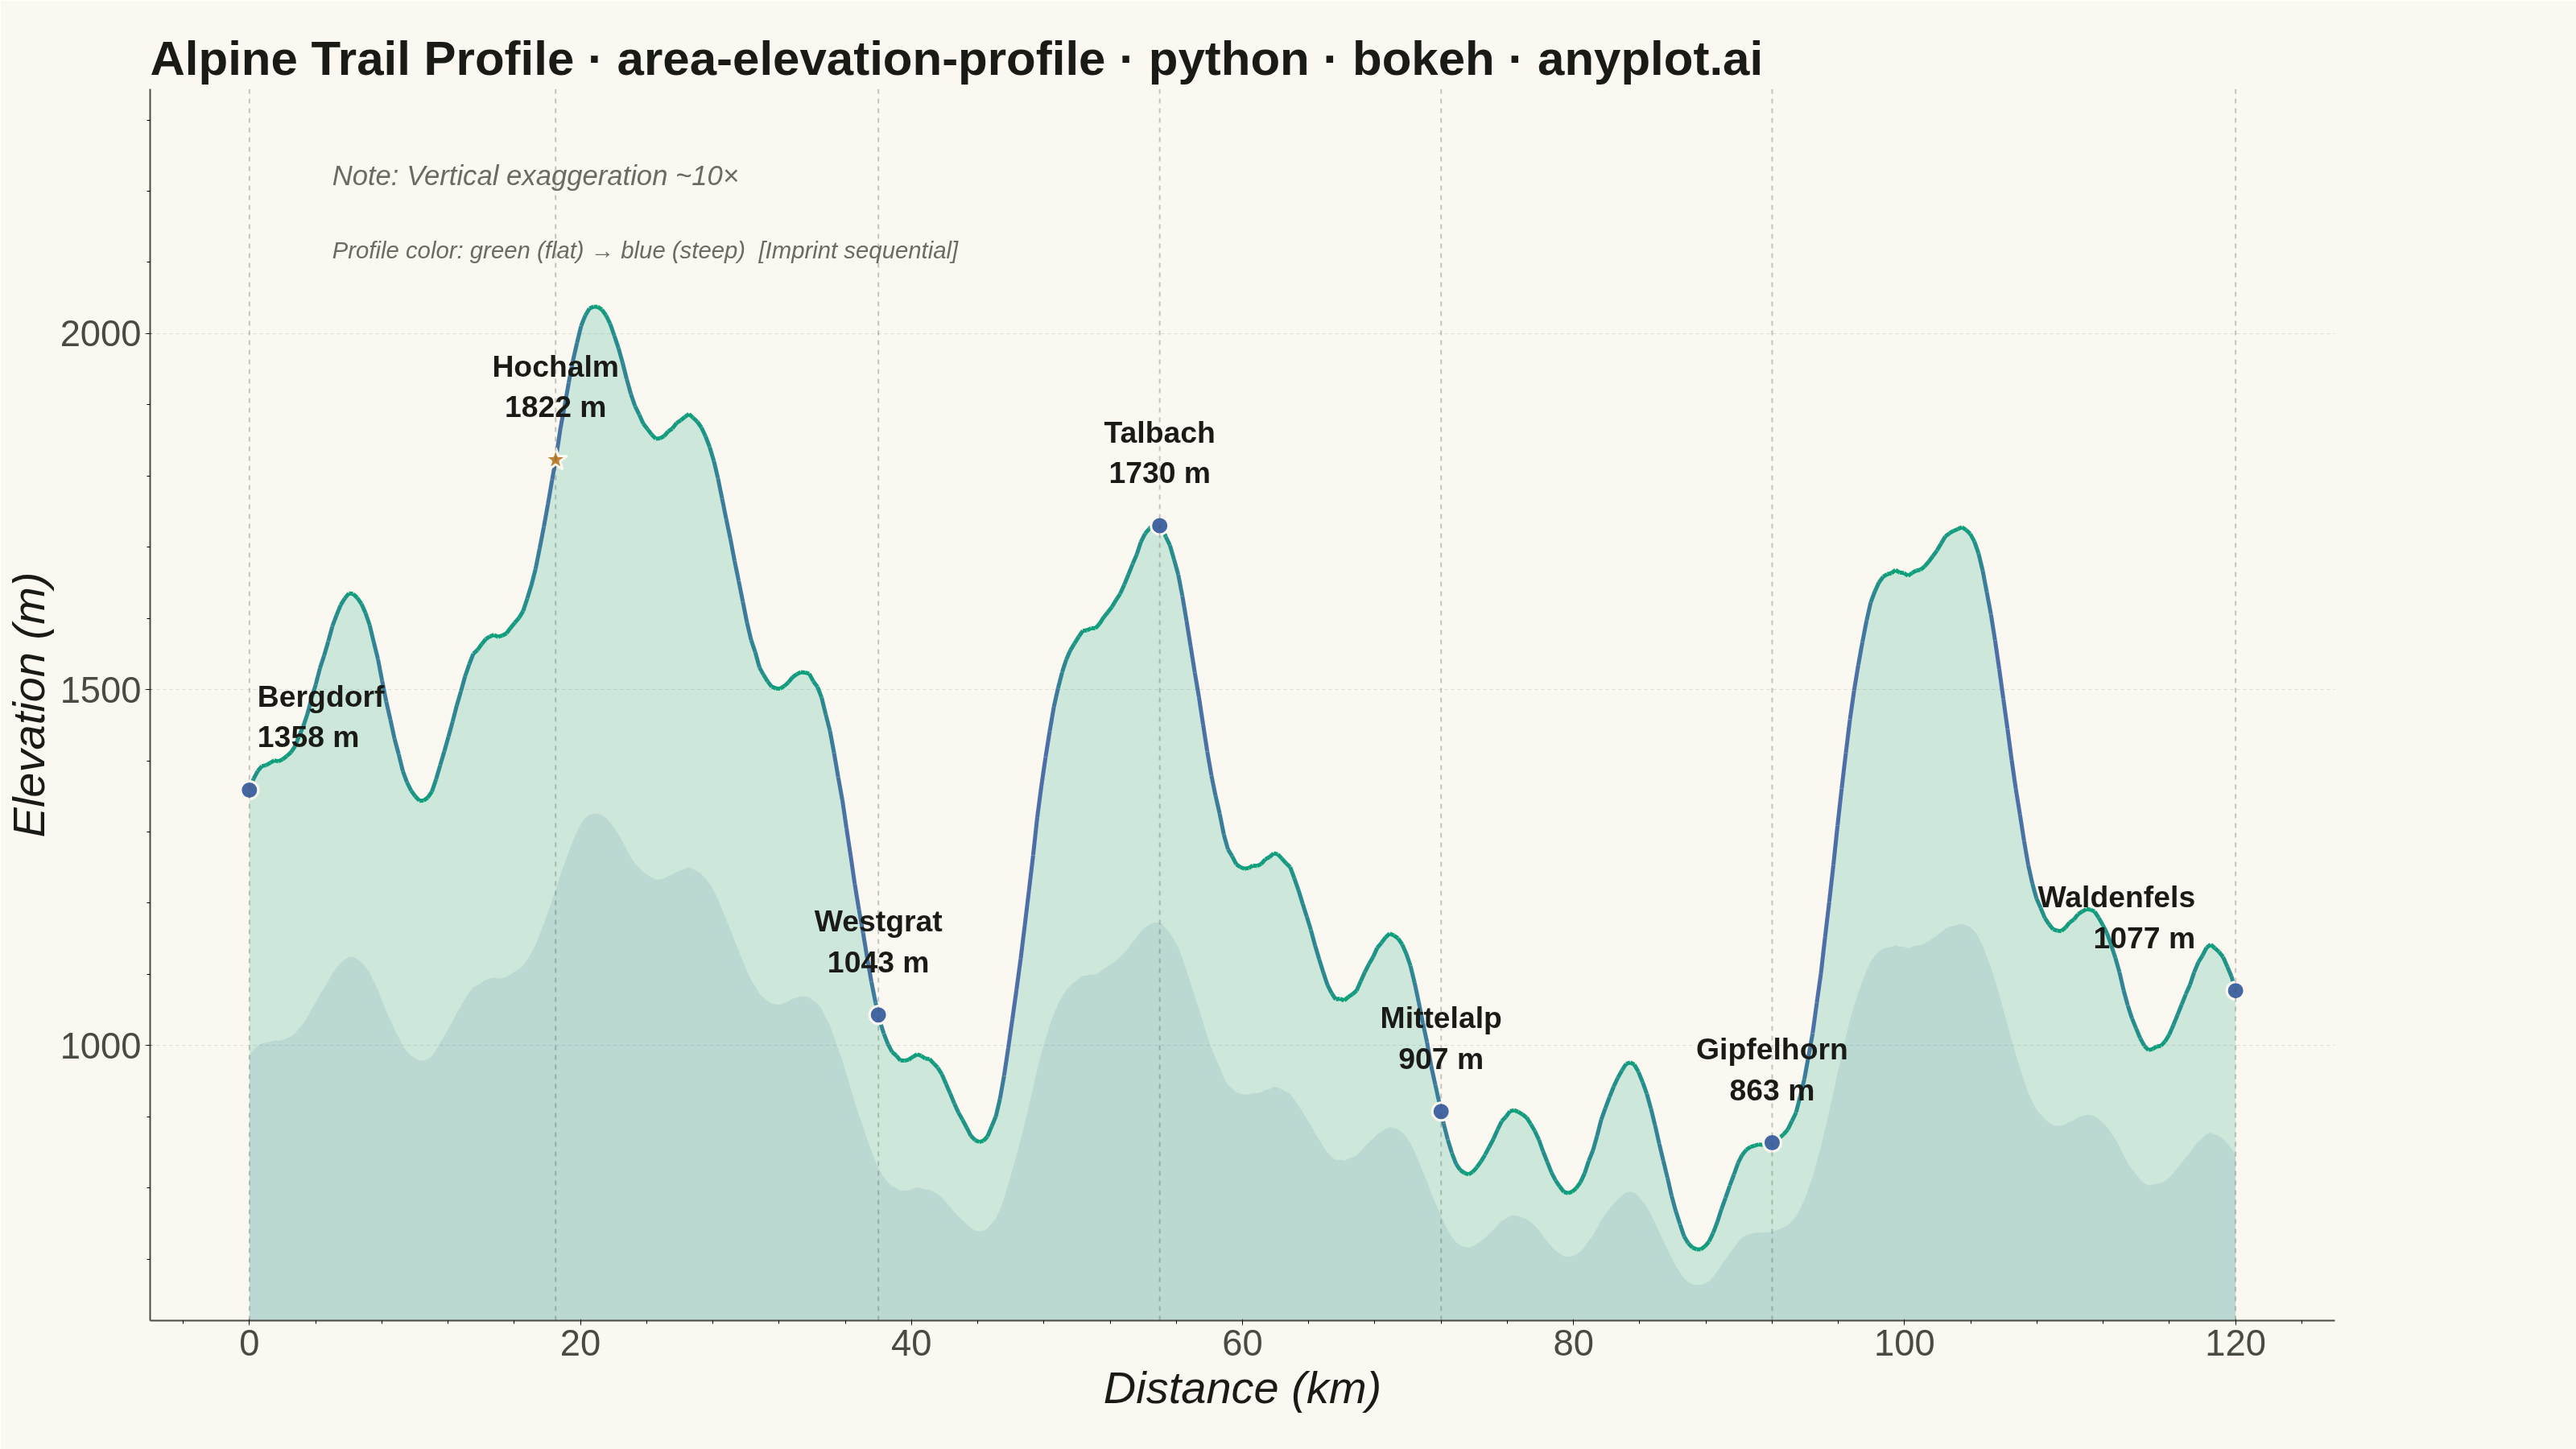
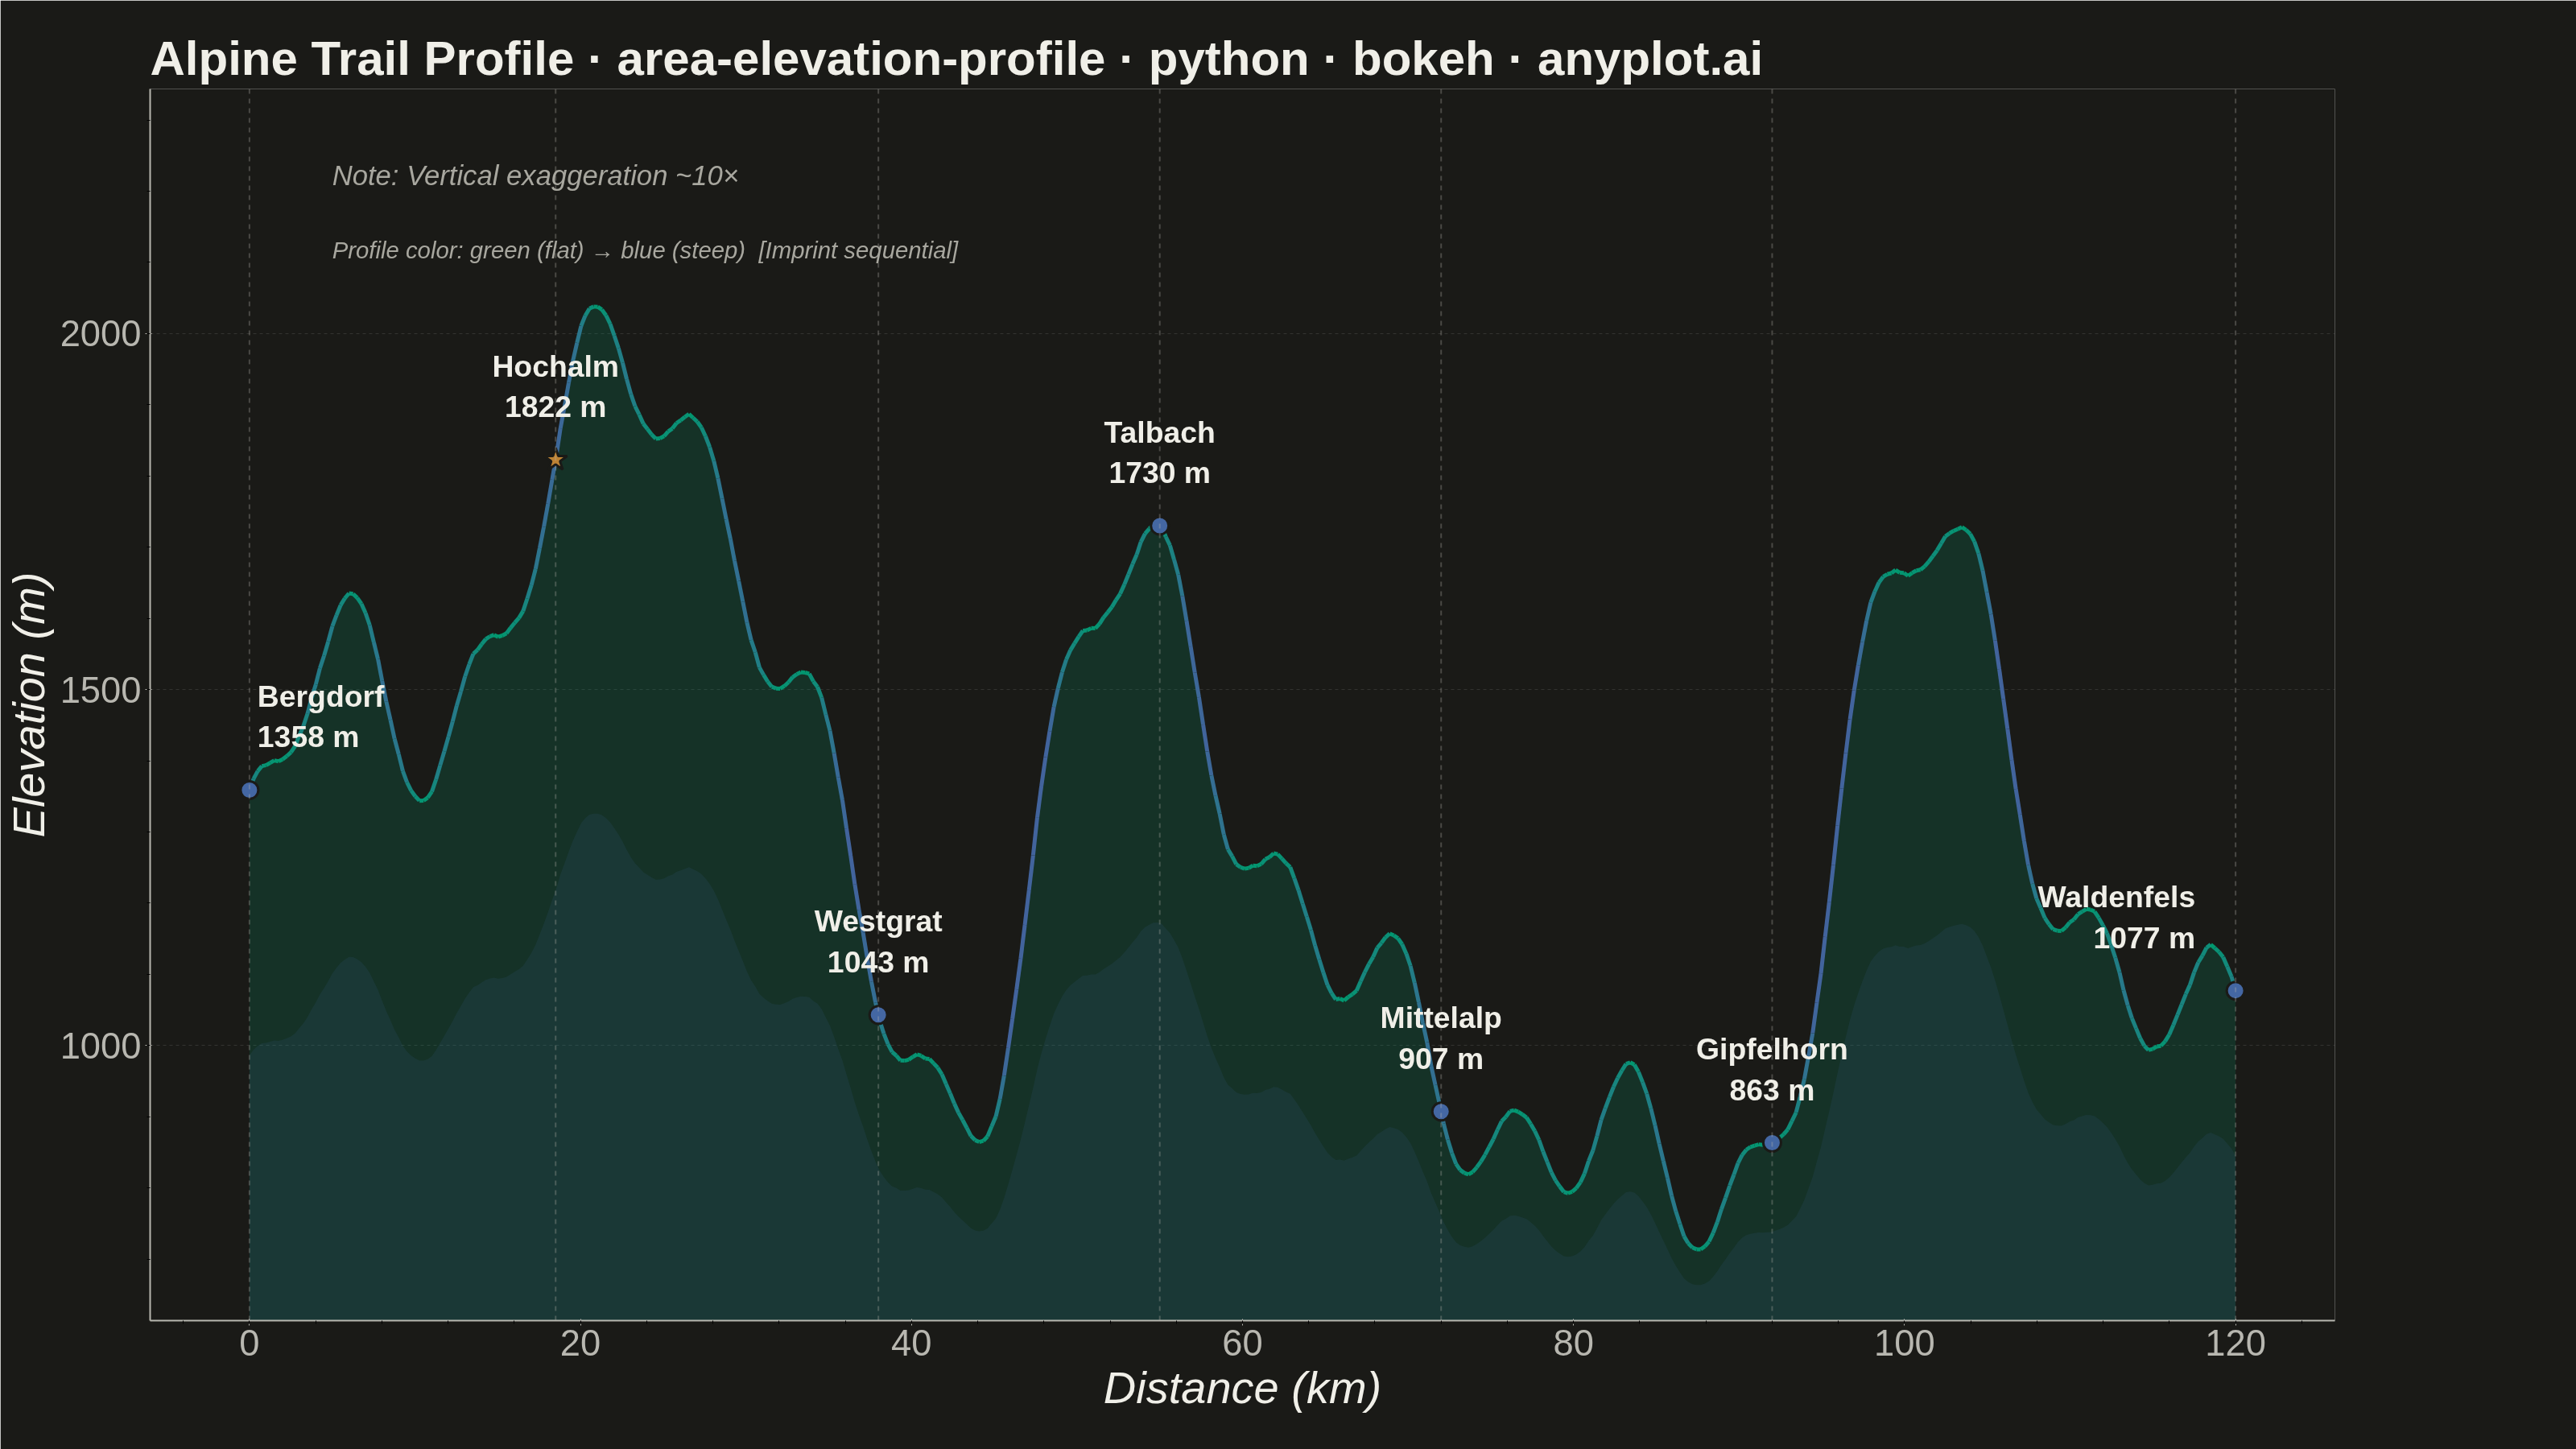
A cross-sectional line plot showing ground elevation along a path or transect line, with the area below the profile filled to create a terrain silhouette. Distance along the transect is plotted on the x-axis and elevation on the y-axis. This visualization is widely used in hiking and cycling route planning, civil engineering corridor design, and geomorphology to convey terrain shape and difficulty at a glance.
""" anyplot.ai
area-elevation-profile: Terrain Elevation Profile Along Transect
Library: bokeh 3.9.1 | Python 3.13.13
Quality: 92/100 | Updated: 2026-06-10
"""

import os
import sys


# Prevent self-import: this file is named bokeh.py, which shadows the installed
# bokeh package when its directory sits at the front of sys.path.
_this_dir = os.path.dirname(os.path.abspath(__file__))
sys.path = [p for p in sys.path if os.path.abspath(p or ".") != _this_dir]

import time
from pathlib import Path

import numpy as np
from bokeh.io import output_file, save
from bokeh.models import ColumnDataSource, HoverTool, Label, Span
from bokeh.plotting import figure
from selenium import webdriver
from selenium.webdriver.chrome.options import Options


# Theme tokens
THEME = os.getenv("ANYPLOT_THEME", "light")
PAGE_BG = "#FAF8F1" if THEME == "light" else "#1A1A17"
INK = "#1A1A17" if THEME == "light" else "#F0EFE8"
INK_SOFT = "#4A4A44" if THEME == "light" else "#B8B7B0"
INK_MUTED = "#6B6A63" if THEME == "light" else "#A8A79F"


# Imprint sequential colormap: green (flat) → blue (steep)
# #009E73 → #4467A3: r:0→68, g:158→103, b:115→163
IMPRINT_SEQ256 = [
    f"#{int(round(68 * t / 255)):02X}{int(round(158 - 55 * t / 255)):02X}{int(round(115 + 48 * t / 255)):02X}"
    for t in range(256)
]

# Data — Alpine hiking trail (120 km) with realistic terrain
np.random.seed(42)
n_points = 480
distance = np.linspace(0, 120, n_points)

base_elevation = 800
elevation = np.full(n_points, base_elevation, dtype=float)

# Broad terrain features
elevation += 600 * np.sin(distance * np.pi / 40) ** 2
elevation += 400 * np.sin(distance * np.pi / 25 + 1.2) ** 2
elevation += 300 * np.sin(distance * np.pi / 60 + 0.5)
elevation += 120 * np.sin(distance * np.pi / 8)
elevation += 80 * np.sin(distance * np.pi / 3.5 + 2.0)

noise = np.convolve(np.random.randn(n_points + 20) * 30, np.ones(20) / 20, mode="valid")[:n_points]
elevation += noise
elevation = np.maximum(elevation, 450)

slope = np.gradient(elevation, distance)
abs_slope = np.abs(slope)

# Landmarks — fictional Alpine locations along the transect
landmarks = [
    (0.0, "Bergdorf"),
    (18.5, "Hochalm"),
    (38.0, "Westgrat"),
    (55.0, "Talbach"),
    (72.0, "Mittelalp"),
    (92.0, "Gipfelhorn"),
    (120.0, "Waldenfels"),
]

landmark_distances = [lm[0] for lm in landmarks]
landmark_elevations = [float(np.interp(lm[0], distance, elevation)) for lm in landmarks]
landmark_names = [lm[1] for lm in landmarks]

elev_min = float(min(elevation))
elev_max = float(max(elevation))

# Slope-colored multi_line segments using Imprint sequential palette
slope_95 = float(np.percentile(abs_slope, 95))
seg_colors = [IMPRINT_SEQ256[int(np.clip(s / slope_95, 0, 1) * 255)] for s in abs_slope]

source = ColumnDataSource(
    data={
        "distance": distance,
        "elevation": elevation,
        "slope": abs_slope,
        "elev_fmt": [f"{e:.0f}" for e in elevation],
        "slope_fmt": [f"{s:.1f}" for s in abs_slope],
    }
)

seg_xs = [[distance[i], distance[i + 1]] for i in range(n_points - 1)]
seg_ys = [[elevation[i], elevation[i + 1]] for i in range(n_points - 1)]
seg_source = ColumnDataSource(data={"xs": seg_xs, "ys": seg_ys, "color": seg_colors[:-1]})

# Title — scaled fontsize: n=75 chars → round(50 * 67/75) = 45pt
title_str = "Alpine Trail Profile · area-elevation-profile · python · bokeh · anyplot.ai"
title_fontsize = f"{max(34, round(50 * 67 / len(title_str)))}pt"

# Plot
y_floor = max(0, elev_min - 100)

p = figure(
    width=3200,
    height=1800,
    title=title_str,
    x_axis_label="Distance (km)",
    y_axis_label="Elevation (m)",
    toolbar_location=None,
    min_border_bottom=160,
    min_border_left=180,
    min_border_top=110,
    min_border_right=300,  # extra room for right-edge landmark label
)

# Layered terrain fills using Imprint palette (green terrain + blue depth)
p.varea(x="distance", y1=y_floor, y2="elevation", source=source, fill_color="#009E73", fill_alpha=0.18)

mid_elev = (np.array(elevation) + y_floor) / 2
mid_source = ColumnDataSource(data={"distance": distance, "mid": mid_elev})
p.varea(x="distance", y1=y_floor, y2="mid", source=mid_source, fill_color="#4467A3", fill_alpha=0.12)

# Slope-colored profile line (Imprint sequential: green=flat → blue=steep)
p.multi_line(xs="xs", ys="ys", source=seg_source, line_color="color", line_width=5, line_alpha=0.95)

# HoverTool for interactive HTML version
hover = HoverTool(
    tooltips=[("Distance", "@distance{0.1} km"), ("Elevation", "@elev_fmt m"), ("Slope", "@slope_fmt m/km")],
    mode="vline",
)
p.add_tools(hover)

# Landmark vertical markers and labels — peak landmark uses ochre star for climax emphasis
peak_lm_idx = int(np.argmax(landmark_elevations))
for i, (lm_dist, lm_elev, lm_name) in enumerate(
    zip(landmark_distances, landmark_elevations, landmark_names, strict=True)
):
    vline = Span(
        location=lm_dist, dimension="height", line_color=INK_SOFT, line_width=2, line_alpha=0.3, line_dash="dashed"
    )
    p.add_layout(vline)

    label_text = f"{lm_name}\n{int(lm_elev)} m"
    align = "center"
    x_off = 0
    if i == 0:
        align = "left"
        x_off = 10
    elif i == len(landmarks) - 1:
        align = "right"
        x_off = -50
    label = Label(
        x=lm_dist,
        y=lm_elev,
        text=label_text,
        text_font_size="28pt",
        text_color=INK,
        text_font_style="bold",
        text_align=align,
        x_offset=x_off,
        y_offset=45,
    )
    p.add_layout(label)

    dot_color = "#BD8233" if i == peak_lm_idx else "#4467A3"
    dot_marker = "star" if i == peak_lm_idx else "circle"
    dot_size = 30 if i == peak_lm_idx else 22
    p.scatter(
        x=[lm_dist],
        y=[lm_elev],
        size=dot_size,
        fill_color=dot_color,
        line_color=PAGE_BG,
        line_width=3,
        marker=dot_marker,
    )

# Theme-adaptive chrome
p.background_fill_color = PAGE_BG
p.border_fill_color = PAGE_BG
p.outline_line_color = None

p.title.text_font_size = title_fontsize
p.title.text_color = INK

p.xaxis.axis_label_text_font_size = "42pt"
p.yaxis.axis_label_text_font_size = "42pt"
p.xaxis.major_label_text_font_size = "34pt"
p.yaxis.major_label_text_font_size = "34pt"
p.xaxis.axis_label_text_color = INK
p.yaxis.axis_label_text_color = INK
p.xaxis.major_label_text_color = INK_SOFT
p.yaxis.major_label_text_color = INK_SOFT
p.xaxis.axis_line_color = INK_SOFT
p.yaxis.axis_line_color = INK_SOFT
p.xaxis.major_tick_line_color = INK_SOFT
p.yaxis.major_tick_line_color = INK_SOFT
p.xaxis.axis_line_width = 2
p.yaxis.axis_line_width = 2

# Grid — y-axis only, subtle
p.xgrid.grid_line_alpha = 0
p.ygrid.grid_line_alpha = 0.12
p.ygrid.grid_line_dash = [4, 4]
p.ygrid.grid_line_color = INK

p.y_range.start = y_floor
p.y_range.end = elev_max * 1.15

# Annotation notes
p.add_layout(
    Label(
        x=5,
        y=elev_max * 1.08,
        text="Note: Vertical exaggeration ~10×",
        text_font_size="26pt",
        text_color=INK_MUTED,
        text_font_style="italic",
    )
)
p.add_layout(
    Label(
        x=5,
        y=elev_max * 1.03,
        text="Profile color: green (flat) → blue (steep)  [Imprint sequential]",
        text_font_size="22pt",
        text_color=INK_MUTED,
        text_font_style="italic",
    )
)

# Save — HTML artifact + headless Chrome screenshot
output_file(f"plot-{THEME}.html")
save(p)

W, H = 3200, 1800
opts = Options()
for arg in (
    "--headless=new",
    "--no-sandbox",
    "--disable-dev-shm-usage",
    "--disable-gpu",
    f"--window-size={W},{H}",
    "--hide-scrollbars",
):
    opts.add_argument(arg)
driver = webdriver.Chrome(options=opts)
# CDP override forces exact W×H viewport regardless of outer window chrome
driver.execute_cdp_cmd(
    "Emulation.setDeviceMetricsOverride", {"width": W, "height": H, "deviceScaleFactor": 1, "mobile": False}
)
driver.get(f"file://{Path(f'plot-{THEME}.html').resolve()}")
time.sleep(3)
driver.save_screenshot(f"plot-{THEME}.png")
driver.quit()
Runnable source as JSON, for any HTTP client: https://api.anyplot.ai/specs/area-elevation-profile/bokeh/code. Any spec id and library id listed in llms-full.txt fit the same URL shape; every URL below is complete and callable.
{
  "spec_id": "area-elevation-profile",
  "language": "python",
  "library": "bokeh",
  "page": "https://anyplot.ai/area-elevation-profile/python/bokeh",
  "hub": "https://anyplot.ai/area-elevation-profile",
  "code_json": "https://api.anyplot.ai/specs/area-elevation-profile/bokeh/code",
  "spec_json": "https://api.anyplot.ai/specs/area-elevation-profile",
  "render_light_png": "https://storage.googleapis.com/anyplot-images/plots/area-elevation-profile/python/bokeh/plot-light.png",
  "render_dark_png": "https://storage.googleapis.com/anyplot-images/plots/area-elevation-profile/python/bokeh/plot-dark.png",
  "interactive_light_html": "https://storage.googleapis.com/anyplot-images/plots/area-elevation-profile/python/bokeh/plot-light.html",
  "interactive_dark_html": "https://storage.googleapis.com/anyplot-images/plots/area-elevation-profile/python/bokeh/plot-dark.html",
  "quality_score": 92.0,
  "license": "MIT",
  "guide": "https://anyplot.ai/llms.txt"
}
Part of Terrain Elevation Profile Along Transect on anyplot.ai.