The same plot in 14 other libraries — Python: Altair, Bokeh, lets-plot, Matplotlib, Plotly, plotnine, Pygal, Seaborn; R: ggplot2; JavaScript: Chart.js, D3.js, Apache ECharts, Highcharts, MUI X Charts. Compare all 15 side by side: Terrain Elevation Profile Along Transect in Python, R, Julia and JavaScript.
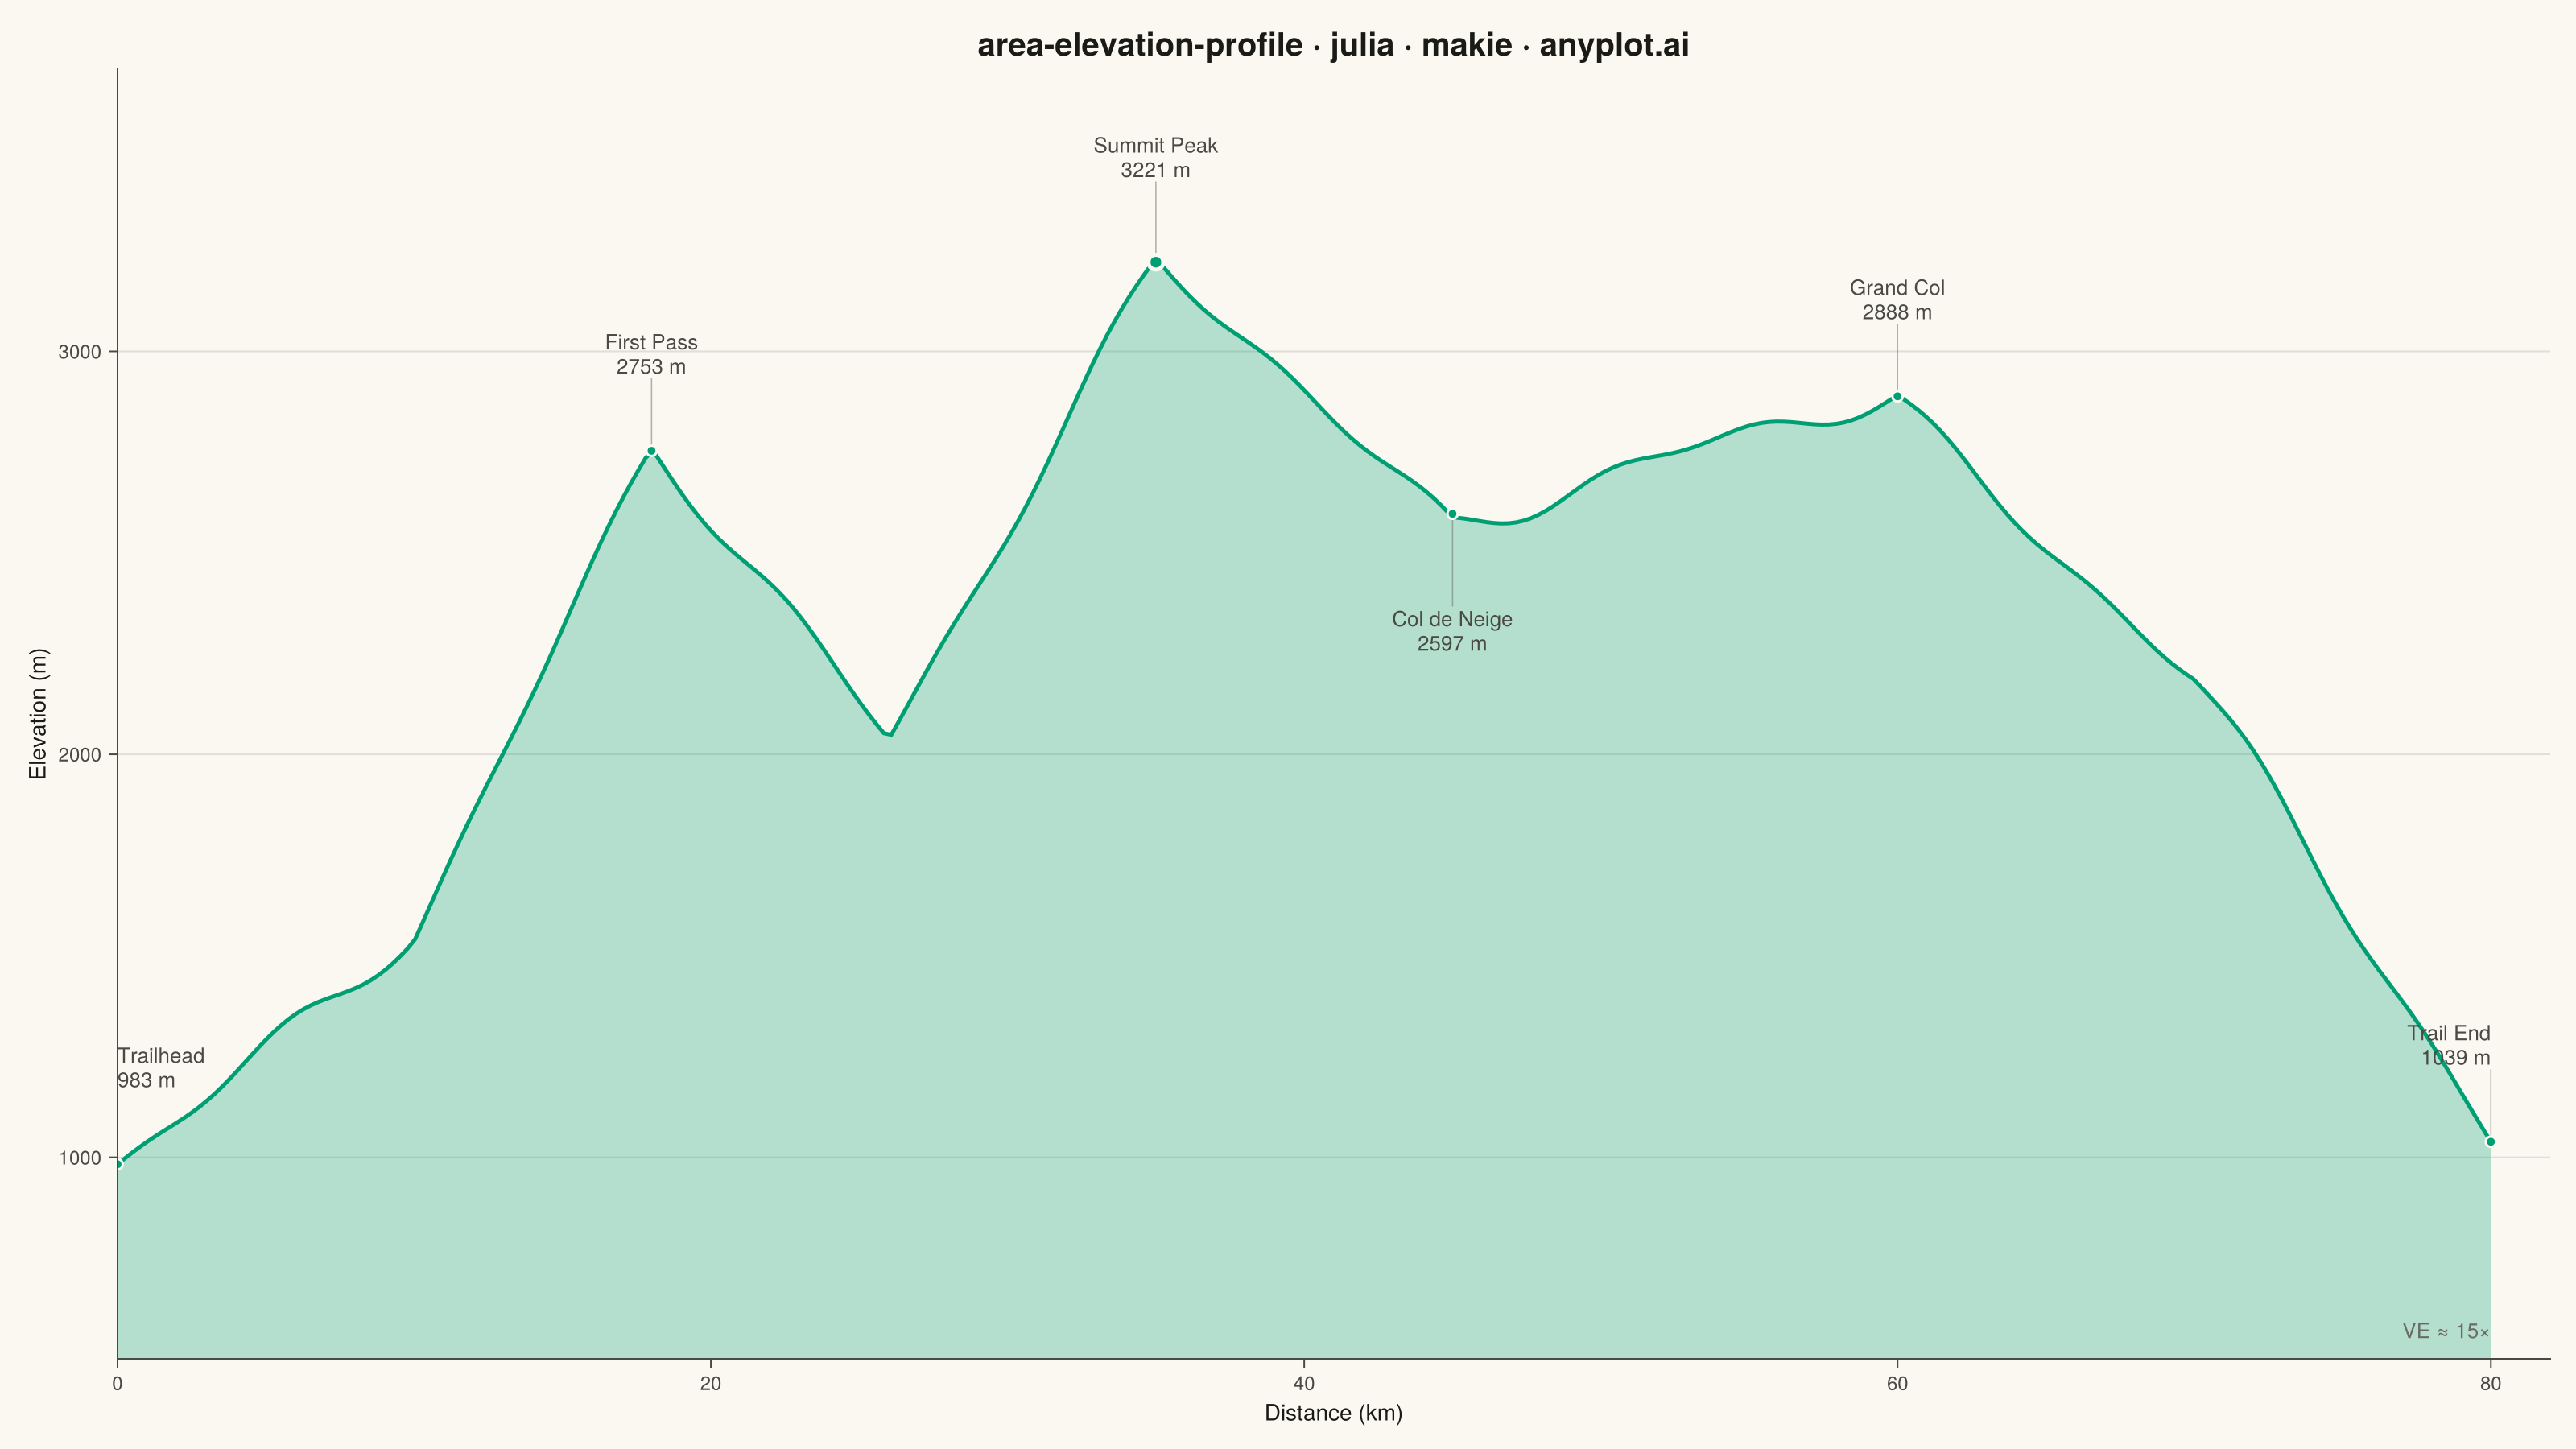
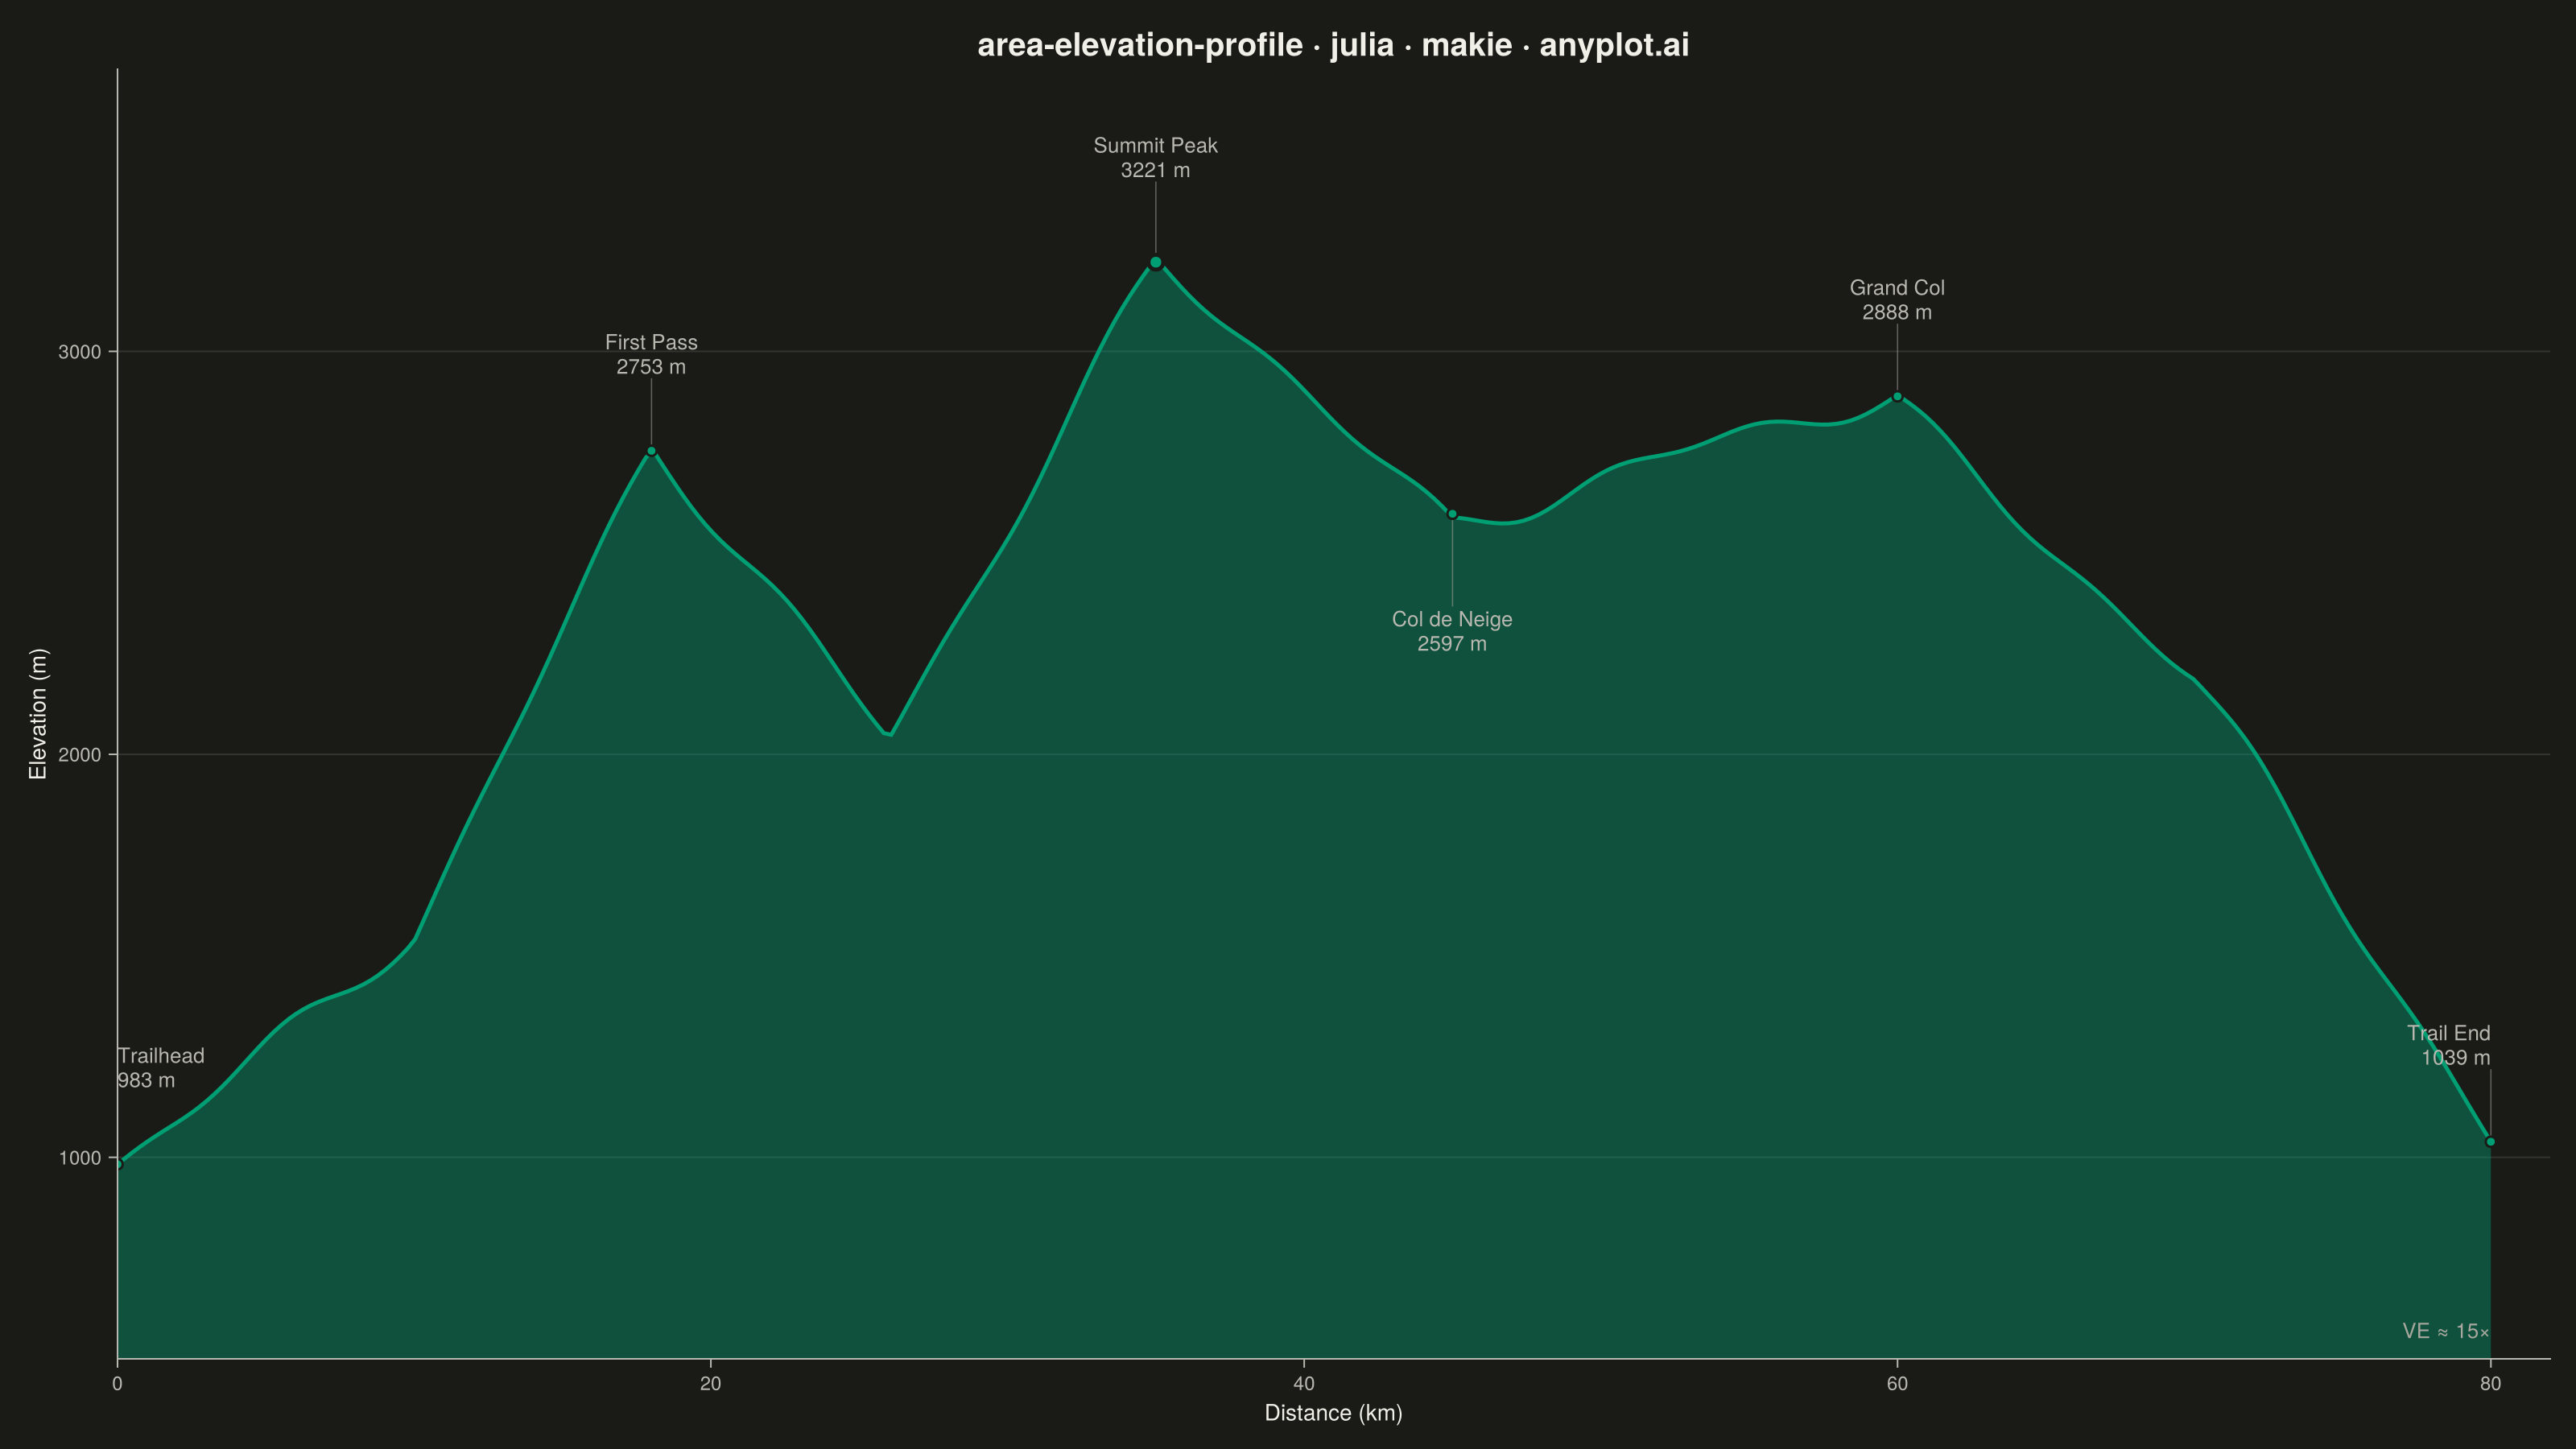
A cross-sectional line plot showing ground elevation along a path or transect line, with the area below the profile filled to create a terrain silhouette. Distance along the transect is plotted on the x-axis and elevation on the y-axis. This visualization is widely used in hiking and cycling route planning, civil engineering corridor design, and geomorphology to convey terrain shape and difficulty at a glance.
# anyplot.ai
# area-elevation-profile: Terrain Elevation Profile Along Transect
# Library: makie 0.22.10 | Julia 1.11.9
# Quality: 90/100 | Created: 2026-06-10

using CairoMakie
using Colors
using Random

Random.seed!(42)

# Theme tokens
const THEME       = get(ENV, "ANYPLOT_THEME", "light")
const PAGE_BG     = THEME == "light" ? colorant"#FAF8F1" : colorant"#1A1A17"
const ELEVATED_BG = THEME == "light" ? colorant"#FFFDF6" : colorant"#242420"
const INK         = THEME == "light" ? colorant"#1A1A17" : colorant"#F0EFE8"
const INK_SOFT    = THEME == "light" ? colorant"#4A4A44" : colorant"#B8B7B0"
const INK_MUTED   = THEME == "light" ? colorant"#6B6A63" : colorant"#A8A79F"
const FILL_ALPHA  = THEME == "light" ? 0.28f0 : 0.42f0

const IMPRINT_PALETTE = [
    colorant"#009E73",  # 1 — brand green (first series, always)
    colorant"#C475FD",  # 2 — lavender
    colorant"#4467A3",  # 3 — blue
    colorant"#BD8233",  # 4 — ochre
    colorant"#AE3030",  # 5 — matte red (semantic: bad/loss)
    colorant"#2ABCCD",  # 6 — cyan
    colorant"#954477",  # 7 — rose
    colorant"#99B314",  # 8 — lime
]

# Data: Fictional alpine traverse — 80 km route across passes and summits
wp_dist = [  0.0,  10.0,  18.0,  26.0,  35.0,  45.0,  60.0,  70.0,  80.0]
wp_elev = [950.0, 1600.0, 2750.0, 2050.0, 3180.0, 2600.0, 2900.0, 2150.0, 1050.0]

n = 320
distance = collect(range(0.0, 80.0, length=n))

function lerp_elev(d)
    for i in 2:length(wp_dist)
        if d <= wp_dist[i]
            t = (d - wp_dist[i-1]) / (wp_dist[i] - wp_dist[i-1])
            return wp_elev[i-1] + t * (wp_elev[i] - wp_elev[i-1])
        end
    end
    return wp_elev[end]
end

elev_base = lerp_elev.(distance)

function gauss_smooth(v, sigma)
    nv = length(v)
    ks = round(Int, 3 * sigma)
    result = similar(v, Float64)
    for i in 1:nv
        s = 0.0; w = 0.0
        for j in max(1, i - ks):min(nv, i + ks)
            wj = exp(-0.5 * ((j - i) / sigma)^2)
            s += wj * v[j]; w += wj
        end
        result[i] = s / w
    end
    return result
end

# Terrain micro-texture via superimposed sinusoids (no cumulative drift)
terrain_noise = zeros(n)
for freq in [4, 9, 17, 29]
    terrain_noise .+= randn() .* sin.(range(0.0, Float64(freq) * π, length=n) .+ rand() * 2π)
end
terrain_noise = gauss_smooth(terrain_noise, 3.0) .* 28.0

elevation = elev_base .+ terrain_noise

# Key landmarks — pairs of (distance_km, label)
lm_dists   = [  0.0,       18.0,          35.0,          45.0,          60.0,       80.0]
lm_labels  = ["Trailhead", "First Pass", "Summit Peak", "Col de Neige", "Grand Col", "Trail End"]
lm_idx     = [argmin(abs.(distance .- d)) for d in lm_dists]
lm_elevs   = elevation[lm_idx]
lm_offsets = [180.0, 180.0, 200.0, -230.0, 180.0, 180.0]
lm_valigns = [:bottom, :bottom, :bottom, :top, :bottom, :bottom]
lm_haligns = [:left,   :center, :center,  :center,        :center,     :right  ]

const TITLE = "area-elevation-profile · julia · makie · anyplot.ai"
title_fontsize = 20  # 51 chars < 67 baseline — no scaling needed

# Figure
fig = Figure(
    size            = (1600, 900),
    fontsize        = 14,
    backgroundcolor = PAGE_BG,
)

ax = Axis(
    fig[1, 1];
    title              = TITLE,
    titlesize          = title_fontsize,
    titlecolor         = INK,
    xlabel             = "Distance (km)",
    ylabel             = "Elevation (m)",
    xlabelsize         = 14,
    ylabelsize         = 14,
    xlabelcolor        = INK,
    ylabelcolor        = INK,
    xticklabelsize     = 12,
    yticklabelsize     = 12,
    xticklabelcolor    = INK_SOFT,
    yticklabelcolor    = INK_SOFT,
    xtickcolor         = INK_SOFT,
    ytickcolor         = INK_SOFT,
    backgroundcolor    = PAGE_BG,
    topspinevisible    = false,
    rightspinevisible  = false,
    leftspinecolor     = INK_SOFT,
    bottomspinecolor   = INK_SOFT,
    xgridvisible       = false,
    ygridcolor         = RGBAf(INK.r, INK.g, INK.b, 0.12),
    yminorgridvisible  = false,
    xminorgridvisible  = false,
    limits             = (0.0, 82.0, 500.0, 3700.0),
)

# Filled terrain silhouette (Imprint brand green; alpha higher on dark for equal visual weight)
band!(ax, distance, fill(500.0, n), elevation;
      color = RGBAf(IMPRINT_PALETTE[1].r, IMPRINT_PALETTE[1].g, IMPRINT_PALETTE[1].b, FILL_ALPHA))

# Profile line
lines!(ax, distance, elevation;
       color = IMPRINT_PALETTE[1], linewidth = 2.5)

# Landmark annotations — Summit Peak gets extra emphasis as the highest point
for i in 1:length(lm_dists)
    d    = lm_dists[i]
    name = lm_labels[i]
    elev = lm_elevs[i]
    off  = lm_offsets[i]
    va   = lm_valigns[i]

    is_summit = (name == "Summit Peak")
    msize     = is_summit ? 13 : 9
    mstroke   = is_summit ? 2.5f0 : 1.5f0

    # Connector line from terrain point to label position
    lines!(ax, [d, d], [elev, elev + off];
           color = RGBAf(INK_MUTED.r, INK_MUTED.g, INK_MUTED.b, 0.5),
           linewidth = 0.8)

    # Dot marker at elevation (Summit Peak larger for focal hierarchy)
    scatter!(ax, [d], [elev];
             color = IMPRINT_PALETTE[1], markersize = msize,
             strokecolor = PAGE_BG, strokewidth = mstroke)

    # Label: name + elevation; 13 pt for mobile readability
    text!(ax, d, elev + off;
          text     = "$(name)\n$(round(Int, elev)) m",
          align    = (lm_haligns[i], va),
          fontsize = 13,
          color    = INK_SOFT)
end

# Vertical exaggeration note (bottom-right)
text!(ax, 80.0, 540.0;
      text     = "VE ≈ 15×",
      align    = (:right, :bottom),
      fontsize = 13,
      color    = INK_MUTED)

save("plot-$(THEME).png", fig; px_per_unit = 2)
Runnable source as JSON, for any HTTP client: https://api.anyplot.ai/specs/area-elevation-profile/makie/code. Any spec id and library id listed in llms-full.txt fit the same URL shape; every URL below is complete and callable.
{
  "spec_id": "area-elevation-profile",
  "language": "julia",
  "library": "makie",
  "page": "https://anyplot.ai/area-elevation-profile/julia/makie",
  "hub": "https://anyplot.ai/area-elevation-profile",
  "code_json": "https://api.anyplot.ai/specs/area-elevation-profile/makie/code",
  "spec_json": "https://api.anyplot.ai/specs/area-elevation-profile",
  "render_light_png": "https://storage.googleapis.com/anyplot-images/plots/area-elevation-profile/julia/makie/plot-light.png",
  "render_dark_png": "https://storage.googleapis.com/anyplot-images/plots/area-elevation-profile/julia/makie/plot-dark.png",
  "quality_score": 90.0,
  "license": "MIT",
  "guide": "https://anyplot.ai/llms.txt"
}
Part of Terrain Elevation Profile Along Transect on anyplot.ai.