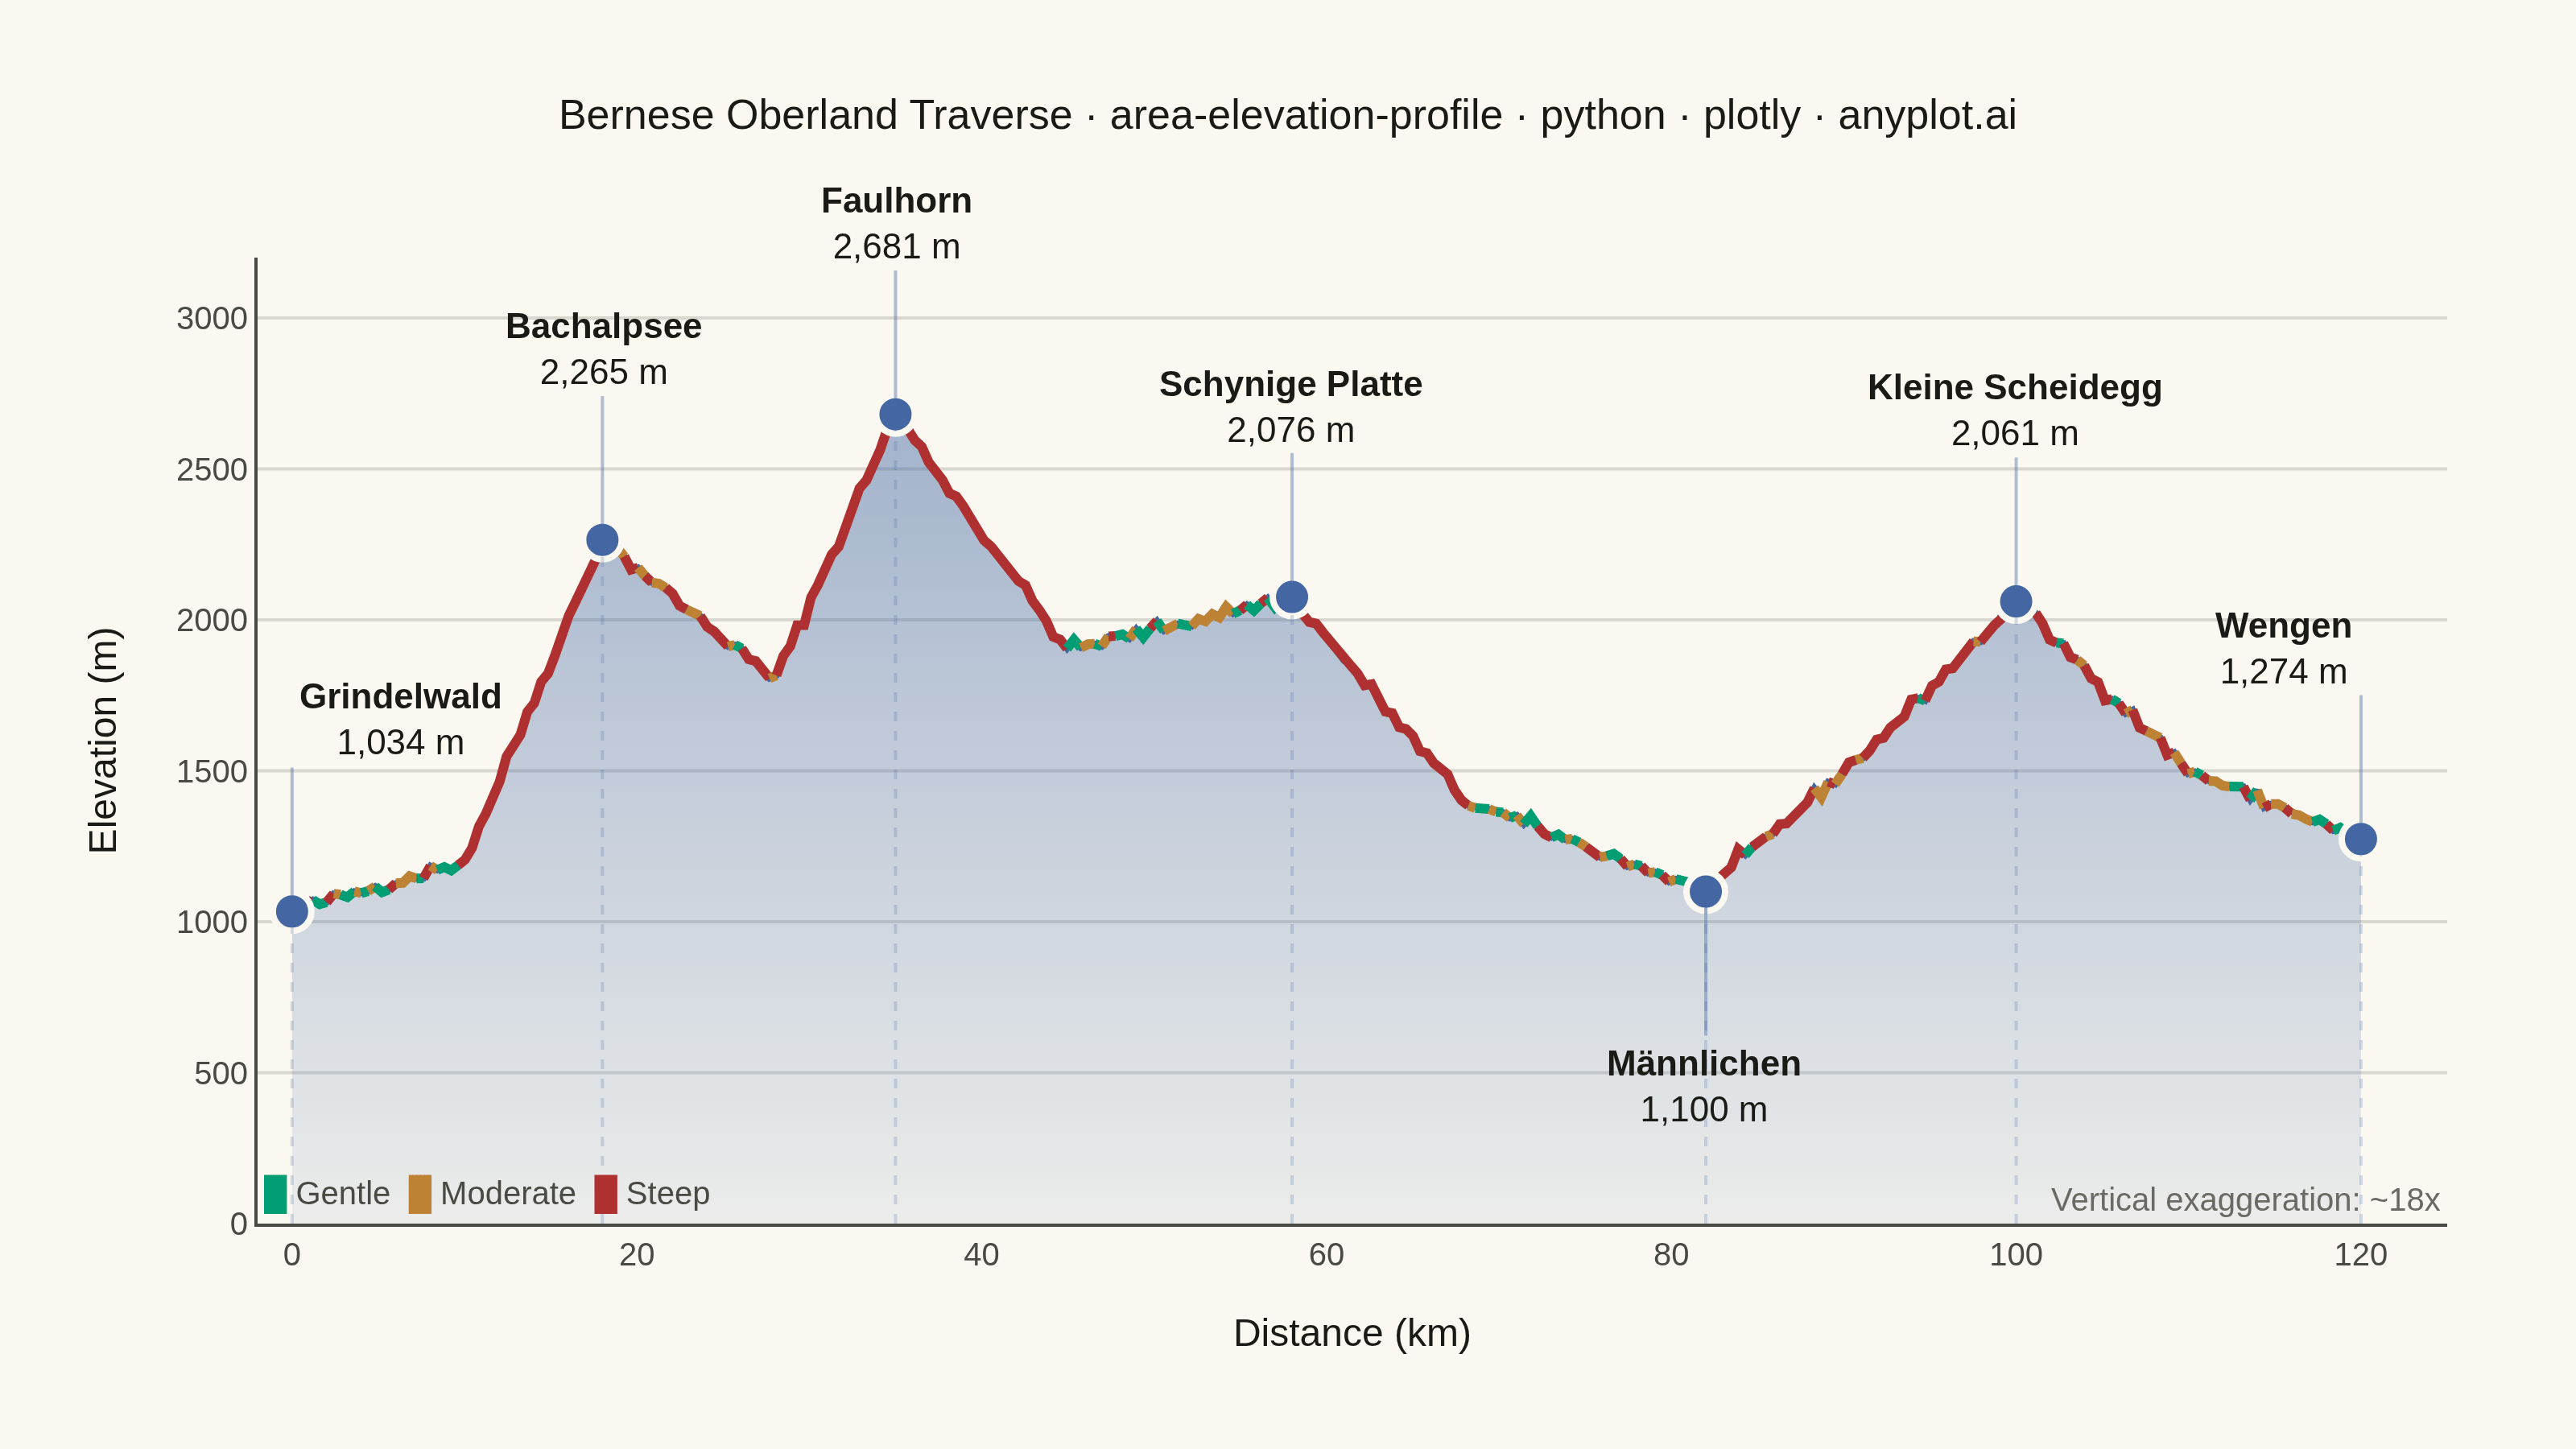
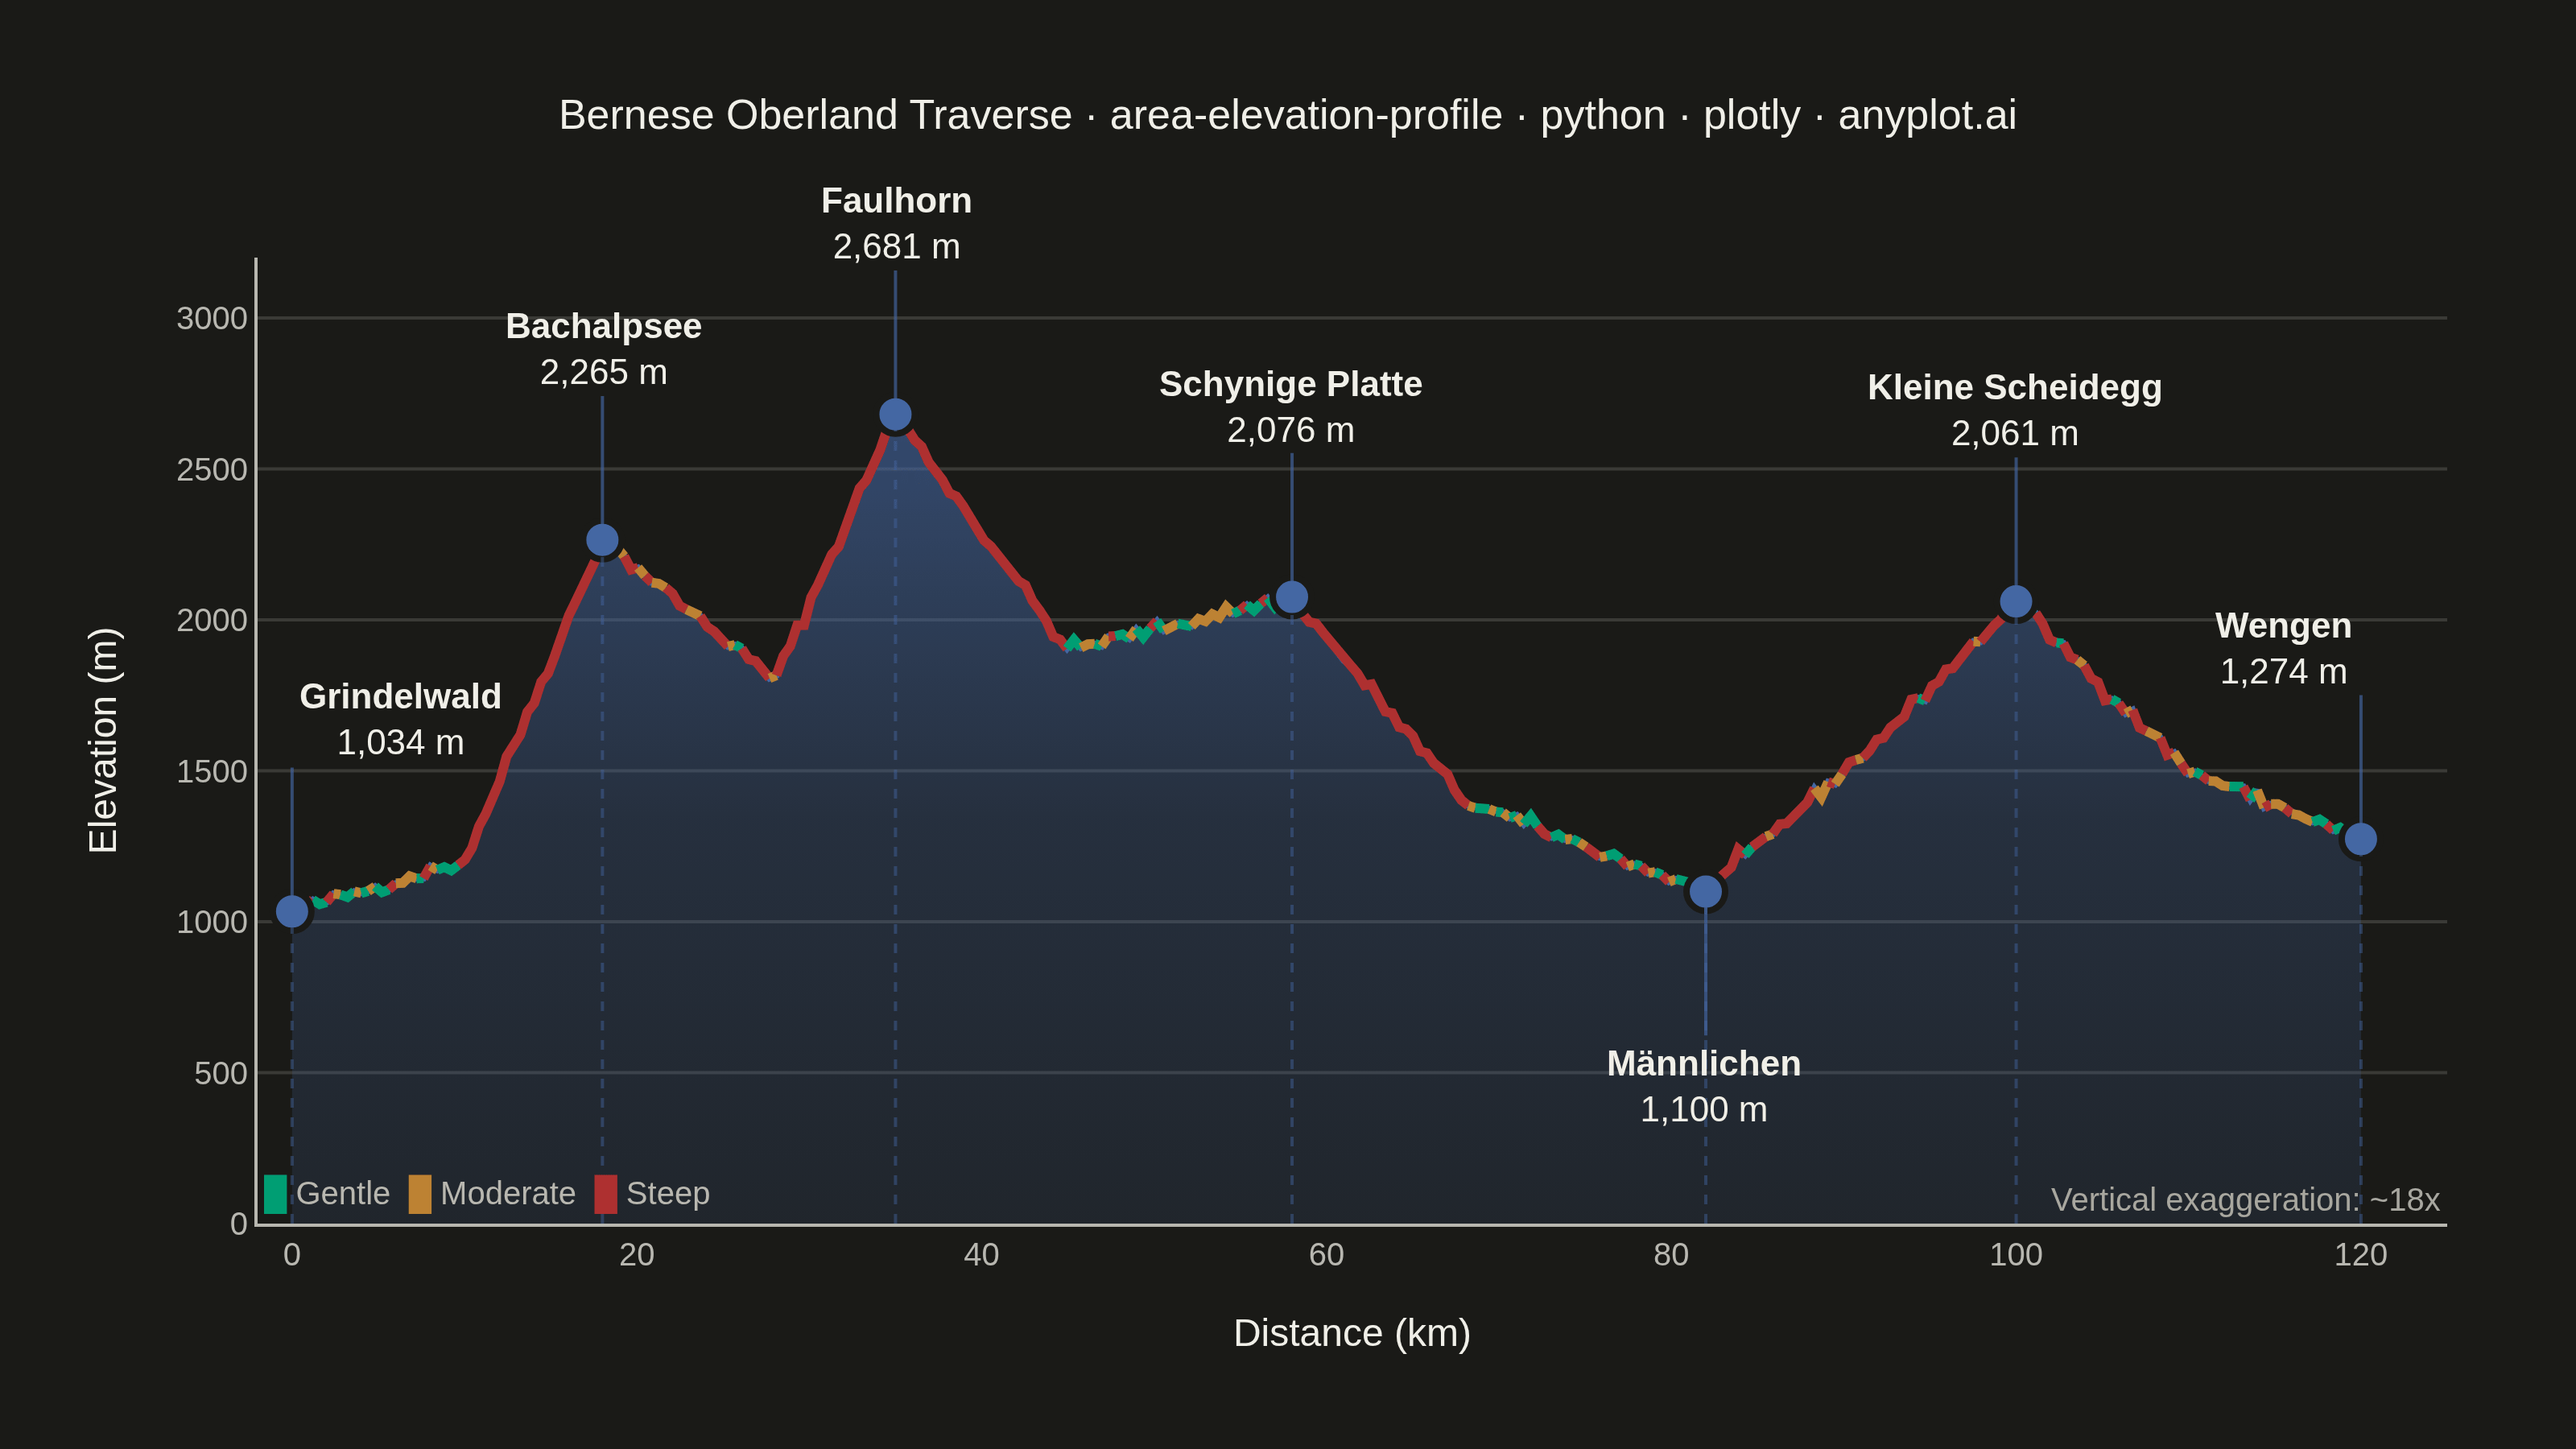
A cross-sectional line plot showing ground elevation along a path or transect line, with the area below the profile filled to create a terrain silhouette. Distance along the transect is plotted on the x-axis and elevation on the y-axis. This visualization is widely used in hiking and cycling route planning, civil engineering corridor design, and geomorphology to convey terrain shape and difficulty at a glance.
""" anyplot.ai
area-elevation-profile: Terrain Elevation Profile Along Transect
Library: plotly 6.8.0 | Python 3.13.13
Quality: 91/100 | Updated: 2026-06-10
"""

import os
import sys


# Remove script dir from sys.path so 'import plotly' resolves to the installed package
_sd = os.path.dirname(os.path.abspath(__file__))
sys.path = [p for p in sys.path if os.path.abspath(p or ".") != _sd]

import numpy as np
import plotly.graph_objects as go


# Theme tokens (Imprint palette — theme-adaptive chrome)
THEME = os.getenv("ANYPLOT_THEME", "light")
PAGE_BG = "#FAF8F1" if THEME == "light" else "#1A1A17"
ELEVATED_BG = "#FFFDF6" if THEME == "light" else "#242420"
INK = "#1A1A17" if THEME == "light" else "#F0EFE8"
INK_SOFT = "#4A4A44" if THEME == "light" else "#B8B7B0"
INK_MUTED = "#6B6A63" if THEME == "light" else "#A8A79F"
GRID = "rgba(26,26,23,0.15)" if THEME == "light" else "rgba(240,239,232,0.15)"

# Imprint categorical palette
IMPRINT_PALETTE = ["#009E73", "#C475FD", "#4467A3", "#BD8233", "#AE3030", "#2ABCCD", "#954477", "#99B314"]

# Data
np.random.seed(42)
distance = np.linspace(0, 120, 300)
keypoints_dist = [0, 10, 18, 28, 35, 45, 58, 68, 82, 92, 100, 110, 120]
keypoints_elev = [1034, 1200, 2265, 1800, 2681, 1900, 2076, 1400, 1100, 1600, 2061, 1500, 1274]
elevation = np.interp(distance, keypoints_dist, keypoints_elev)
elevation += np.random.normal(0, 12, len(distance))

# Slope categories
slope = np.gradient(elevation, distance)
abs_slope = np.abs(slope)
slope_labels = ["gentle" if s < 15 else "moderate" if s < 35 else "steep" for s in abs_slope]

# Slope palette — Imprint semantic: green=easy, ochre=moderate, red=steep/difficult
slope_palette = {
    "gentle": IMPRINT_PALETTE[0],  # #009E73 brand green
    "moderate": IMPRINT_PALETTE[3],  # #BD8233 ochre
    "steep": IMPRINT_PALETTE[4],  # #AE3030 matte red
}

landmarks = [
    {"name": "Grindelwald", "distance": 0.0, "elevation": 1034},
    {"name": "Bachalpsee", "distance": 18.0, "elevation": 2265},
    {"name": "Faulhorn", "distance": 35.0, "elevation": 2681},
    {"name": "Schynige Platte", "distance": 58.0, "elevation": 2076},
    {"name": "Männlichen", "distance": 82.0, "elevation": 1100},
    {"name": "Kleine Scheidegg", "distance": 100.0, "elevation": 2061},
    {"name": "Wengen", "distance": 120.0, "elevation": 1274},
]

# Vertical exaggeration (inner plot area ~680 × 300 at this layout)
plot_h_px, plot_w_px = 300, 680
x_range_m = 127 * 1000
y_range_m = 3200
vert_exag_display = round((x_range_m / plot_w_px) / (y_range_m / plot_h_px))

# Theme-adaptive fill opacities for terrain silhouette
fill_bot = 0.08 if THEME == "light" else 0.15
fill_top = 0.48 if THEME == "light" else 0.62
arrow_color = "rgba(68, 103, 163, 0.40)" if THEME == "light" else "rgba(68, 103, 163, 0.65)"
ref_line_color = "rgba(68, 103, 163, 0.22)" if THEME == "light" else "rgba(68, 103, 163, 0.45)"

# Plot
fig = go.Figure()

# Terrain fill with vertical gradient — Imprint blue #4467A3 = rgb(68, 103, 163)
fig.add_trace(
    go.Scatter(
        x=distance,
        y=elevation,
        fill="tozeroy",
        fillgradient={
            "type": "vertical",
            "colorscale": [
                [0.0, f"rgba(68, 103, 163, {fill_bot})"],
                [0.5, "rgba(68, 103, 163, 0.28)"],
                [1.0, f"rgba(68, 103, 163, {fill_top})"],
            ],
        },
        line={"color": IMPRINT_PALETTE[2], "width": 2},
        mode="lines",
        name="Elevation",
        hovertemplate="Distance: %{x:.1f} km<br>Elevation: %{y:.0f} m<extra></extra>",
    )
)

# Slope-colored line overlay — group consecutive same-category segments
i = 0
while i < len(distance) - 1:
    label = slope_labels[i]
    j = i + 1
    while j < len(distance) - 1 and slope_labels[j] == label:
        j += 1
    fig.add_trace(
        go.Scatter(
            x=distance[i : j + 1],
            y=elevation[i : j + 1],
            mode="lines",
            line={"color": slope_palette[label], "width": 3},
            showlegend=False,
            hoverinfo="skip",
        )
    )
    i = j

# Landmark circle markers
fig.add_trace(
    go.Scatter(
        x=[lm["distance"] for lm in landmarks],
        y=[lm["elevation"] for lm in landmarks],
        mode="markers",
        marker={"size": 12, "color": IMPRINT_PALETTE[2], "line": {"color": PAGE_BG, "width": 2}, "symbol": "circle"},
        showlegend=False,
        hovertemplate="%{text}<br>Distance: %{x:.1f} km<br>Elevation: %{y:.0f} m<extra></extra>",
        text=[lm["name"] for lm in landmarks],
    )
)

# Annotations and vertical reference lines
offsets_y = [50, 50, 50, 50, -50, 50, 50]
arrow_ay = [-40, -40, -40, -40, 40, -40, -40]
anchors_y = ["bottom", "bottom", "bottom", "bottom", "top", "bottom", "bottom"]
anchors_x = ["left", "center", "center", "center", "center", "center", "right"]
annotations = []

for idx, lm in enumerate(landmarks):
    fig.add_shape(
        type="line",
        x0=lm["distance"],
        x1=lm["distance"],
        y0=0,
        y1=lm["elevation"],
        line={"color": ref_line_color, "width": 1, "dash": "dot"},
    )
    annotations.append(
        {
            "x": lm["distance"],
            "y": lm["elevation"] + offsets_y[idx],
            "text": f"<b>{lm['name']}</b><br>{lm['elevation']:,} m",
            "showarrow": True,
            "arrowhead": 0,
            "arrowwidth": 1,
            "arrowcolor": arrow_color,
            "ax": 0,
            "ay": arrow_ay[idx],
            "font": {"size": 11, "color": INK},
            "align": "center",
            "xanchor": anchors_x[idx],
            "yanchor": anchors_y[idx],
        }
    )

# Vertical exaggeration note
annotations.append(
    {
        "x": 1.0,
        "y": 0.0,
        "xref": "paper",
        "yref": "paper",
        "text": f"Vertical exaggeration: ~{vert_exag_display}x",
        "showarrow": False,
        "font": {"size": 10, "color": INK_MUTED},
        "xanchor": "right",
        "yanchor": "bottom",
    }
)

# Slope legend
annotations.append(
    {
        "x": 0.0,
        "y": 0.0,
        "xref": "paper",
        "yref": "paper",
        "text": (
            f'<span style="color:{slope_palette["gentle"]}">█</span> Gentle  '
            f'<span style="color:{slope_palette["moderate"]}">█</span> Moderate  '
            f'<span style="color:{slope_palette["steep"]}">█</span> Steep'
        ),
        "showarrow": False,
        "font": {"size": 10, "color": INK_SOFT},
        "xanchor": "left",
        "yanchor": "bottom",
    }
)

# Title font size scaled to title length (floor: 11px per plotly guide)
title = "Bernese Oberland Traverse · area-elevation-profile · python · plotly · anyplot.ai"
title_fontsize = max(11, round(16 * 67 / len(title)))

# Style
fig.update_layout(
    autosize=False,
    title={"text": title, "font": {"size": title_fontsize, "color": INK}, "x": 0.5, "xanchor": "center"},
    xaxis={
        "title": {"text": "Distance (km)", "font": {"size": 12, "color": INK}},
        "tickfont": {"size": 10, "color": INK_SOFT},
        "range": [-2, 125],
        "showgrid": False,
        "zeroline": False,
        "linecolor": INK_SOFT,
        "ticks": "",
    },
    yaxis={
        "title": {"text": "Elevation (m)", "font": {"size": 12, "color": INK}},
        "tickfont": {"size": 10, "color": INK_SOFT},
        "range": [0, 3200],
        "gridcolor": GRID,
        "gridwidth": 1,
        "zeroline": False,
        "linecolor": INK_SOFT,
        "ticks": "",
    },
    paper_bgcolor=PAGE_BG,
    plot_bgcolor=PAGE_BG,
    font={"color": INK},
    showlegend=False,
    annotations=annotations,
    margin={"l": 80, "r": 40, "t": 80, "b": 70},
    template="plotly_white",
)

# Save (3200 × 1800 landscape canvas)
fig.write_image(f"plot-{THEME}.png", width=800, height=450, scale=4)
fig.write_html(f"plot-{THEME}.html", include_plotlyjs="cdn")
Runnable source as JSON, for any HTTP client: https://api.anyplot.ai/specs/area-elevation-profile/plotly/code. Any spec id and library id listed in llms-full.txt fit the same URL shape; every URL below is complete and callable.
{
  "spec_id": "area-elevation-profile",
  "language": "python",
  "library": "plotly",
  "page": "https://anyplot.ai/area-elevation-profile/python/plotly",
  "hub": "https://anyplot.ai/area-elevation-profile",
  "code_json": "https://api.anyplot.ai/specs/area-elevation-profile/plotly/code",
  "spec_json": "https://api.anyplot.ai/specs/area-elevation-profile",
  "render_light_png": "https://storage.googleapis.com/anyplot-images/plots/area-elevation-profile/python/plotly/plot-light.png",
  "render_dark_png": "https://storage.googleapis.com/anyplot-images/plots/area-elevation-profile/python/plotly/plot-dark.png",
  "interactive_light_html": "https://storage.googleapis.com/anyplot-images/plots/area-elevation-profile/python/plotly/plot-light.html",
  "interactive_dark_html": "https://storage.googleapis.com/anyplot-images/plots/area-elevation-profile/python/plotly/plot-dark.html",
  "quality_score": 91.0,
  "license": "MIT",
  "guide": "https://anyplot.ai/llms.txt"
}
Part of Terrain Elevation Profile Along Transect on anyplot.ai.