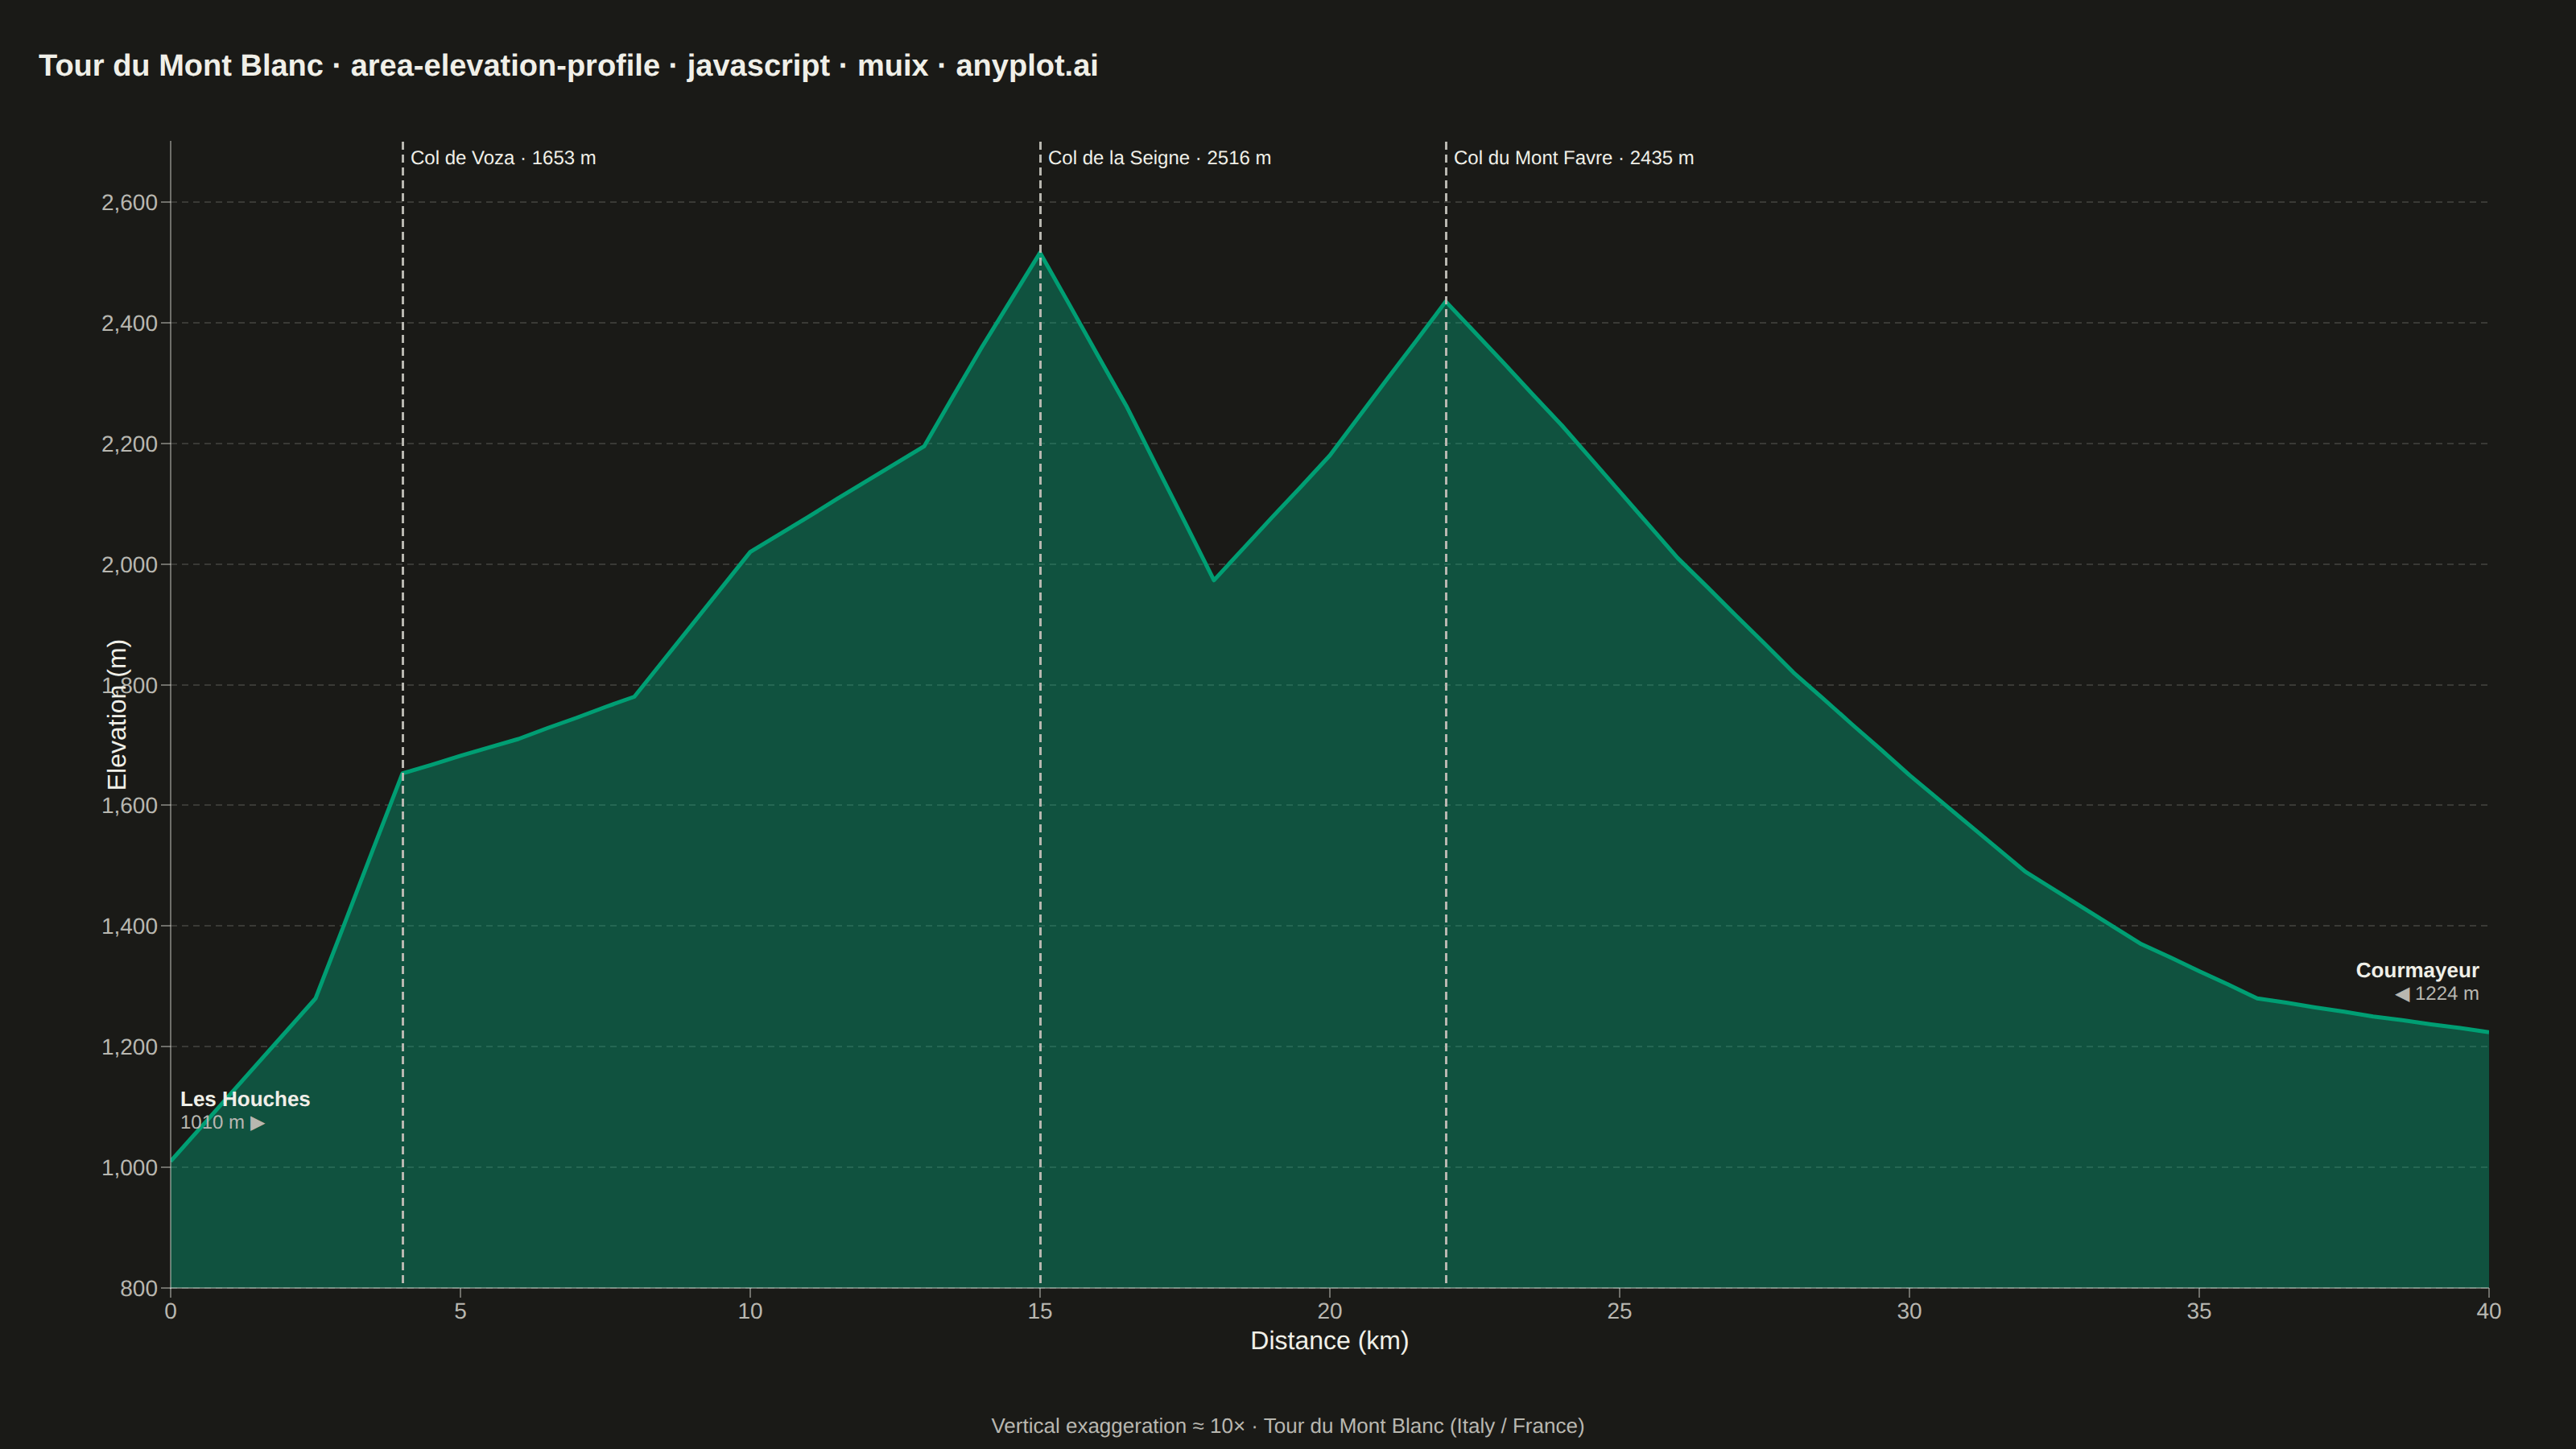
The same plot in 14 other libraries — JavaScript: Chart.js, D3.js, Apache ECharts, Highcharts; Python: Altair, Bokeh, lets-plot, Matplotlib, Plotly, plotnine, Pygal, Seaborn; R: ggplot2; Julia: Makie.jl. Compare all 15 side by side: Terrain Elevation Profile Along Transect in Python, R, Julia and JavaScript.
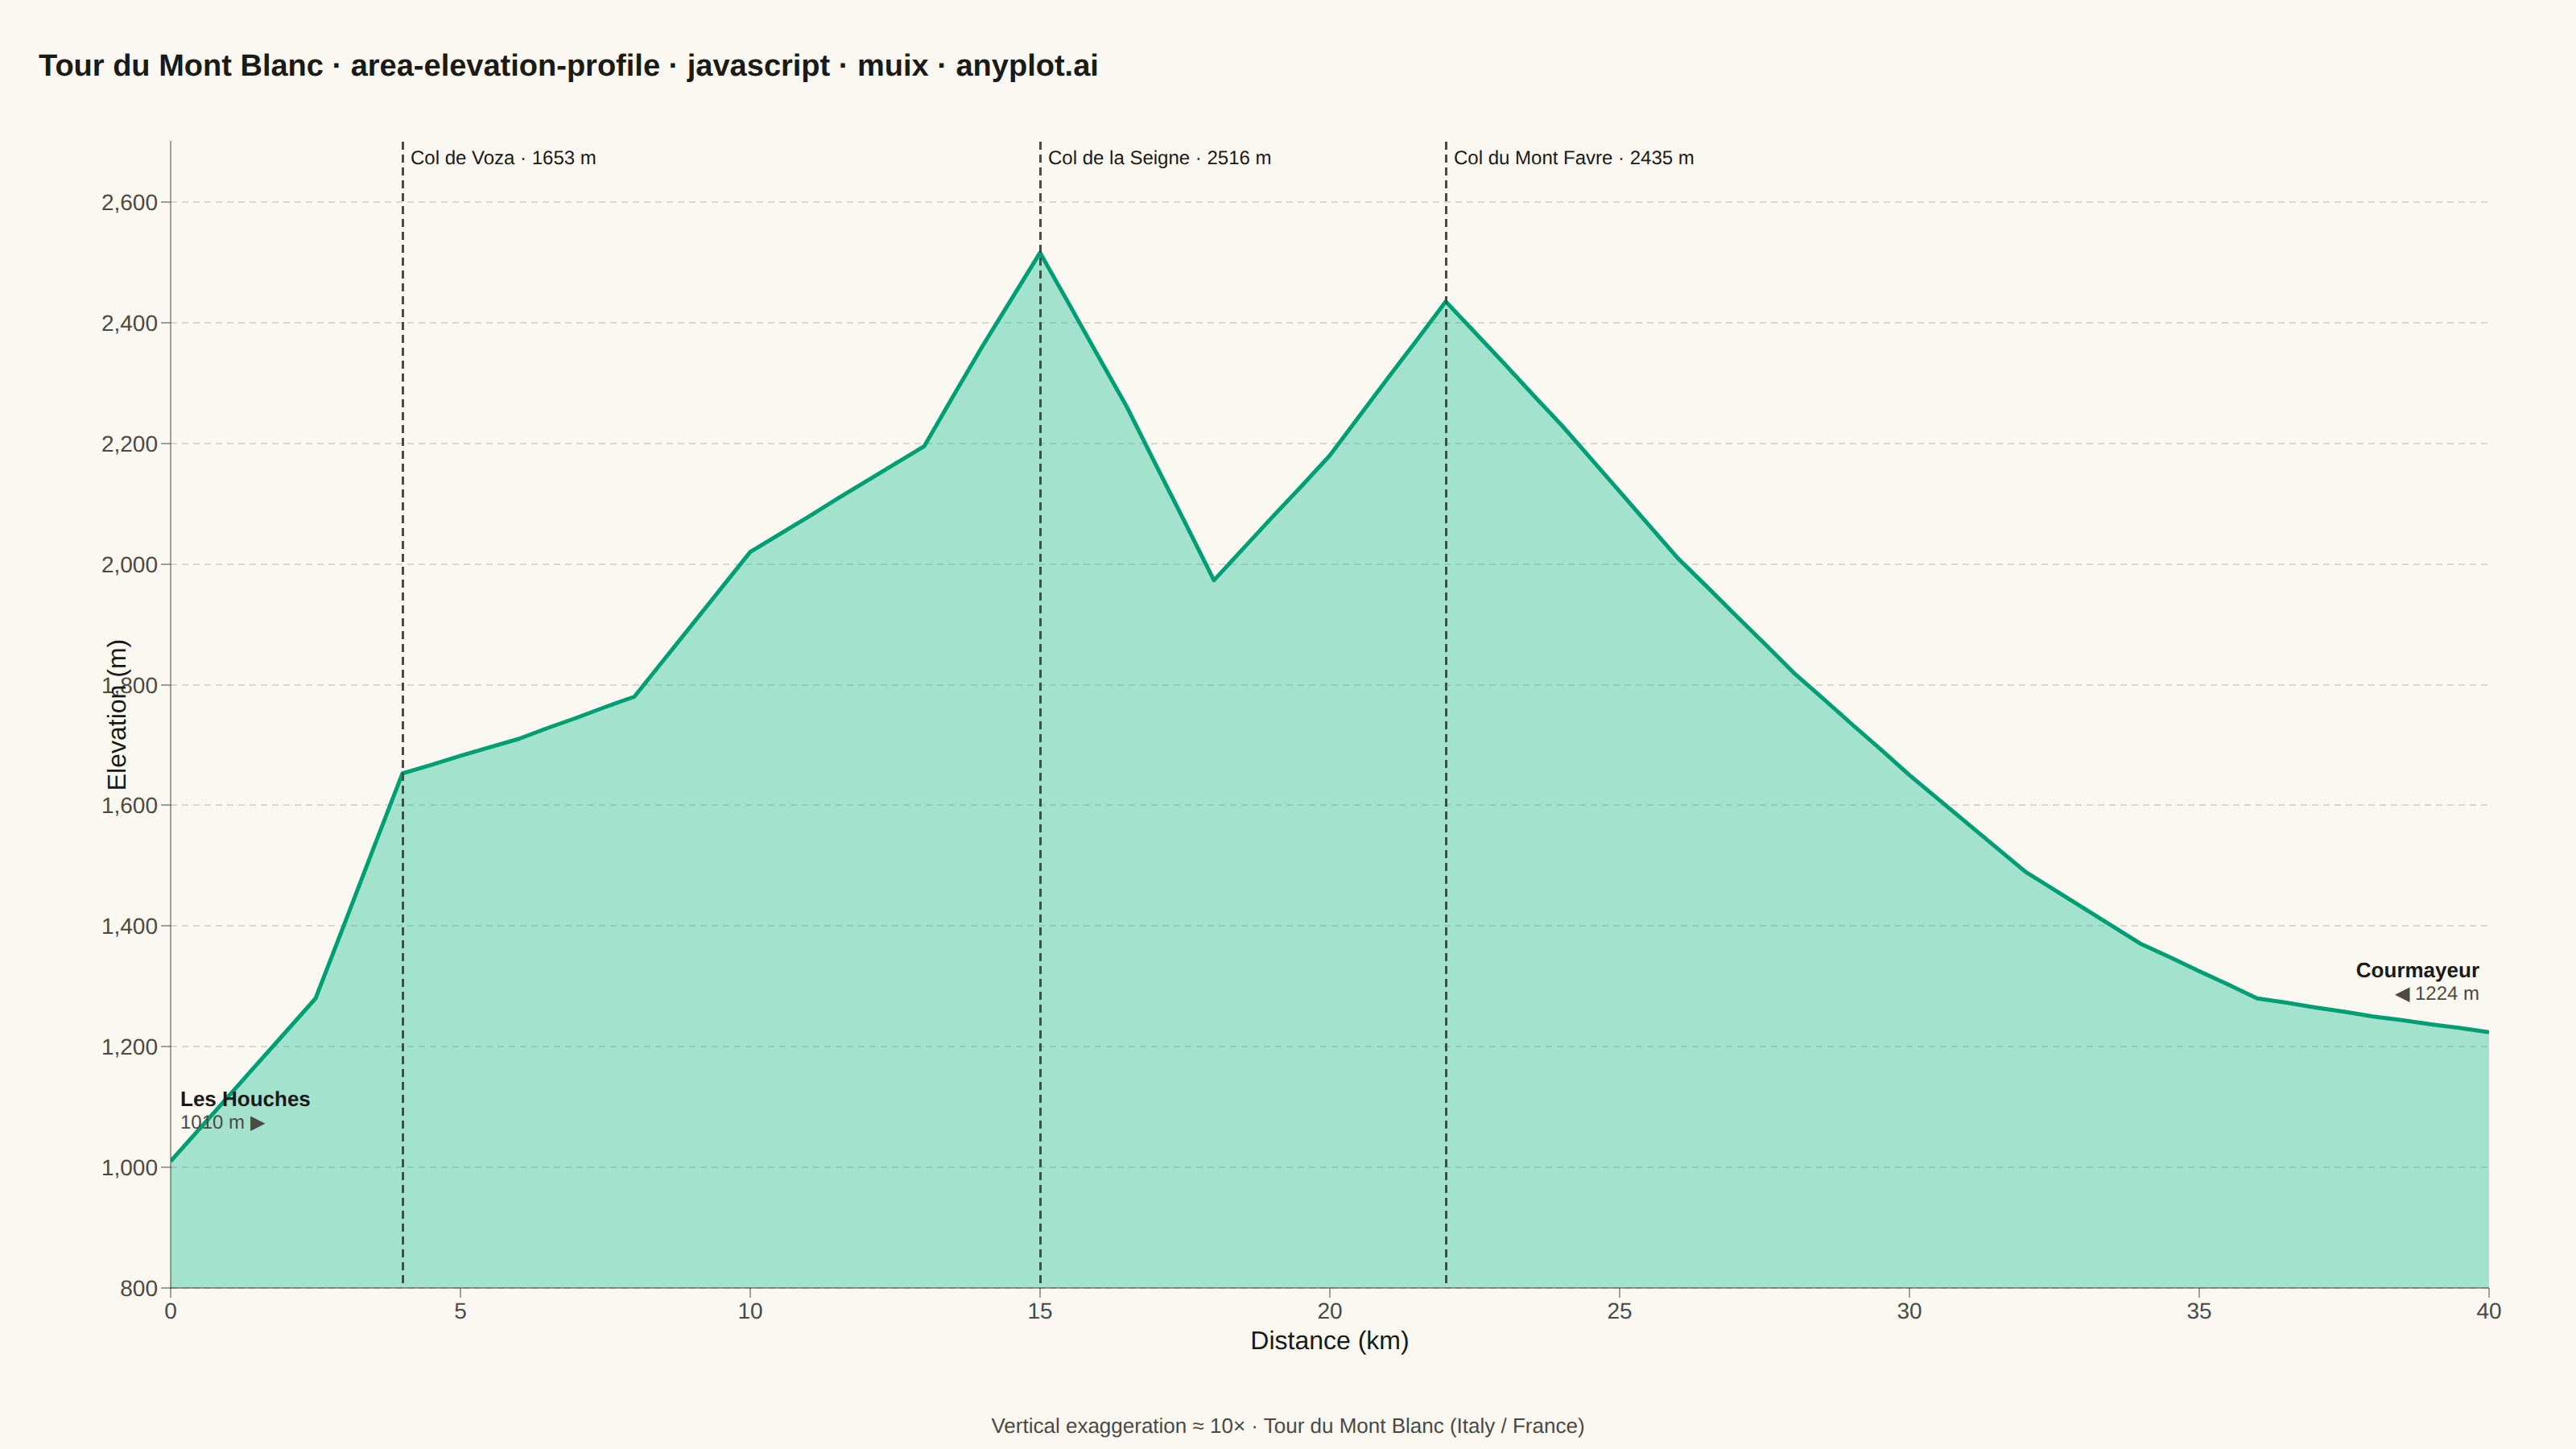
A cross-sectional line plot showing ground elevation along a path or transect line, with the area below the profile filled to create a terrain silhouette. Distance along the transect is plotted on the x-axis and elevation on the y-axis. This visualization is widely used in hiking and cycling route planning, civil engineering corridor design, and geomorphology to convey terrain shape and difficulty at a glance.
// anyplot.ai
// area-elevation-profile: Terrain Elevation Profile Along Transect
// Library: muix 7.29.1 | JavaScript 22.22.3
// Quality: 90/100 | Created: 2026-06-10
//# anyplot-orientation: landscape

import { LineChart } from "@mui/x-charts/LineChart";
import { ChartsReferenceLine } from "@mui/x-charts/ChartsReferenceLine";

const t = window.ANYPLOT_TOKENS;

// Tour du Mont Blanc — Alpine hiking segment, 40 km
// 81 elevation samples at 500 m intervals (deterministic, no RNG)
function lerp(a, b, f) {
  return Math.round(a + (b - a) * Math.max(0, Math.min(1, f)));
}

// Control points [km, m]: key terrain waypoints along the route
const ctrl = [
  [0, 1010], [2.5, 1280], [4, 1653], [6, 1710], [8, 1780],
  [10, 2020], [13, 2195], [14, 2360], [15, 2516], [16.5, 2260],
  [18, 1973], [20, 2180], [22, 2435], [24, 2230], [26, 2010],
  [28, 1820], [30, 1650], [32, 1490], [34, 1370], [36, 1280],
  [38, 1250], [40, 1224],
];

const distKm = [];
const elevM = [];
for (let i = 0; i <= 80; i++) {
  const d = i * 0.5;
  distKm.push(d);
  let j = 0;
  while (j < ctrl.length - 2 && ctrl[j + 1][0] <= d) j++;
  const [d0, e0] = ctrl[j];
  const [d1, e1] = ctrl[j + 1];
  elevM.push(lerp(e0, e1, (d - d0) / (d1 - d0)));
}

// Notable landmarks: mountain passes along the route
const landmarks = [
  { x: 4,  elev: 1653, label: "Col de Voza" },
  { x: 15, elev: 2516, label: "Col de la Seigne" },
  { x: 22, elev: 2435, label: "Col du Mont Favre" },
];

const TITLE = "Tour du Mont Blanc · area-elevation-profile · javascript · muix · anyplot.ai";
const TITLE_FS = Math.max(16, Math.round(22 * 67 / TITLE.length));

// Chart coordinate space constants — shared by LineChart and overlay labels
const Y_MIN = 800;
const Y_MAX = 2700;
const X_MIN = 0;
const X_MAX = 40;
const MARGIN = { top: 20, right: 30, bottom: 72, left: 82 };

function toPixel(dx, dy, chartW, chartH) {
  const pw = chartW - MARGIN.left - MARGIN.right;
  const ph = chartH - MARGIN.top - MARGIN.bottom;
  return {
    left: MARGIN.left + ((dx - X_MIN) / (X_MAX - X_MIN)) * pw,
    top:  MARGIN.top  + (1 - (dy - Y_MIN) / (Y_MAX - Y_MIN)) * ph,
  };
}

export default function Chart() {
  const W = window.ANYPLOT_SIZE.width;
  const H = window.ANYPLOT_SIZE.height;

  const PAD_TOP  = 16;
  const HEADER_H = 52;
  const FOOTER_H = 28;
  const PAD_H    = 48;
  const chartW   = W - PAD_H;
  const chartH   = H - PAD_TOP - HEADER_H - FOOTER_H;

  const startPx = toPixel(X_MIN, 1010, chartW, chartH);
  const endPx   = toPixel(X_MAX, 1224, chartW, chartH);

  return (
    <div style={{
      width:           W,
      height:          H,
      backgroundColor: t.pageBg,
      display:         "flex",
      flexDirection:   "column",
      padding:         `${PAD_TOP}px 24px 0`,
      boxSizing:       "border-box",
      fontFamily:      "sans-serif",
    }}>
      {/* Chart title */}
      <div style={{
        color:       t.ink,
        fontSize:    TITLE_FS,
        fontWeight:  600,
        lineHeight:  `${HEADER_H}px`,
        flexShrink:  0,
        whiteSpace:  "nowrap",
        overflow:    "hidden",
        textOverflow:"ellipsis",
      }}>
        {TITLE}
      </div>

      {/* Elevation profile chart with start/end overlay labels */}
      <div style={{ position: "relative", width: chartW, height: chartH, flexShrink: 0 }}>
        <LineChart
          width={chartW}
          height={chartH}
          margin={MARGIN}
          skipAnimation
          grid={{ horizontal: true }}
          xAxis={[{
            data:           distKm,
            label:          "Distance (km)",
            min:            X_MIN,
            max:            X_MAX,
            tickMinStep:    5,
            tickLabelStyle: { fontSize: 14, fill: t.inkSoft },
            labelStyle:     { fontSize: 16, fill: t.ink },
          }]}
          yAxis={[{
            label:          "Elevation (m)",
            min:            Y_MIN,
            max:            Y_MAX,
            tickMinStep:    200,
            tickLabelStyle: { fontSize: 14, fill: t.inkSoft },
            labelStyle:     { fontSize: 16, fill: t.ink },
          }]}
          series={[{
            data:      elevM,
            area:      true,
            showMark:  false,
            color:     t.palette[0],
            curve:     "linear",
          }]}
          sx={{
            "& .MuiAreaElement-root": { fillOpacity: 0.35 },
            "& .MuiLineElement-root": { strokeWidth: 2.5 },
            "& .MuiChartsGrid-line":  { stroke: t.grid, strokeDasharray: "4 3" },
            "& .MuiChartsAxis-line":  { stroke: t.inkSoft, strokeOpacity: 0.4 },
            "& .MuiChartsAxis-tick":  { stroke: t.inkSoft, strokeOpacity: 0.4 },
          }}
        >
          {landmarks.map(lm => (
            <ChartsReferenceLine
              key={lm.x}
              x={lm.x}
              label={`${lm.label} · ${lm.elev} m`}
              labelAlign="start"
              lineStyle={{ stroke: t.inkSoft, strokeDasharray: "5 3", strokeWidth: 1.5 }}
              labelStyle={{ fontSize: 12, fill: t.ink }}
            />
          ))}
        </LineChart>

        {/* Start point: Les Houches */}
        <div style={{
          position:      "absolute",
          left:           startPx.left + 6,
          top:            startPx.top - 46,
          pointerEvents: "none",
          fontFamily:    "sans-serif",
        }}>
          <div style={{ color: t.ink,     fontSize: 13, fontWeight: 700 }}>Les Houches</div>
          <div style={{ color: t.inkSoft, fontSize: 12 }}>1010 m  ▶</div>
        </div>

        {/* End point: Courmayeur */}
        <div style={{
          position:      "absolute",
          left:           endPx.left - 6,
          top:            endPx.top - 46,
          transform:     "translateX(-100%)",
          textAlign:     "right",
          pointerEvents: "none",
          fontFamily:    "sans-serif",
        }}>
          <div style={{ color: t.ink,     fontSize: 13, fontWeight: 700 }}>Courmayeur</div>
          <div style={{ color: t.inkSoft, fontSize: 12 }}>◀  1224 m</div>
        </div>
      </div>

      {/* Footer: vertical exaggeration note */}
      <div style={{
        color:       t.inkSoft,
        fontSize:    13,
        textAlign:   "center",
        lineHeight:  `${FOOTER_H}px`,
        flexShrink:  0,
        fontFamily:  "sans-serif",
      }}>
        Vertical exaggeration ≈ 10× · Tour du Mont Blanc (Italy / France)
      </div>
    </div>
  );
}
Runnable source as JSON, for any HTTP client: https://api.anyplot.ai/specs/area-elevation-profile/muix/code. Any spec id and library id listed in llms-full.txt fit the same URL shape; every URL below is complete and callable.
{
  "spec_id": "area-elevation-profile",
  "language": "javascript",
  "library": "muix",
  "page": "https://anyplot.ai/area-elevation-profile/javascript/muix",
  "hub": "https://anyplot.ai/area-elevation-profile",
  "code_json": "https://api.anyplot.ai/specs/area-elevation-profile/muix/code",
  "spec_json": "https://api.anyplot.ai/specs/area-elevation-profile",
  "render_light_png": "https://storage.googleapis.com/anyplot-images/plots/area-elevation-profile/javascript/muix/plot-light.png",
  "render_dark_png": "https://storage.googleapis.com/anyplot-images/plots/area-elevation-profile/javascript/muix/plot-dark.png",
  "interactive_light_html": "https://storage.googleapis.com/anyplot-images/plots/area-elevation-profile/javascript/muix/plot-light.html",
  "interactive_dark_html": "https://storage.googleapis.com/anyplot-images/plots/area-elevation-profile/javascript/muix/plot-dark.html",
  "quality_score": 90.0,
  "license": "MIT",
  "guide": "https://anyplot.ai/llms.txt"
}
Part of Terrain Elevation Profile Along Transect on anyplot.ai.