The same plot in 14 other libraries — JavaScript: Chart.js, D3.js, Highcharts, MUI X Charts; Python: Altair, Bokeh, lets-plot, Matplotlib, Plotly, plotnine, Pygal, Seaborn; R: ggplot2; Julia: Makie.jl. Compare all 15 side by side: Terrain Elevation Profile Along Transect in Python, R, Julia and JavaScript.
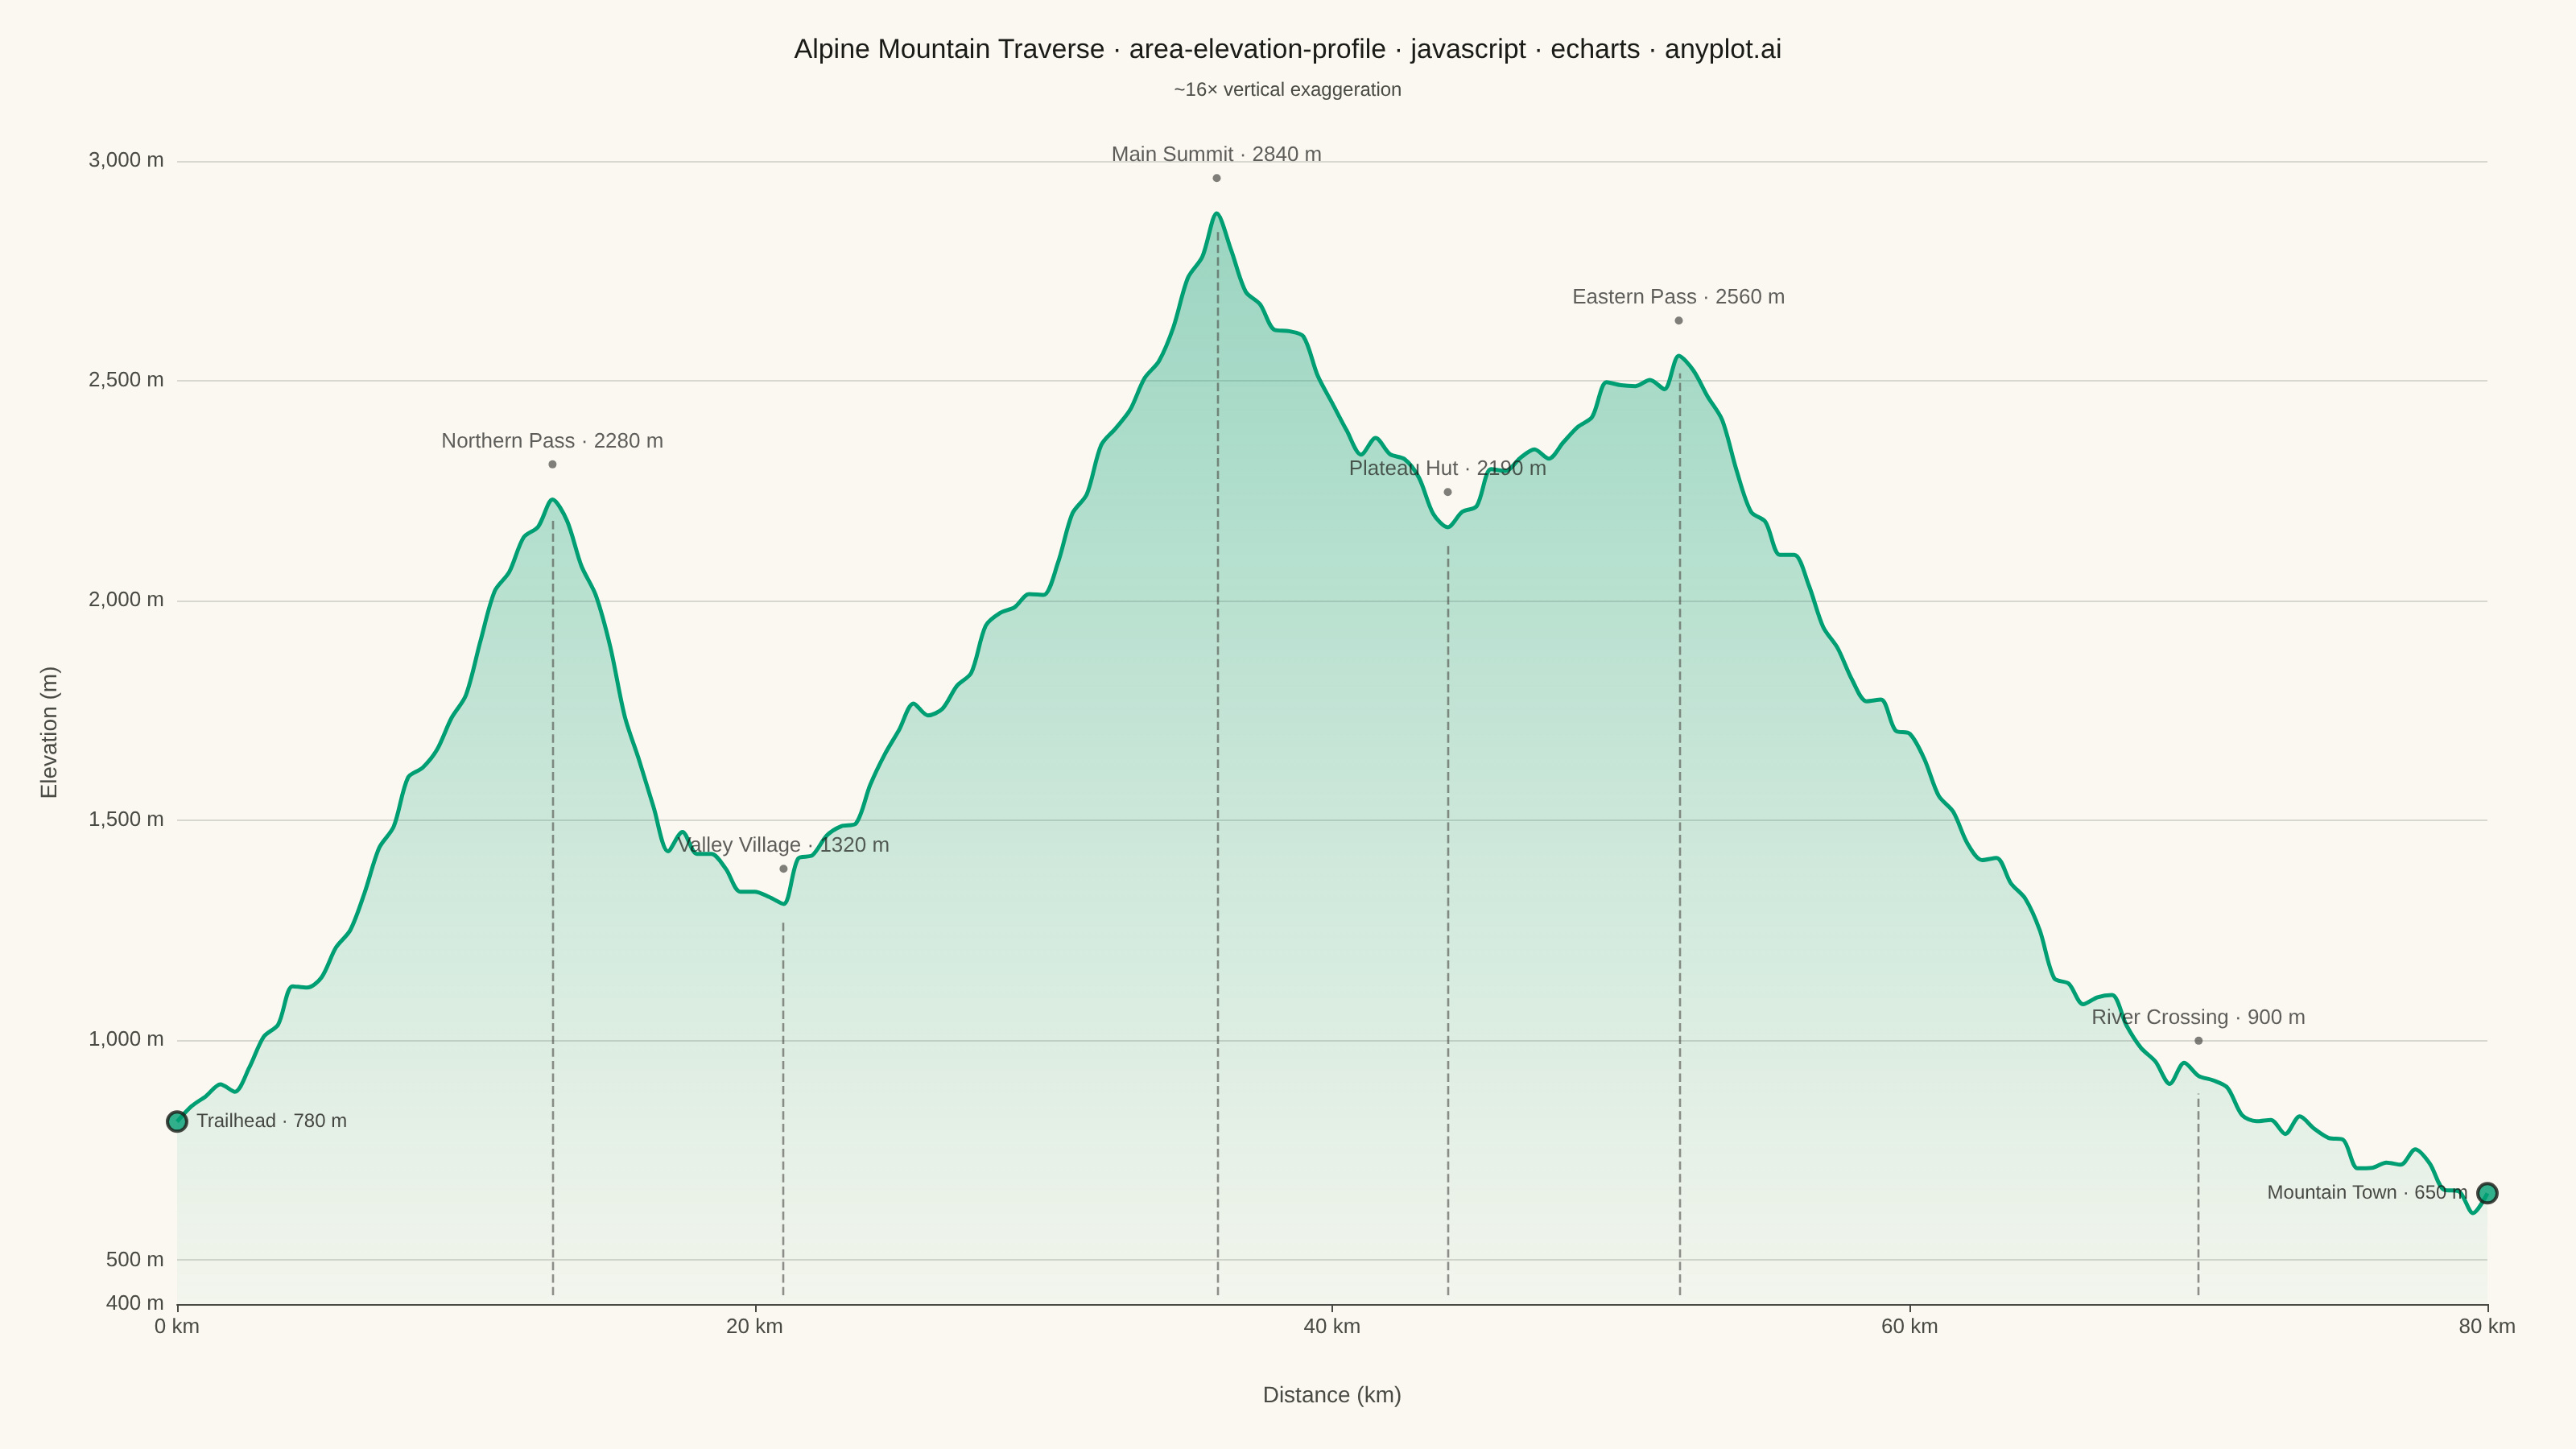
A cross-sectional line plot showing ground elevation along a path or transect line, with the area below the profile filled to create a terrain silhouette. Distance along the transect is plotted on the x-axis and elevation on the y-axis. This visualization is widely used in hiking and cycling route planning, civil engineering corridor design, and geomorphology to convey terrain shape and difficulty at a glance.
// anyplot.ai
// area-elevation-profile: Terrain Elevation Profile Along Transect
// Library: echarts 5.5.1 | JavaScript 22.22.3
// Quality: 88/100 | Created: 2026-06-10

//# anyplot-orientation: landscape

const t = window.ANYPLOT_TOKENS;

// --- Data -------------------------------------------------------------------
// Control points [distance_km, elevation_m] — deterministic Alpine traverse
const ctrl = [
  [0, 780], [5, 1150], [10, 1820], [13, 2280], [17, 1450],
  [21, 1320], [25, 1680], [30, 2050], [36, 2840], [40, 2450],
  [44, 2190], [48, 2380], [52, 2560], [57, 1940], [62, 1480],
  [66, 1100], [70, 900],  [74, 780],  [80, 650]
];

// 161 profile points at 0.5 km intervals: linear interp + micro-terrain texture
const profileData = [];
for (let i = 0; i <= 160; i++) {
  const d = i * 0.5;
  let base = ctrl[ctrl.length - 1][1];
  for (let j = 0; j < ctrl.length - 1; j++) {
    if (d >= ctrl[j][0] && d <= ctrl[j + 1][0]) {
      const frac = (d - ctrl[j][0]) / (ctrl[j + 1][0] - ctrl[j][0]);
      base = ctrl[j][1] + frac * (ctrl[j + 1][1] - ctrl[j][1]);
      break;
    }
  }
  // Superimposed sinusoids add deterministic micro-terrain texture
  const tex = 32 * Math.sin(d * 1.8 + 0.4) + 18 * Math.sin(d * 4.7 + 1.1)
            +  9 * Math.sin(d * 10.3 + 2.3) +  5 * Math.sin(d * 19.1);
  profileData.push([d, Math.round(base + tex)]);
}

// Key landmarks along the traverse
const landmarks = [
  { name: 'Northern Pass · 2280 m',  dist: 13 },
  { name: 'Valley Village · 1320 m', dist: 21 },
  { name: 'Main Summit · 2840 m',    dist: 36 },
  { name: 'Plateau Hut · 2190 m',    dist: 44 },
  { name: 'Eastern Pass · 2560 m',   dist: 52 },
  { name: 'River Crossing · 900 m',  dist: 70 },
];

// --- Init -------------------------------------------------------------------
const chart = echarts.init(document.getElementById('container'));

// Terrain silhouette fill — Imprint green fading to transparent
const areaFill = {
  type: 'linear', x: 0, y: 0, x2: 0, y2: 1,
  colorStops: [
    { offset: 0, color: 'rgba(0,158,115,0.55)' },
    { offset: 1, color: 'rgba(0,158,115,0.04)' }
  ]
};

// Scale title font for long string (default 22 px, floor 13 px)
const titleStr = 'Alpine Mountain Traverse · area-elevation-profile · javascript · echarts · anyplot.ai';
const titleSize = Math.max(13, Math.round(22 * 67 / titleStr.length));

// --- Option -----------------------------------------------------------------
chart.setOption({
  animation: false,
  color: t.palette,
  backgroundColor: 'transparent',

  title: {
    text: titleStr,
    subtext: '~16× vertical exaggeration',
    subtextStyle: { color: t.inkSoft, fontSize: 12 },
    left: 'center',
    top: 18,
    textStyle: { color: t.ink, fontSize: titleSize, fontWeight: '500' }
  },

  grid: { left: 110, right: 55, top: 100, bottom: 90 },

  xAxis: {
    type: 'value',
    min: 0,
    max: 80,
    name: 'Distance (km)',
    nameLocation: 'middle',
    nameGap: 50,
    nameTextStyle: { color: t.inkSoft, fontSize: 14 },
    axisLabel: { color: t.inkSoft, fontSize: 13, formatter: '{value} km' },
    axisLine: { lineStyle: { color: t.inkSoft } },
    axisTick: { lineStyle: { color: t.inkSoft } },
    splitLine: { show: false }
  },

  yAxis: {
    type: 'value',
    min: 400,
    name: 'Elevation (m)',
    nameLocation: 'middle',
    nameGap: 72,
    nameTextStyle: { color: t.inkSoft, fontSize: 14 },
    axisLabel: { color: t.inkSoft, fontSize: 13, formatter: '{value} m' },
    axisLine: { show: false },
    axisTick: { show: false },
    splitLine: { lineStyle: { color: t.grid } }
  },

  series: [
    // Main elevation profile: filled terrain silhouette + annotated landmarks
    {
      type: 'line',
      data: profileData,
      smooth: 0.3,
      symbol: 'none',
      lineStyle: { color: t.palette[0], width: 2.5 },
      areaStyle: { color: areaFill },
      // Vertical dashed lines at landmark positions
      markLine: {
        silent: true,
        symbol: ['none', 'none'],
        lineStyle: { color: t.inkSoft, type: 'dashed', width: 1.3, opacity: 0.6 },
        label: { show: false },
        data: landmarks.map(lm => [
          { coord: [lm.dist, 420] },
          { coord: [lm.dist, profileData[Math.min(Math.round(lm.dist / 0.5), 160)][1] - 40] }
        ])
      }
    },
    // Landmark dots with labels above the profile line
    {
      type: 'scatter',
      data: landmarks.map(lm => ({
        name: lm.name,
        value: [lm.dist, profileData[Math.min(Math.round(lm.dist / 0.5), 160)][1] + 80]
      })),
      symbol: 'circle',
      symbolSize: 5,
      itemStyle: { color: t.inkSoft, opacity: 0.7 },
      label: {
        show: true,
        position: 'top',
        formatter: '{b}',
        color: t.ink,
        fontSize: 13
      },
      z: 10
    },
    // Trailhead start marker
    {
      type: 'scatter',
      data: [[0, profileData[0][1]]],
      symbol: 'circle',
      symbolSize: 12,
      itemStyle: { color: t.palette[0], borderColor: t.ink, borderWidth: 2 },
      label: {
        show: true,
        position: 'right',
        formatter: 'Trailhead · 780 m',
        color: t.ink,
        fontSize: 12
      },
      z: 10
    },
    // Mountain Town end marker
    {
      type: 'scatter',
      data: [[80, profileData[160][1]]],
      symbol: 'circle',
      symbolSize: 12,
      itemStyle: { color: t.palette[0], borderColor: t.ink, borderWidth: 2 },
      label: {
        show: true,
        position: 'left',
        formatter: 'Mountain Town · 650 m',
        color: t.ink,
        fontSize: 12
      },
      z: 10
    }
  ]
});
Runnable source as JSON, for any HTTP client: https://api.anyplot.ai/specs/area-elevation-profile/echarts/code. Any spec id and library id listed in llms-full.txt fit the same URL shape; every URL below is complete and callable.
{
  "spec_id": "area-elevation-profile",
  "language": "javascript",
  "library": "echarts",
  "page": "https://anyplot.ai/area-elevation-profile/javascript/echarts",
  "hub": "https://anyplot.ai/area-elevation-profile",
  "code_json": "https://api.anyplot.ai/specs/area-elevation-profile/echarts/code",
  "spec_json": "https://api.anyplot.ai/specs/area-elevation-profile",
  "render_light_png": "https://storage.googleapis.com/anyplot-images/plots/area-elevation-profile/javascript/echarts/plot-light.png",
  "render_dark_png": "https://storage.googleapis.com/anyplot-images/plots/area-elevation-profile/javascript/echarts/plot-dark.png",
  "interactive_light_html": "https://storage.googleapis.com/anyplot-images/plots/area-elevation-profile/javascript/echarts/plot-light.html",
  "interactive_dark_html": "https://storage.googleapis.com/anyplot-images/plots/area-elevation-profile/javascript/echarts/plot-dark.html",
  "quality_score": 88.0,
  "license": "MIT",
  "guide": "https://anyplot.ai/llms.txt"
}
Part of Terrain Elevation Profile Along Transect on anyplot.ai.