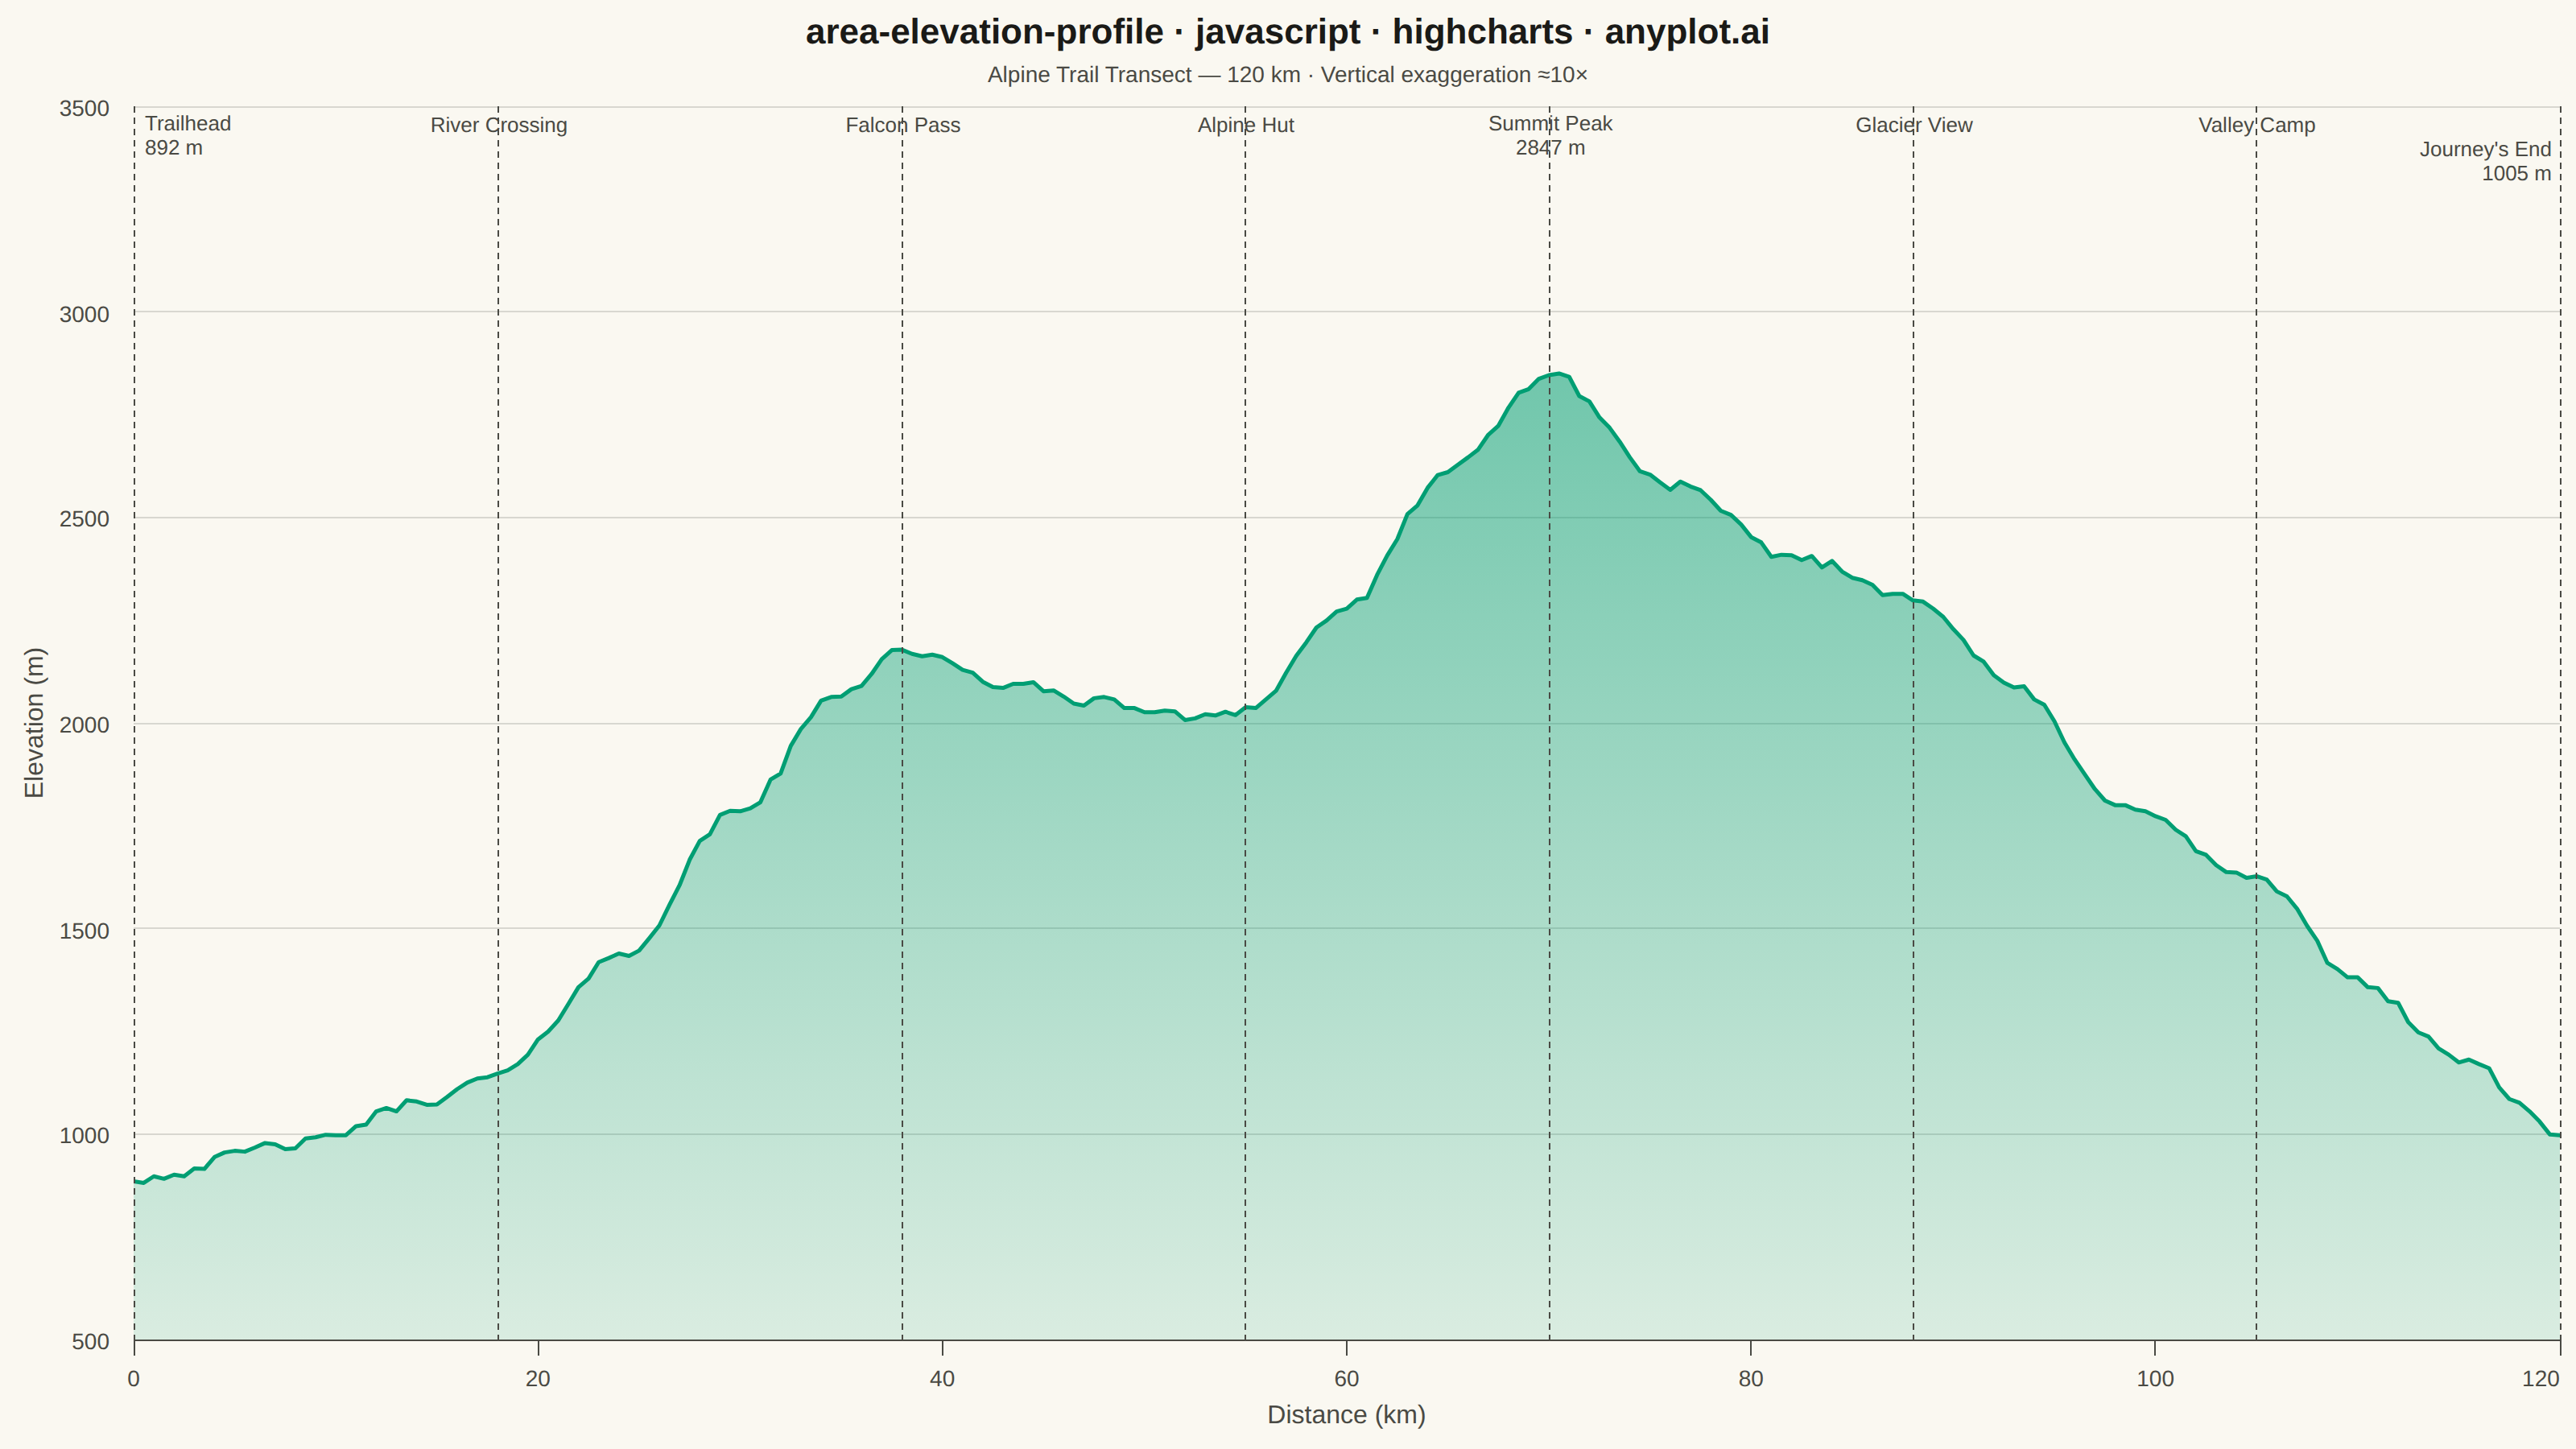
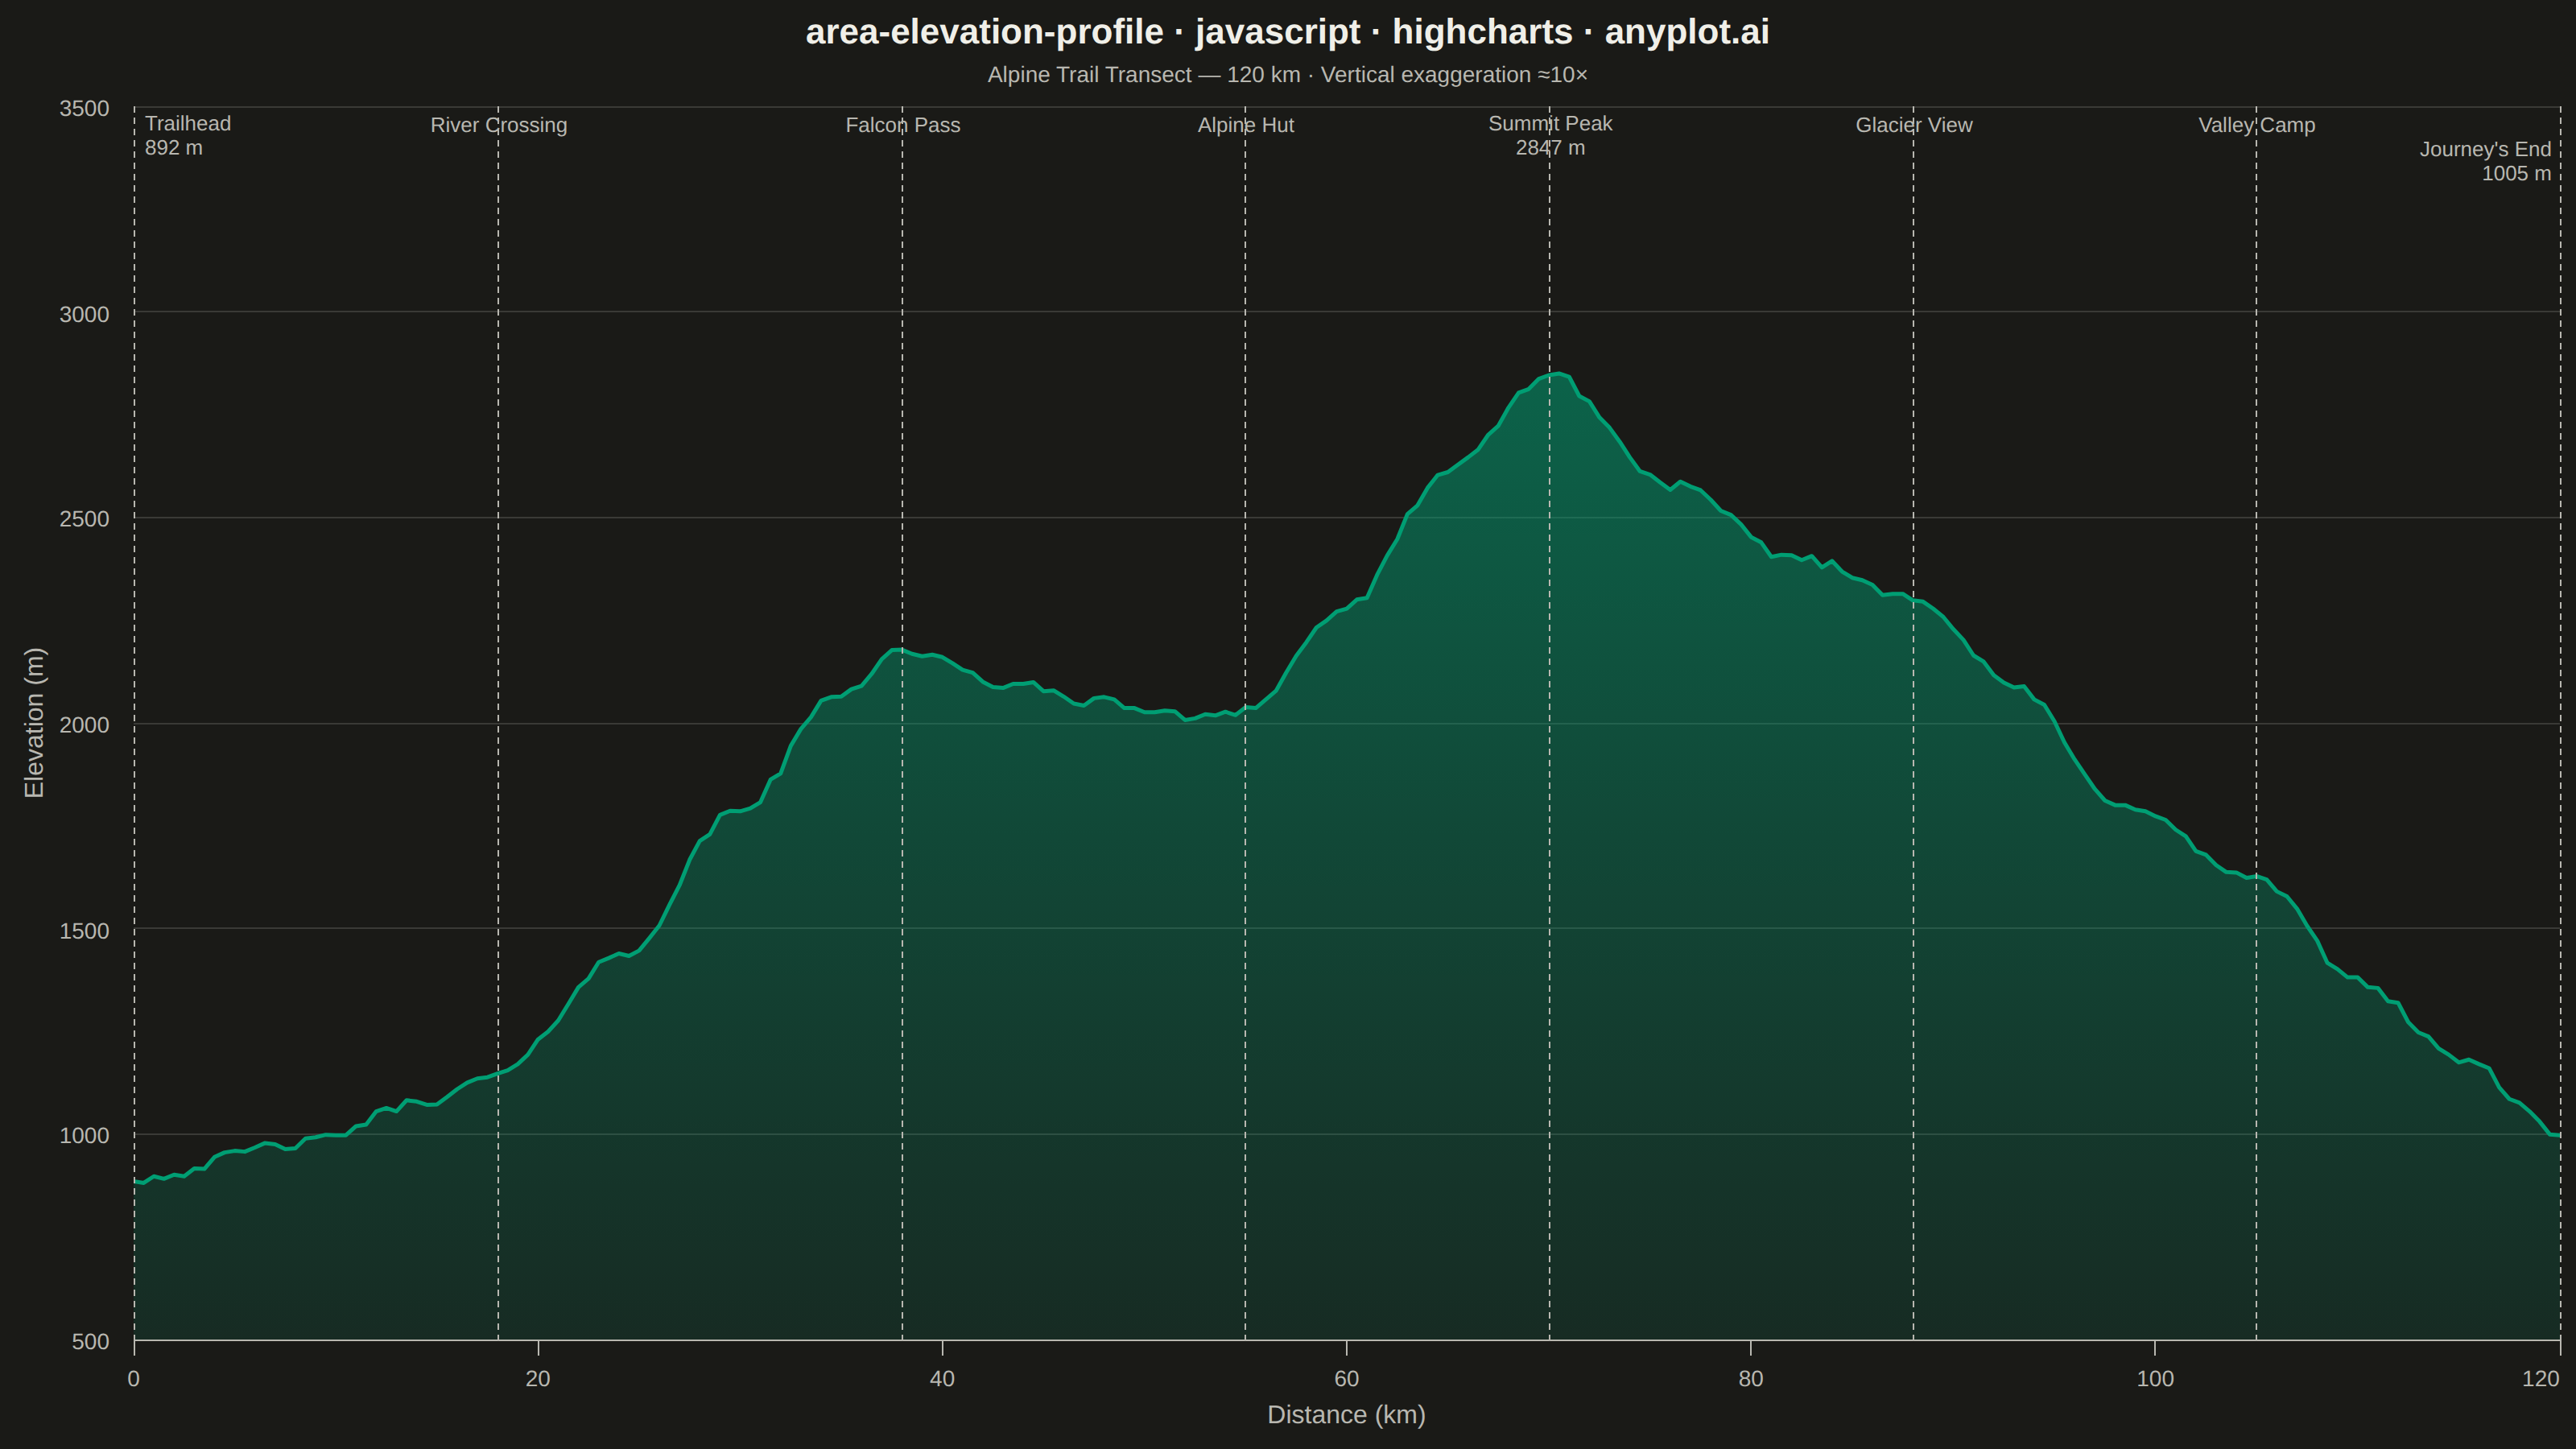
The same plot in 14 other libraries — JavaScript: Chart.js, D3.js, Apache ECharts, MUI X Charts; Python: Altair, Bokeh, lets-plot, Matplotlib, Plotly, plotnine, Pygal, Seaborn; R: ggplot2; Julia: Makie.jl. Compare all 15 side by side: Terrain Elevation Profile Along Transect in Python, R, Julia and JavaScript.
A cross-sectional line plot showing ground elevation along a path or transect line, with the area below the profile filled to create a terrain silhouette. Distance along the transect is plotted on the x-axis and elevation on the y-axis. This visualization is widely used in hiking and cycling route planning, civil engineering corridor design, and geomorphology to convey terrain shape and difficulty at a glance.
// anyplot.ai
// area-elevation-profile: Terrain Elevation Profile Along Transect
// Library: highcharts 12.6.0 | JavaScript 22.22.3
// Quality: 90/100 | Created: 2026-06-10

//# anyplot-orientation: landscape

const t = window.ANYPLOT_TOKENS;

// Convert hex color to rgba string for gradient stops
function rgba(hex, alpha) {
  const r = parseInt(hex.slice(1, 3), 16);
  const g = parseInt(hex.slice(3, 5), 16);
  const b = parseInt(hex.slice(5, 7), 16);
  return `rgba(${r},${g},${b},${alpha})`;
}

// Cosine interpolation for smooth elevation transitions between waypoints
function cosineInterp(a, b, u) {
  return a + (b - a) * (1 - Math.cos(u * Math.PI)) / 2;
}

// Control points for a 120 km alpine trail: [distance (km), elevation (m)]
const WAYPOINTS = [
  [0,   892],  [8,   975],  [15, 1085],  [18, 1145],  [24, 1430],
  [30, 1790],  [35, 2075],  [38, 2178],  [43, 2095],  [48, 2050],
  [52, 2015],  [55, 2034],  [60, 2280],  [65, 2610],  [70, 2847],
  [76, 2580],  [82, 2405],  [88, 2310],  [93, 2090],  [98, 1810],
  [105, 1620], [110, 1375], [115, 1185], [120, 1005],
];

function getElevation(d) {
  for (let i = 0; i < WAYPOINTS.length - 1; i++) {
    const [d0, e0] = WAYPOINTS[i];
    const [d1, e1] = WAYPOINTS[i + 1];
    if (d >= d0 && d <= d1) {
      return cosineInterp(e0, e1, (d - d0) / (d1 - d0));
    }
  }
  return WAYPOINTS[WAYPOINTS.length - 1][1];
}

// Seeded LCG for deterministic terrain noise (no Math.random)
function makeLCG(seed) {
  let s = seed >>> 0;
  return function () {
    s = (Math.imul(s, 1664525) + 1013904223) >>> 0;
    return s / 4294967296;
  };
}
const rng = makeLCG(42);

// 241 sample points at 0.5 km intervals (total 120 km)
const seriesData = [];
for (let i = 0; i <= 240; i++) {
  const d = Math.round(i * 5) / 10;  // 0.0, 0.5, 1.0, ..., 120.0
  const noise = (rng() - 0.5) * 28;
  const elev = Math.round(Math.max(700, getElevation(d) + noise));
  seriesData.push([d, elev]);
}

// Key landmarks with name, distance, and elevation for annotation
// elev shown on start/end points and summit per spec requirement
const LANDMARKS = [
  { dist: 0,   name: "Trailhead",      elev: "892 m",  align: "left",   x: 6,  y: 16 },
  { dist: 18,  name: "River Crossing", elev: null,     align: "center", x: 0,  y: 16 },
  { dist: 38,  name: "Falcon Pass",    elev: null,     align: "center", x: 0,  y: 16 },
  { dist: 55,  name: "Alpine Hut",     elev: null,     align: "center", x: 0,  y: 16 },
  { dist: 70,  name: "Summit Peak",    elev: "2847 m", align: "center", x: 0,  y: 16 },
  { dist: 88,  name: "Glacier View",   elev: null,     align: "center", x: 0,  y: 16 },
  { dist: 105, name: "Valley Camp",    elev: null,     align: "center", x: 0,  y: 16 },
  { dist: 120, name: "Journey's End",  elev: "1005 m", align: "right",  x: -6, y: 32 },
];

const plotLines = LANDMARKS.map(lm => ({
  value: lm.dist,
  color: t.inkSoft,
  width: 1,
  dashStyle: "Dash",
  zIndex: 5,
  label: {
    text: lm.elev ? `${lm.name}<br/>${lm.elev}` : lm.name,
    useHTML: !!lm.elev,
    rotation: 0,
    textAlign: lm.align,
    verticalAlign: "top",
    x: lm.x,
    y: lm.y,
    style: { color: t.inkSoft, fontSize: "13px", fontWeight: "normal" },
  },
}));

Highcharts.chart("container", {
  chart: {
    type: "area",
    backgroundColor: "transparent",
    animation: false,
    style: { fontFamily: "inherit" },
  },
  credits: { enabled: false },
  colors: t.palette,
  title: {
    text: "area-elevation-profile · javascript · highcharts · anyplot.ai",
    style: { color: t.ink, fontSize: "22px", fontWeight: "600" },
  },
  subtitle: {
    text: "Alpine Trail Transect — 120 km  ·  Vertical exaggeration ≈10×",
    style: { color: t.inkSoft, fontSize: "14px" },
  },
  xAxis: {
    title: {
      text: "Distance (km)",
      style: { color: t.inkSoft, fontSize: "16px" },
    },
    labels: { style: { color: t.inkSoft, fontSize: "14px" } },
    lineColor: t.inkSoft,
    tickColor: t.inkSoft,
    gridLineWidth: 0,
    tickInterval: 20,
    min: 0,
    max: 120,
    plotLines: plotLines,
  },
  yAxis: {
    title: {
      text: "Elevation (m)",
      style: { color: t.inkSoft, fontSize: "16px" },
    },
    labels: { style: { color: t.inkSoft, fontSize: "14px" } },
    gridLineColor: t.grid,
    gridLineWidth: 1,
    tickInterval: 500,
    min: 600,
    max: 3200,
  },
  legend: { enabled: false },
  tooltip: { enabled: false },
  plotOptions: {
    series: { animation: false },
    area: {
      lineWidth: 2.5,
      marker: { enabled: false },
      fillColor: {
        linearGradient: { x1: 0, y1: 0, x2: 0, y2: 1 },
        stops: [
          [0, rgba(t.palette[0], 0.55)],
          [1, rgba(t.palette[0], 0.13)],
        ],
      },
      states: { hover: { enabled: false } },
      threshold: null,
    },
  },
  series: [
    {
      name: "Elevation",
      data: seriesData,
      color: t.palette[0],
    },
  ],
});
Runnable source as JSON, for any HTTP client: https://api.anyplot.ai/specs/area-elevation-profile/highcharts/code. Any spec id and library id listed in llms-full.txt fit the same URL shape; every URL below is complete and callable.
{
  "spec_id": "area-elevation-profile",
  "language": "javascript",
  "library": "highcharts",
  "page": "https://anyplot.ai/area-elevation-profile/javascript/highcharts",
  "hub": "https://anyplot.ai/area-elevation-profile",
  "code_json": "https://api.anyplot.ai/specs/area-elevation-profile/highcharts/code",
  "spec_json": "https://api.anyplot.ai/specs/area-elevation-profile",
  "render_light_png": "https://storage.googleapis.com/anyplot-images/plots/area-elevation-profile/javascript/highcharts/plot-light.png",
  "render_dark_png": "https://storage.googleapis.com/anyplot-images/plots/area-elevation-profile/javascript/highcharts/plot-dark.png",
  "interactive_light_html": "https://storage.googleapis.com/anyplot-images/plots/area-elevation-profile/javascript/highcharts/plot-light.html",
  "interactive_dark_html": "https://storage.googleapis.com/anyplot-images/plots/area-elevation-profile/javascript/highcharts/plot-dark.html",
  "quality_score": 90.0,
  "license": "MIT",
  "guide": "https://anyplot.ai/llms.txt"
}
Part of Terrain Elevation Profile Along Transect on anyplot.ai.