The same plot in 14 other libraries — JavaScript: Chart.js, Apache ECharts, Highcharts, MUI X Charts; Python: Altair, Bokeh, lets-plot, Matplotlib, Plotly, plotnine, Pygal, Seaborn; R: ggplot2; Julia: Makie.jl. Compare all 15 side by side: Terrain Elevation Profile Along Transect in Python, R, Julia and JavaScript.
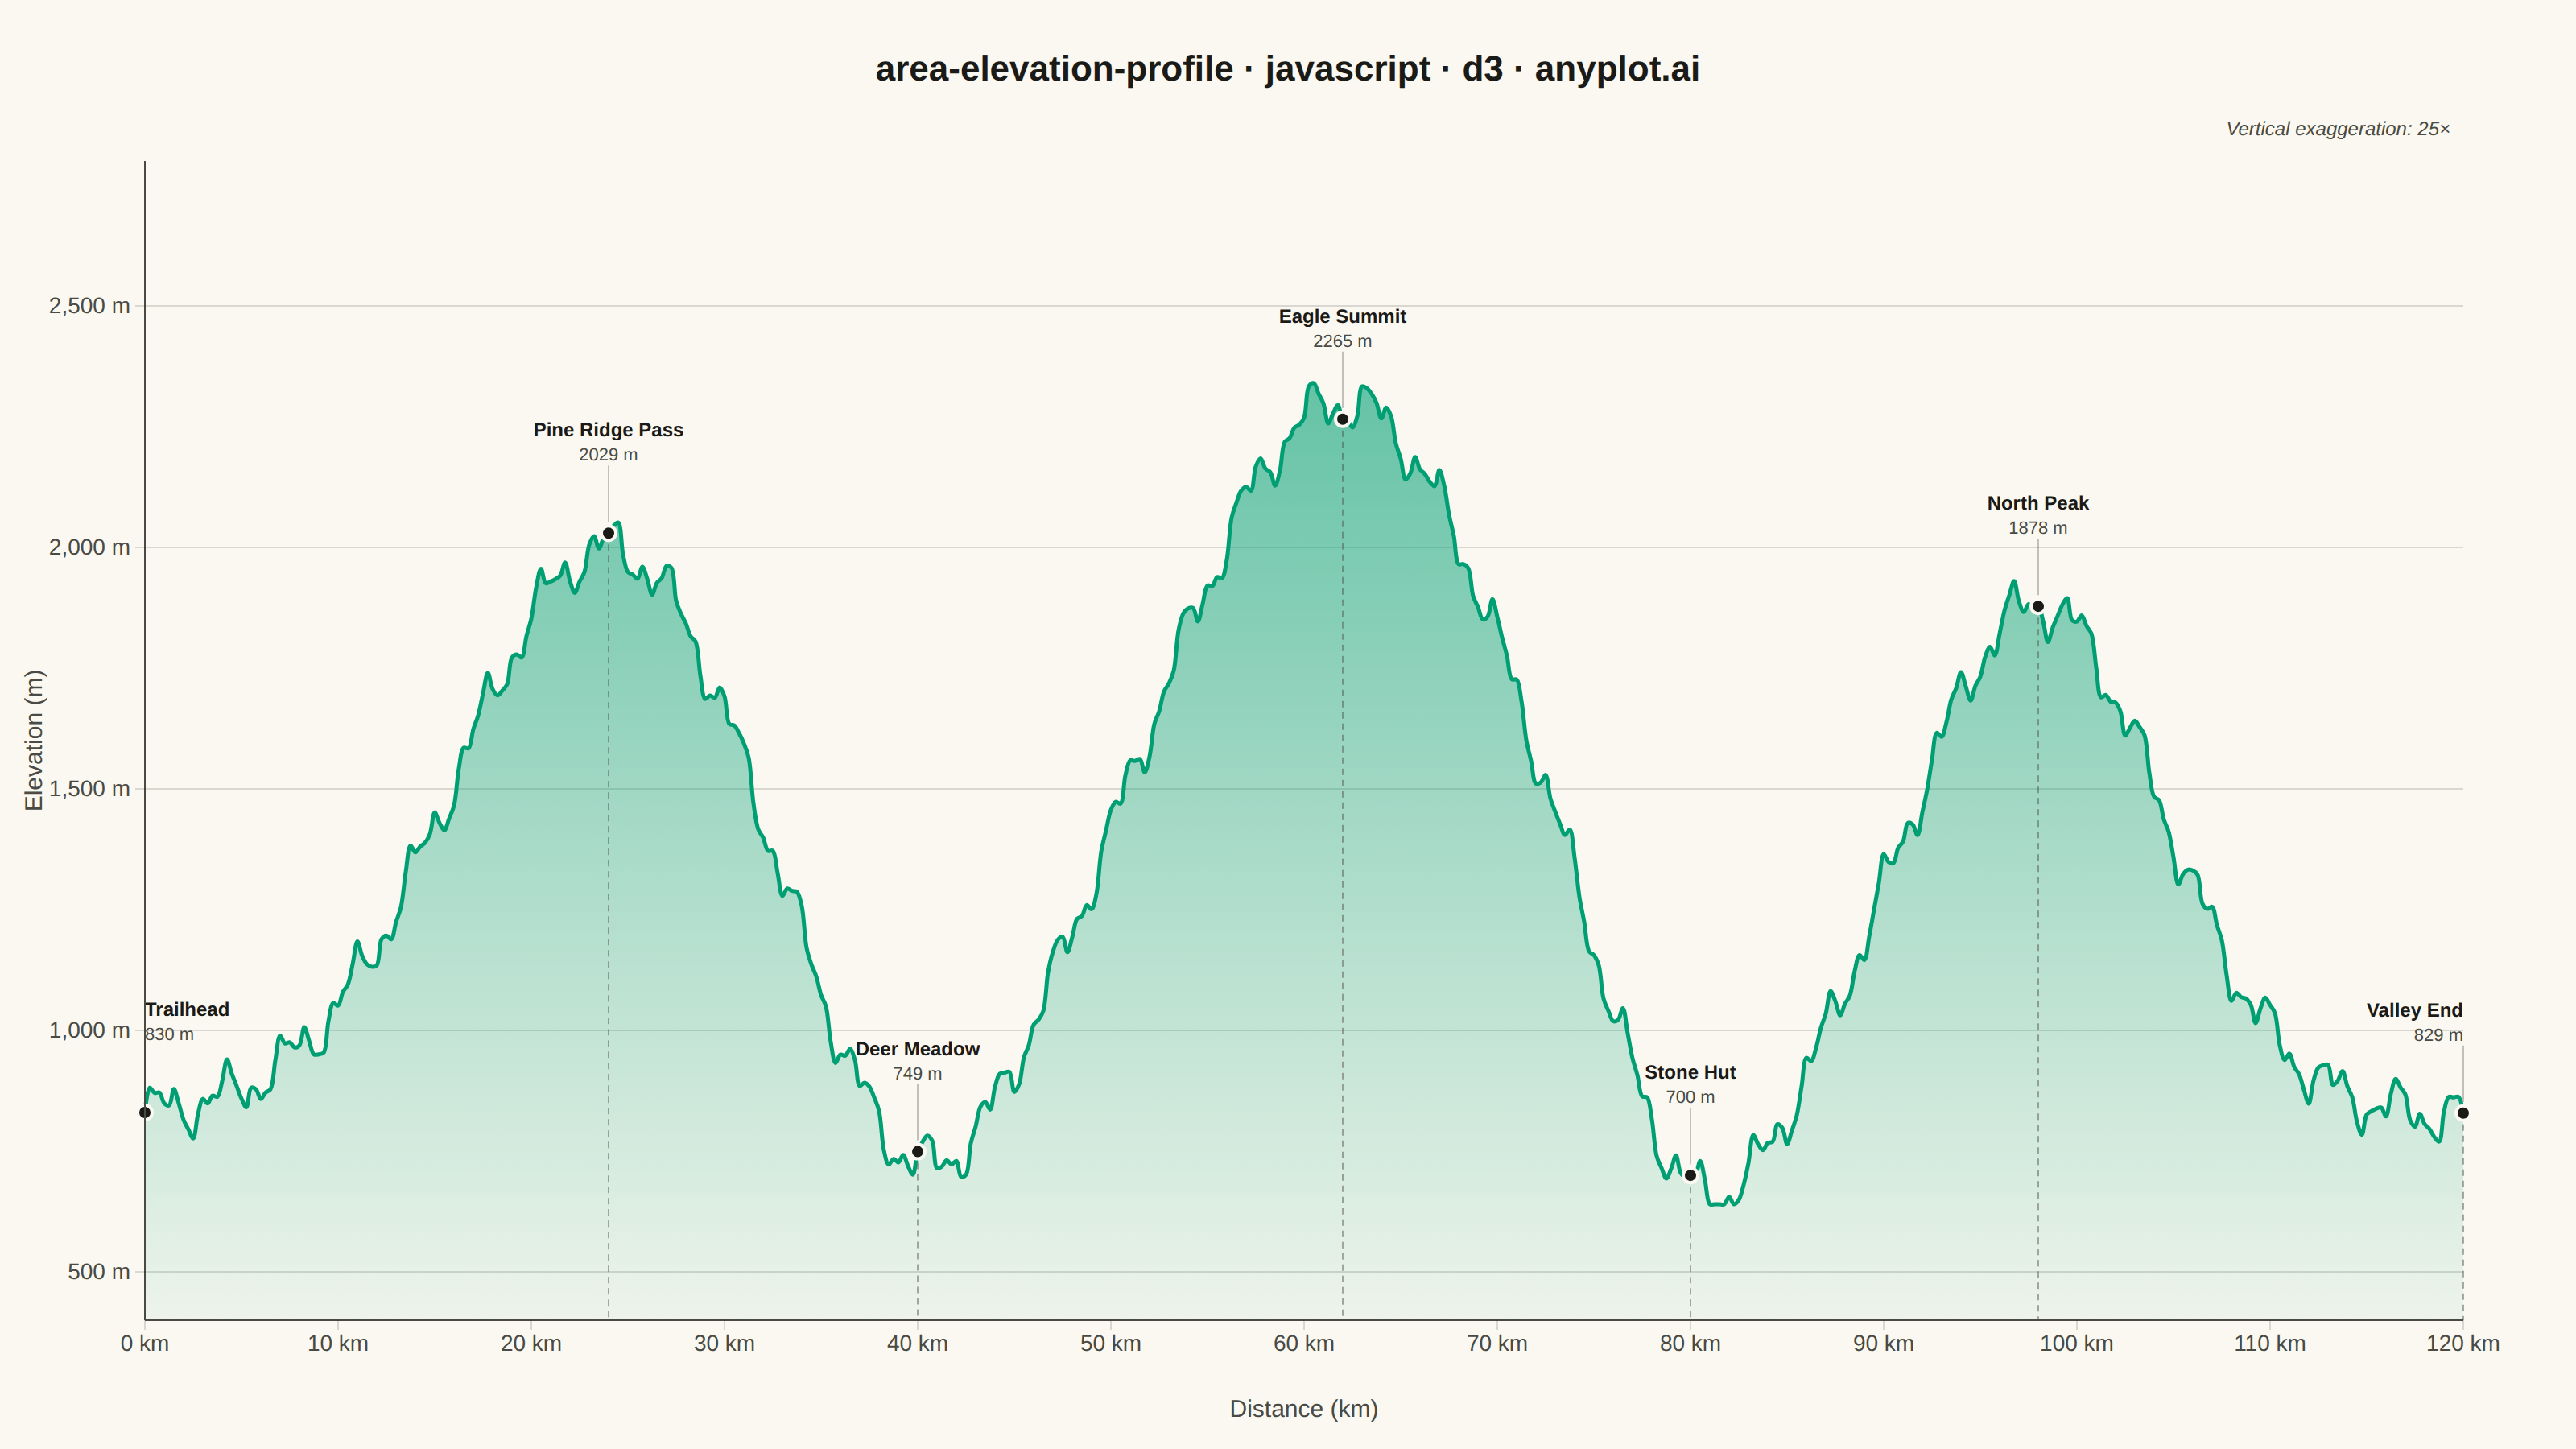
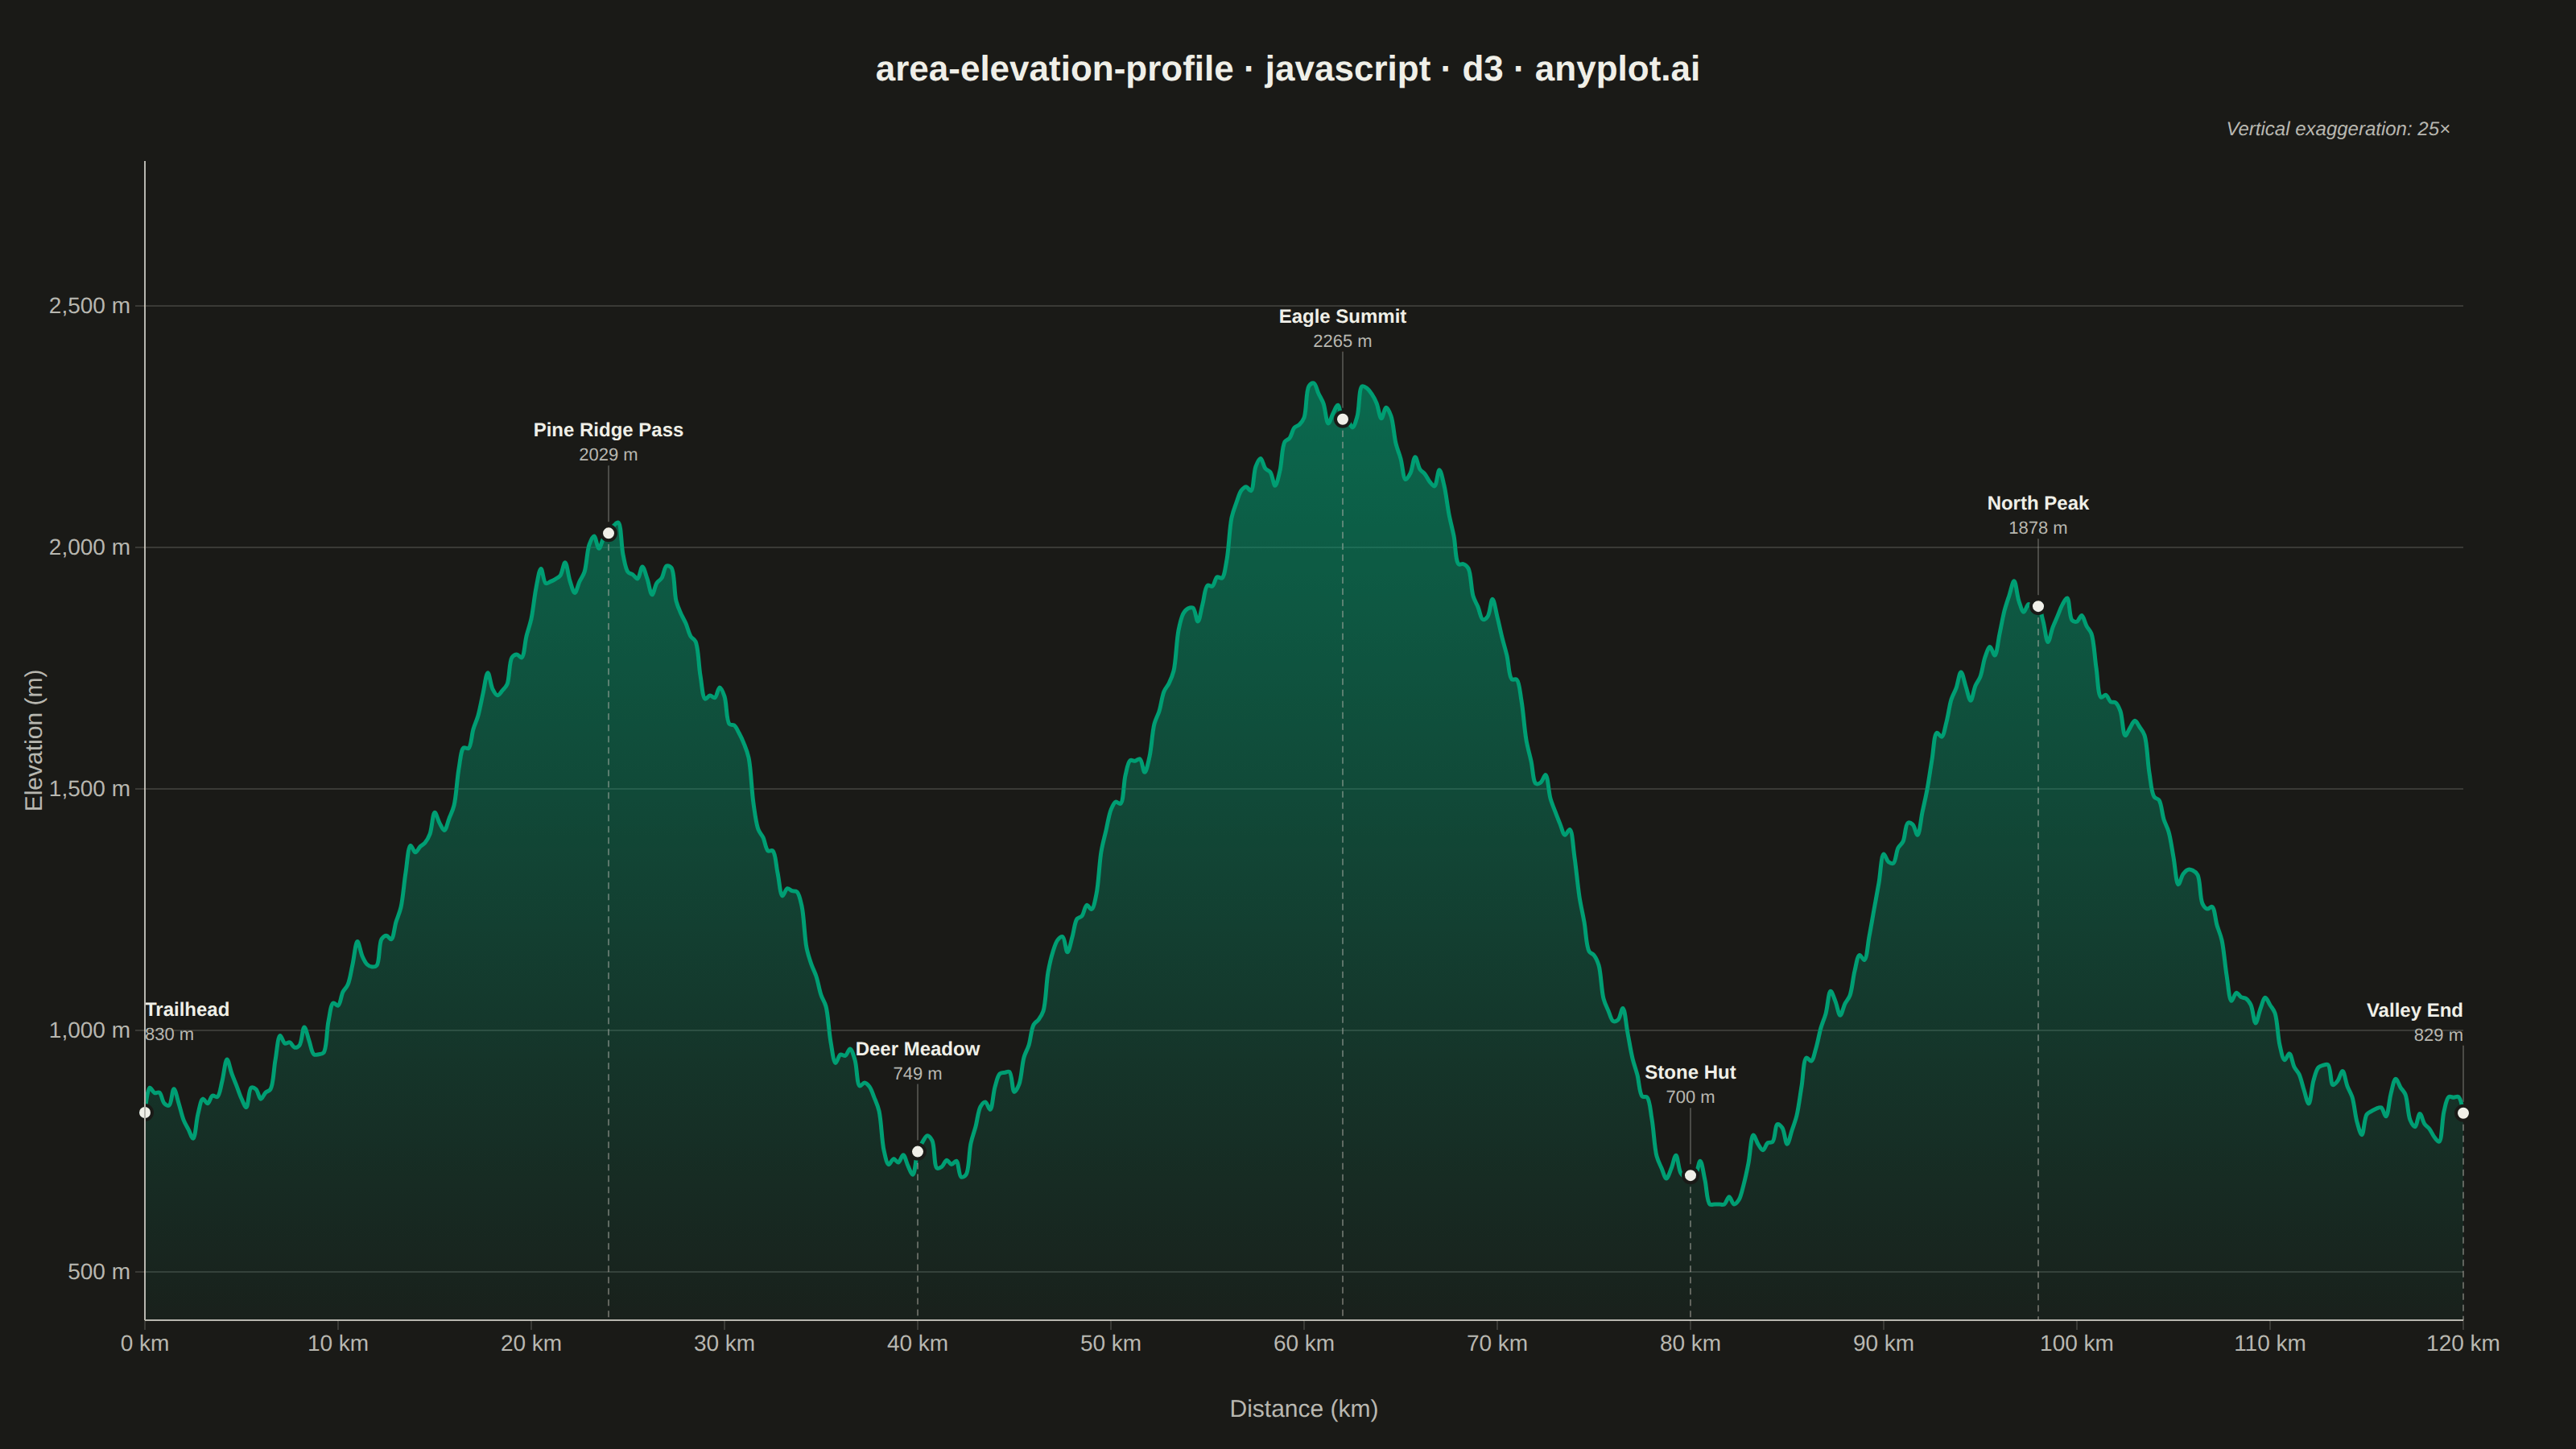
A cross-sectional line plot showing ground elevation along a path or transect line, with the area below the profile filled to create a terrain silhouette. Distance along the transect is plotted on the x-axis and elevation on the y-axis. This visualization is widely used in hiking and cycling route planning, civil engineering corridor design, and geomorphology to convey terrain shape and difficulty at a glance.
// anyplot.ai
// area-elevation-profile: Terrain Elevation Profile Along Transect
// Library: d3 7.9.0 | JavaScript 22.22.3
// Quality: 91/100 | Created: 2026-06-10

const t = window.ANYPLOT_TOKENS;
const { width, height } = window.ANYPLOT_SIZE;
const margin = { top: 100, right: 70, bottom: 80, left: 90 };
const iw = width - margin.left - margin.right;
const ih = height - margin.top - margin.bottom;

// --- Data -------------------------------------------------------------------
// Deterministic alpine trail elevation profile (120 km transect, 481 sample points)
function elevAt(dist) {
  const base = 820;
  const p1 = 1180 * Math.exp(-Math.pow((dist - 24) / 11, 2));
  const v1 = -320  * Math.exp(-Math.pow((dist - 40) /  7, 2));
  const p2 = 1480 * Math.exp(-Math.pow((dist - 62) / 13, 2));
  const v2 = -380  * Math.exp(-Math.pow((dist - 80) /  6, 2));
  const p3 = 1060 * Math.exp(-Math.pow((dist - 98) /  9, 2));
  const ripple = 40 * Math.sin(dist * 1.9) + 25 * Math.sin(dist * 4.7) + 12 * Math.sin(dist * 9.3);
  return Math.max(640, base + p1 + v1 + p2 + v2 + p3 + ripple);
}

const TOTAL_KM = 120;
const N_PTS    = 480;
const profile  = Array.from({ length: N_PTS + 1 }, (_, i) => {
  const dist = (i / N_PTS) * TOTAL_KM;
  return { dist, elev: elevAt(dist) };
});

// Landmarks — elevation resolved from profile array
const LANDMARKS = [
  { name: "Trailhead",       dist: 0   },
  { name: "Pine Ridge Pass", dist: 24  },
  { name: "Deer Meadow",     dist: 40  },
  { name: "Eagle Summit",    dist: 62  },
  { name: "Stone Hut",       dist: 80  },
  { name: "North Peak",      dist: 98  },
  { name: "Valley End",      dist: 120 },
];
LANDMARKS.forEach(lm => {
  const idx = Math.min(Math.round((lm.dist / TOTAL_KM) * N_PTS), profile.length - 1);
  lm.elev = profile[idx].elev;
});

// --- SVG mount --------------------------------------------------------------
const svg = d3.select("#container").append("svg").attr("width", width).attr("height", height);
const g   = svg.append("g").attr("transform", `translate(${margin.left},${margin.top})`);

// --- Scales -----------------------------------------------------------------
const xScale = d3.scaleLinear().domain([0, TOTAL_KM]).range([0, iw]);
const [eMin, eMax] = d3.extent(profile, d => d.elev);
const yScale = d3.scaleLinear()
  .domain([Math.max(0, eMin - 120), eMax + 280])
  .nice()
  .range([ih, 0]);

// Compute actual vertical exaggeration from final scale domains
const [yDomMin, yDomMax] = yScale.domain();
const veActual = Math.round((ih * TOTAL_KM * 1000) / ((yDomMax - yDomMin) * iw));

// --- Gradient fill definition -----------------------------------------------
const defs = svg.append("defs");
const grad = defs.append("linearGradient")
  .attr("id", "elevFill")
  .attr("x1", "0%").attr("y1", "0%")
  .attr("x2", "0%").attr("y2", "100%");
grad.append("stop").attr("offset", "0%")
  .attr("stop-color", t.palette[0]).attr("stop-opacity", 0.6);
grad.append("stop").attr("offset", "100%")
  .attr("stop-color", t.palette[0]).attr("stop-opacity", 0.05);

// --- Y-axis gridlines -------------------------------------------------------
g.append("g")
  .attr("class", "y-grid")
  .call(d3.axisLeft(yScale).tickSize(-iw).tickFormat("").ticks(6))
  .call(grd => {
    grd.selectAll(".tick line").attr("stroke", t.grid);
    grd.select(".domain").remove();
  });

// --- Area fill --------------------------------------------------------------
g.append("path")
  .datum(profile)
  .attr("fill", "url(#elevFill)")
  .attr("d", d3.area()
    .x(d => xScale(d.dist))
    .y0(ih)
    .y1(d => yScale(d.elev))
    .curve(d3.curveCatmullRom.alpha(0.5)));

// --- Elevation profile line -------------------------------------------------
g.append("path")
  .datum(profile)
  .attr("fill", "none")
  .attr("stroke", t.palette[0])
  .attr("stroke-width", 2.5)
  .attr("d", d3.line()
    .x(d => xScale(d.dist))
    .y(d => yScale(d.elev))
    .curve(d3.curveCatmullRom.alpha(0.5)));

// --- Landmark annotations ---------------------------------------------------
LANDMARKS.forEach(lm => {
  const xPos   = xScale(lm.dist);
  const yTerr  = yScale(lm.elev);
  const labelY = Math.max(14, yTerr - 60);
  const anchor = lm.dist < 8 ? "start" : lm.dist > 112 ? "end" : "middle";

  // Dashed vertical line from terrain down to x-axis baseline
  g.append("line")
    .attr("x1", xPos).attr("y1", yTerr)
    .attr("x2", xPos).attr("y2", ih)
    .attr("stroke", t.inkSoft).attr("stroke-width", 1)
    .attr("stroke-dasharray", "4,3").attr("stroke-opacity", 0.45);

  // Dot at terrain surface
  g.append("circle")
    .attr("cx", xPos).attr("cy", yTerr).attr("r", 4.5)
    .attr("fill", t.ink)
    .attr("stroke", t.pageBg).attr("stroke-width", 2);

  // Thin connector from dot up to label
  g.append("line")
    .attr("x1", xPos).attr("y1", yTerr - 7)
    .attr("x2", xPos).attr("y2", labelY + 18)
    .attr("stroke", t.inkSoft).attr("stroke-width", 0.8).attr("stroke-opacity", 0.4);

  // Landmark name
  g.append("text")
    .attr("x", xPos).attr("y", labelY)
    .attr("text-anchor", anchor).attr("fill", t.ink)
    .style("font-size", "12px").style("font-weight", "600")
    .text(lm.name);

  // Elevation value
  g.append("text")
    .attr("x", xPos).attr("y", labelY + 15)
    .attr("text-anchor", anchor).attr("fill", t.inkSoft)
    .style("font-size", "11px")
    .text(`${Math.round(lm.elev)} m`);
});

// --- Axes -------------------------------------------------------------------
const xAxisG = g.append("g")
  .attr("transform", `translate(0,${ih})`)
  .call(d3.axisBottom(xScale).ticks(10).tickSizeOuter(0)
    .tickFormat(d => `${d} km`));

const yAxisG = g.append("g")
  .call(d3.axisLeft(yScale).ticks(6).tickSizeOuter(0)
    .tickFormat(d => `${d3.format(",d")(d)} m`));

for (const ax of [xAxisG, yAxisG]) {
  ax.selectAll("text").attr("fill", t.inkSoft).style("font-size", "14px");
  ax.selectAll(".tick line").attr("stroke", t.grid);
  ax.select(".domain").attr("stroke", t.inkSoft);
}

// --- Axis labels ------------------------------------------------------------
svg.append("text")
  .attr("x", margin.left + iw / 2).attr("y", height - 20)
  .attr("text-anchor", "middle").attr("fill", t.inkSoft).style("font-size", "15px")
  .text("Distance (km)");

svg.append("text")
  .attr("transform", "rotate(-90)")
  .attr("x", -(margin.top + ih / 2)).attr("y", 26)
  .attr("text-anchor", "middle").attr("fill", t.inkSoft).style("font-size", "15px")
  .text("Elevation (m)");

// --- Vertical exaggeration note ---------------------------------------------
svg.append("text")
  .attr("x", margin.left + iw - 8).attr("y", margin.top - 16)
  .attr("text-anchor", "end").attr("fill", t.inkSoft)
  .style("font-size", "12px").style("font-style", "italic")
  .text(`Vertical exaggeration: ${veActual}×`);

// --- Title ------------------------------------------------------------------
svg.append("text")
  .attr("x", width / 2).attr("y", 50)
  .attr("text-anchor", "middle").attr("fill", t.ink)
  .style("font-size", "22px").style("font-weight", "600")
  .text("area-elevation-profile · javascript · d3 · anyplot.ai");
Runnable source as JSON, for any HTTP client: https://api.anyplot.ai/specs/area-elevation-profile/d3/code. Any spec id and library id listed in llms-full.txt fit the same URL shape; every URL below is complete and callable.
{
  "spec_id": "area-elevation-profile",
  "language": "javascript",
  "library": "d3",
  "page": "https://anyplot.ai/area-elevation-profile/javascript/d3",
  "hub": "https://anyplot.ai/area-elevation-profile",
  "code_json": "https://api.anyplot.ai/specs/area-elevation-profile/d3/code",
  "spec_json": "https://api.anyplot.ai/specs/area-elevation-profile",
  "render_light_png": "https://storage.googleapis.com/anyplot-images/plots/area-elevation-profile/javascript/d3/plot-light.png",
  "render_dark_png": "https://storage.googleapis.com/anyplot-images/plots/area-elevation-profile/javascript/d3/plot-dark.png",
  "interactive_light_html": "https://storage.googleapis.com/anyplot-images/plots/area-elevation-profile/javascript/d3/plot-light.html",
  "interactive_dark_html": "https://storage.googleapis.com/anyplot-images/plots/area-elevation-profile/javascript/d3/plot-dark.html",
  "quality_score": 91.0,
  "license": "MIT",
  "guide": "https://anyplot.ai/llms.txt"
}
Part of Terrain Elevation Profile Along Transect on anyplot.ai.