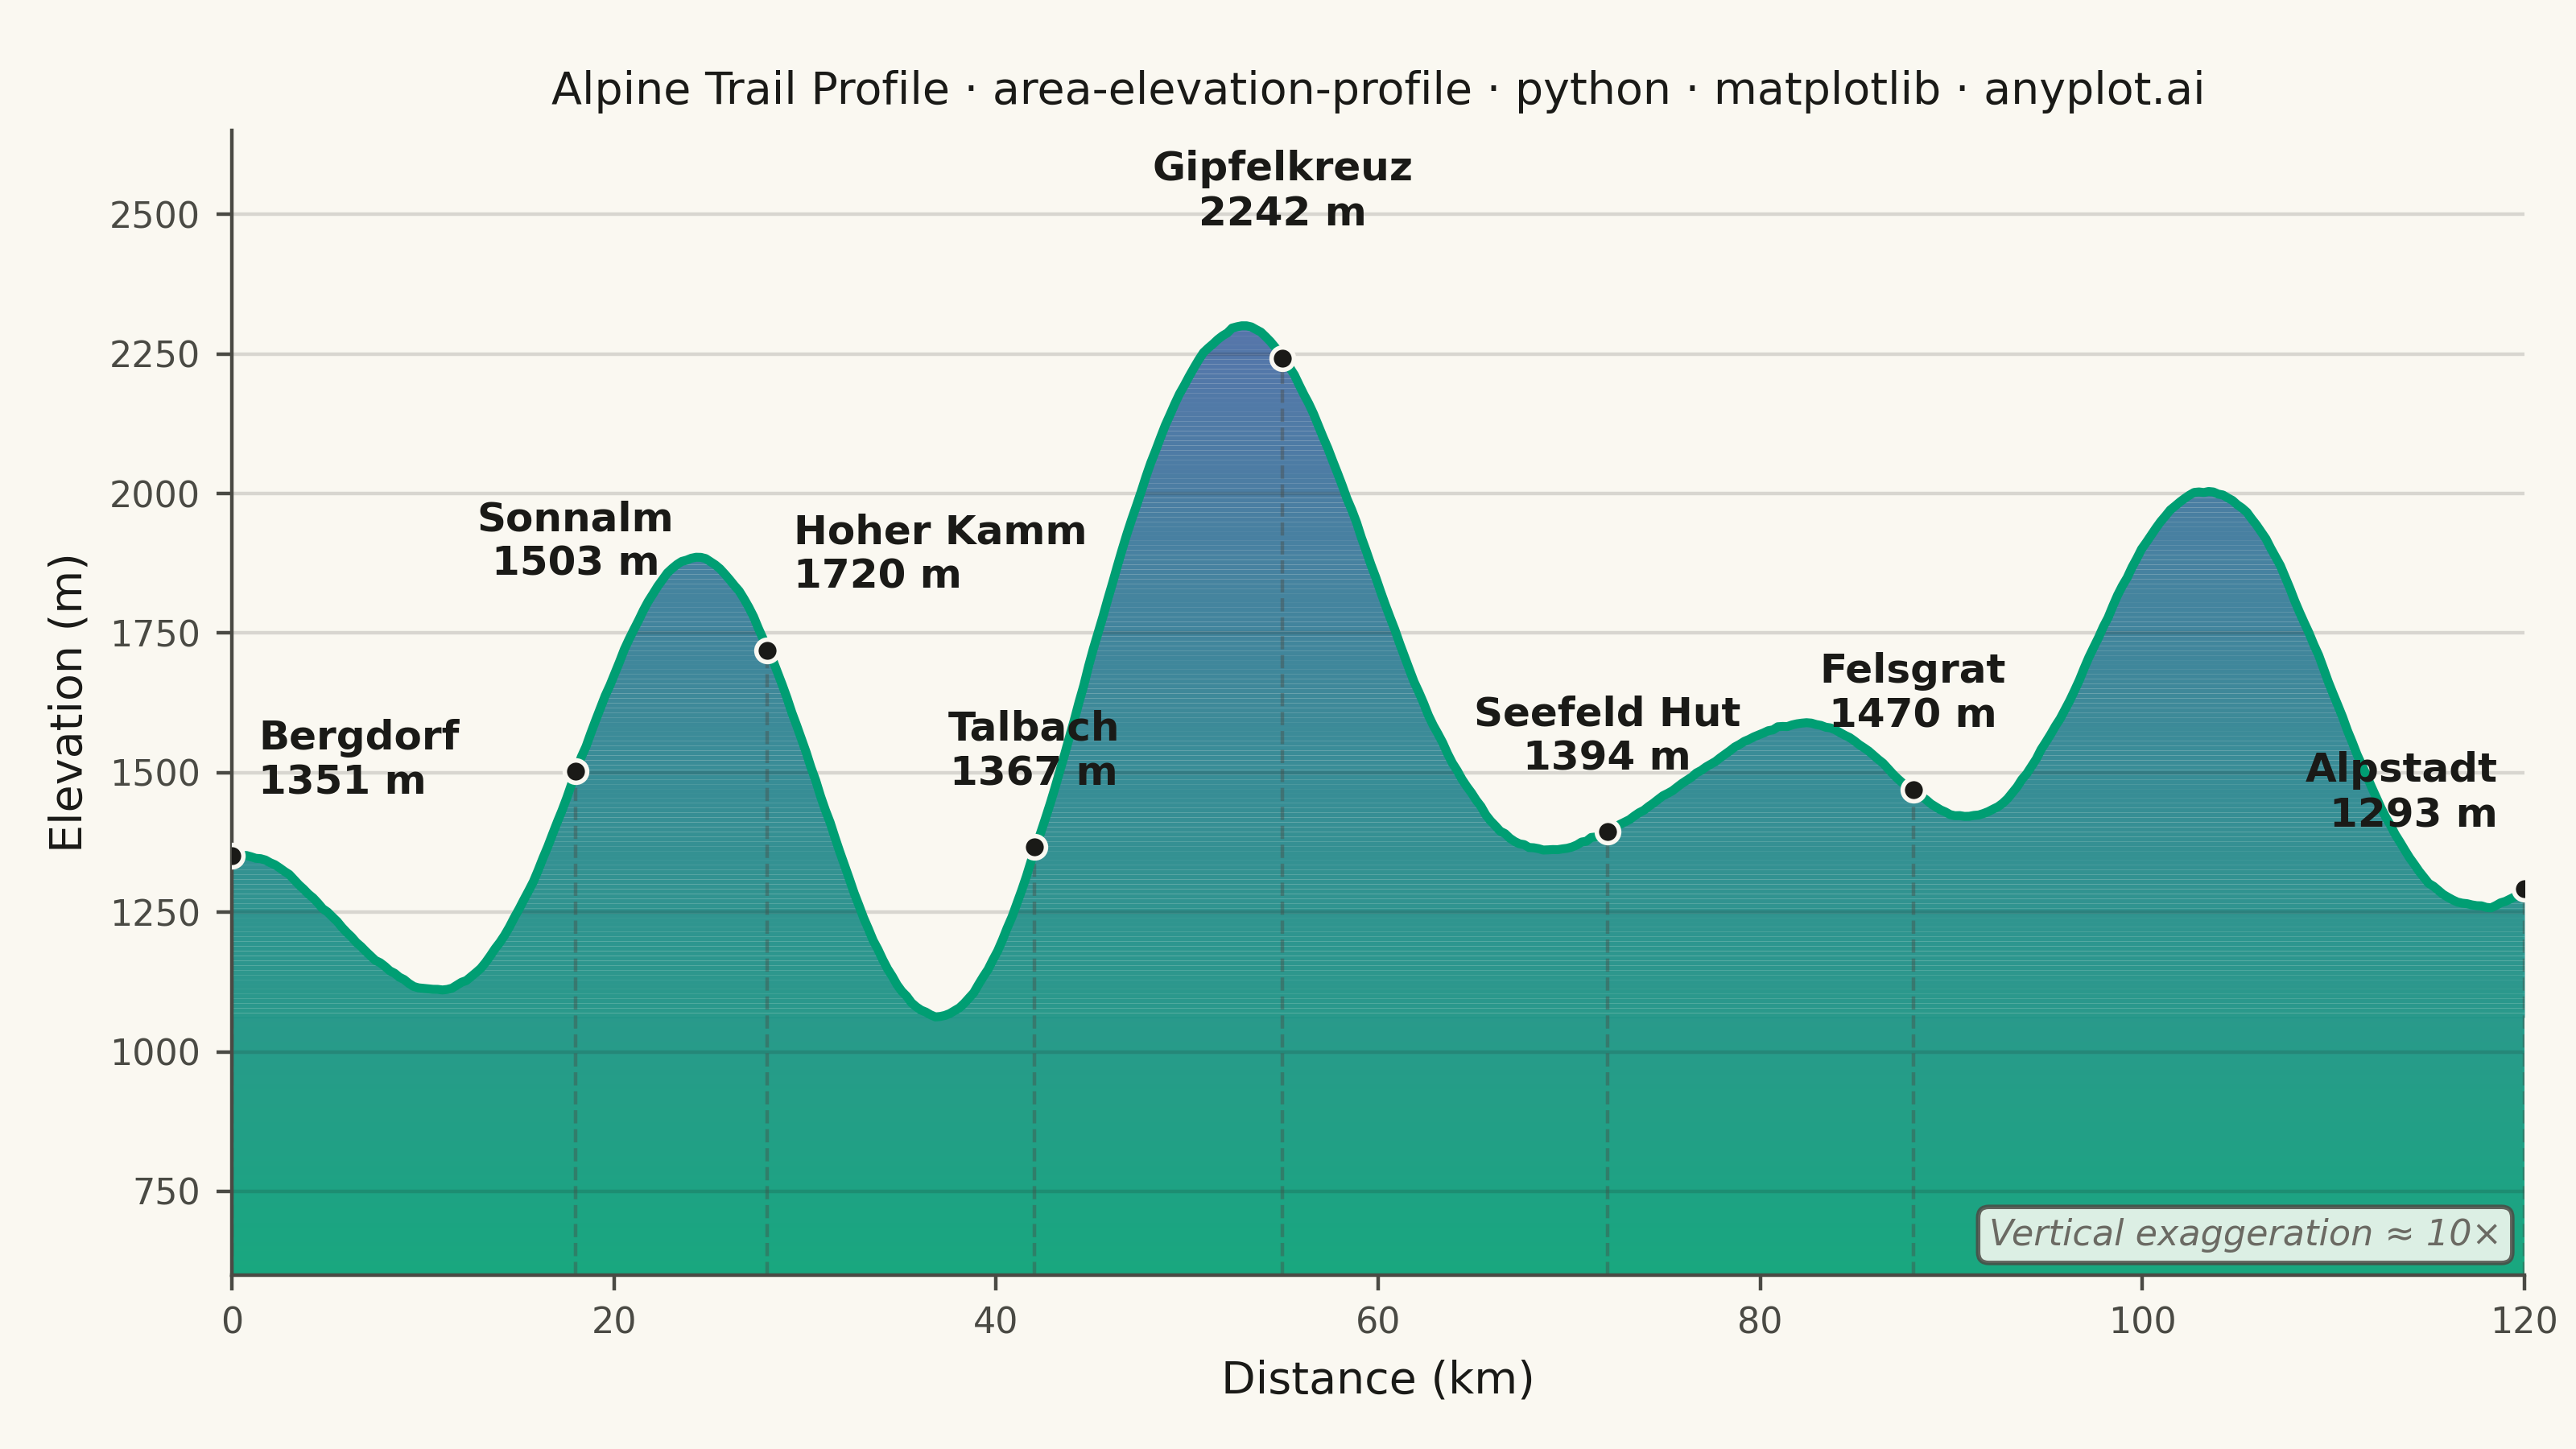
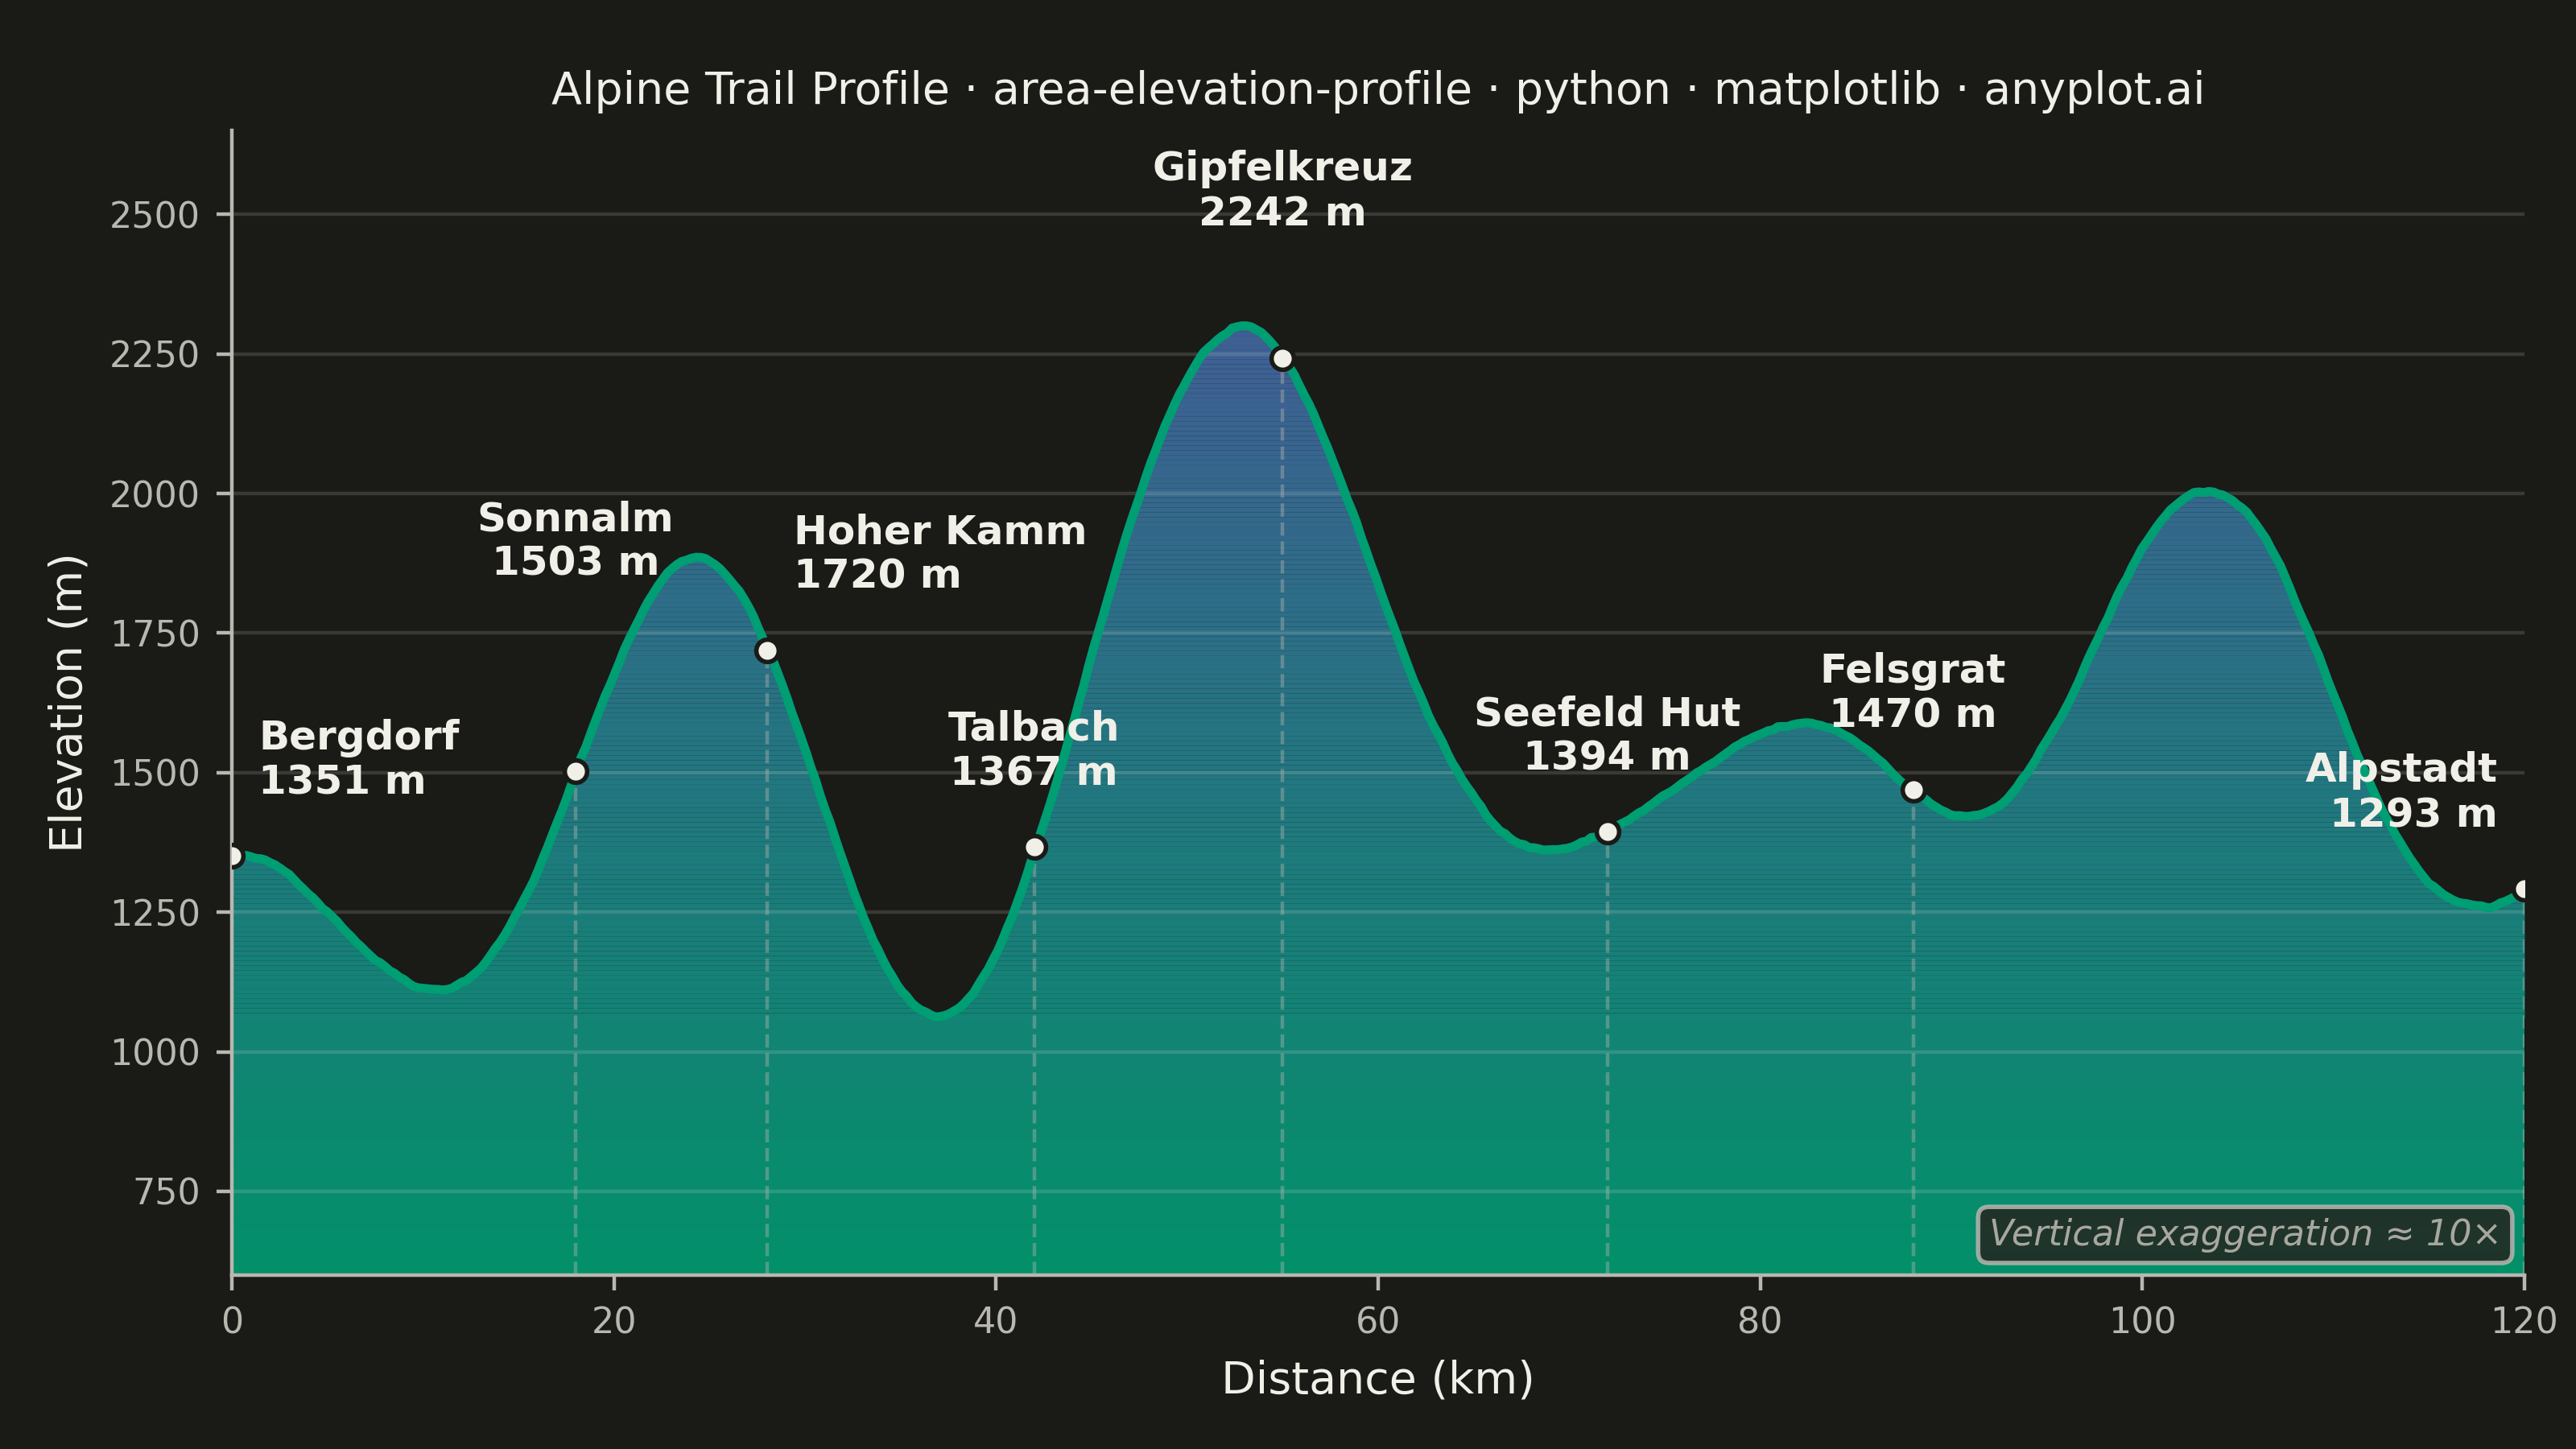
A cross-sectional line plot showing ground elevation along a path or transect line, with the area below the profile filled to create a terrain silhouette. Distance along the transect is plotted on the x-axis and elevation on the y-axis. This visualization is widely used in hiking and cycling route planning, civil engineering corridor design, and geomorphology to convey terrain shape and difficulty at a glance.
""" anyplot.ai
area-elevation-profile: Terrain Elevation Profile Along Transect
Library: matplotlib 3.10.9 | Python 3.13.13
Quality: 90/100 | Updated: 2026-06-10
"""

import os
import sys


# Prevent this file from shadowing the installed matplotlib package on sys.path
_this_dir = os.path.dirname(os.path.abspath(__file__))
if _this_dir in sys.path:
    sys.path.remove(_this_dir)

import matplotlib.pyplot as plt
import numpy as np
from matplotlib.colors import LinearSegmentedColormap


# Theme tokens
THEME = os.getenv("ANYPLOT_THEME", "light")
PAGE_BG = "#FAF8F1" if THEME == "light" else "#1A1A17"
ELEVATED_BG = "#FFFDF6" if THEME == "light" else "#242420"
INK = "#1A1A17" if THEME == "light" else "#F0EFE8"
INK_SOFT = "#4A4A44" if THEME == "light" else "#B8B7B0"
INK_MUTED = "#6B6A63" if THEME == "light" else "#A8A79F"

# Data — Alpine hiking trail profile (120 km)
np.random.seed(42)
num_points = 480
distance = np.linspace(0, 120, num_points)

# Build realistic terrain with multiple peaks and valleys
base = 1200
elevation = base + np.zeros(num_points)
elevation += 600 * np.exp(-((distance - 25) ** 2) / 80)
elevation += 900 * np.exp(-((distance - 55) ** 2) / 120)
elevation += 450 * np.exp(-((distance - 85) ** 2) / 60)
elevation += 700 * np.exp(-((distance - 105) ** 2) / 90)
elevation += 200 * np.sin(distance * 0.15) * np.exp(-((distance - 40) ** 2) / 300)
elevation += 150 * np.cos(distance * 0.25)
elevation += np.cumsum(np.random.normal(0, 1.5, num_points))
elevation = np.maximum(elevation, 800)

# Landmarks
landmark_labels = ["Bergdorf", "Sonnalm", "Hoher Kamm", "Talbach", "Gipfelkreuz", "Seefeld Hut", "Felsgrat", "Alpstadt"]
landmark_distances = [0, 18, 28, 42, 55, 72, 88, 120]
landmark_elevations = [
    elevation[0],
    elevation[np.argmin(np.abs(distance - 18))],
    elevation[np.argmin(np.abs(distance - 28))],
    elevation[np.argmin(np.abs(distance - 42))],
    elevation[np.argmin(np.abs(distance - 55))],
    elevation[np.argmin(np.abs(distance - 72))],
    elevation[np.argmin(np.abs(distance - 88))],
    elevation[-1],
]
landmark_names = [
    f"{name}\n{int(round(elev))} m" for name, elev in zip(landmark_labels, landmark_elevations, strict=True)
]

# Plot
fig, ax = plt.subplots(figsize=(8, 4.5), dpi=400, facecolor=PAGE_BG)
ax.set_facecolor(PAGE_BG)

y_min = 600
y_max = elevation.max()

# Gradient fill — terrain silhouette (imprint_seq: brand green → blue)
cmap = LinearSegmentedColormap.from_list("imprint_seq", ["#009E73", "#4467A3"])
gradient_resolution = 200
y_levels = np.linspace(y_min, y_max, gradient_resolution)
for i in range(len(y_levels) - 1):
    y_lo = y_levels[i]
    y_hi = y_levels[i + 1]
    clipped = np.clip(elevation, y_lo, y_hi)
    color = cmap(i / (len(y_levels) - 1))
    ax.fill_between(distance, y_lo, clipped, color=color, alpha=0.9, linewidth=0)

# Profile line — brand green primary data element
ax.plot(distance, elevation, color="#009E73", linewidth=2.0, zorder=3)

# Landmark annotations — stagger to separate the 18–28 km cluster
# Sonnalm pushed up high (horiz-centered) so it clears Hoher Kamm without going left into Bergdorf
label_configs = [
    ("left", (6, 12)),  # Bergdorf    (0 km)  — text right
    ("center", (0, 42)),  # Sonnalm     (18 km) — pushed up, clears Hoher Kamm below
    ("left", (6, 12)),  # Hoher Kamm  (28 km) — text right, at normal height
    ("center", (0, 12)),  # Talbach     (42 km)
    ("center", (0, 28)),  # Gipfelkreuz (55 km) — pushed up as focal peak
    ("center", (0, 12)),  # Seefeld Hut (72 km)
    ("center", (0, 12)),  # Felsgrat    (88 km)
    ("right", (-6, 12)),  # Alpstadt    (120 km) — text left
]
for (ha, (dx, dy)), name, d, e in zip(
    label_configs, landmark_names, landmark_distances, landmark_elevations, strict=True
):
    ax.plot([d, d], [y_min, e], color=INK_SOFT, linewidth=0.8, linestyle="--", alpha=0.4, zorder=2)
    ax.plot(d, e, "o", color=INK, markersize=5, zorder=4, markeredgecolor=PAGE_BG, markeredgewidth=1)
    ax.annotate(
        name,
        xy=(d, e),
        xytext=(dx, dy),
        textcoords="offset points",
        fontsize=9,
        fontweight="bold",
        ha=ha,
        va="bottom",
        color=INK,
    )

# Style
title = "Alpine Trail Profile · area-elevation-profile · python · matplotlib · anyplot.ai"
title_len = len(title)
title_fontsize = max(8, round(12 * 67 / title_len)) if title_len > 67 else 12
ax.set_xlabel("Distance (km)", fontsize=10, color=INK)
ax.set_ylabel("Elevation (m)", fontsize=10, color=INK)
ax.set_title(title, fontsize=title_fontsize, fontweight="medium", color=INK)
ax.tick_params(axis="both", labelsize=8, colors=INK_SOFT, labelcolor=INK_SOFT)
ax.spines["top"].set_visible(False)
ax.spines["right"].set_visible(False)
for spine in ("left", "bottom"):
    ax.spines[spine].set_color(INK_SOFT)
ax.set_xlim(0, 120)
ax.set_ylim(y_min, y_max + 350)
ax.yaxis.grid(True, alpha=0.15, linewidth=0.8, color=INK)

# Vertical exaggeration note
ax.text(
    0.99,
    0.02,
    "Vertical exaggeration ≈ 10×",
    transform=ax.transAxes,
    fontsize=8,
    ha="right",
    va="bottom",
    color=INK_MUTED,
    fontstyle="italic",
    bbox={"boxstyle": "round,pad=0.3", "facecolor": ELEVATED_BG, "edgecolor": INK_SOFT, "alpha": 0.85},
)

fig.subplots_adjust(left=0.09, right=0.98, top=0.91, bottom=0.12)

# Save
plt.savefig(f"plot-{THEME}.png", dpi=400, facecolor=PAGE_BG)
Runnable source as JSON, for any HTTP client: https://api.anyplot.ai/specs/area-elevation-profile/matplotlib/code. Any spec id and library id listed in llms-full.txt fit the same URL shape; every URL below is complete and callable.
{
  "spec_id": "area-elevation-profile",
  "language": "python",
  "library": "matplotlib",
  "page": "https://anyplot.ai/area-elevation-profile/python/matplotlib",
  "hub": "https://anyplot.ai/area-elevation-profile",
  "code_json": "https://api.anyplot.ai/specs/area-elevation-profile/matplotlib/code",
  "spec_json": "https://api.anyplot.ai/specs/area-elevation-profile",
  "render_light_png": "https://storage.googleapis.com/anyplot-images/plots/area-elevation-profile/python/matplotlib/plot-light.png",
  "render_dark_png": "https://storage.googleapis.com/anyplot-images/plots/area-elevation-profile/python/matplotlib/plot-dark.png",
  "quality_score": 90.0,
  "license": "MIT",
  "guide": "https://anyplot.ai/llms.txt"
}
Part of Terrain Elevation Profile Along Transect on anyplot.ai.