The same plot in 14 other libraries — Python: Altair, Bokeh, lets-plot, Matplotlib, Plotly, plotnine, Pygal, Seaborn; R: ggplot2; JavaScript: Chart.js, D3.js, Apache ECharts, Highcharts, MUI X Charts. Compare all 15 side by side: Mountain Panorama Profile with Labeled Peaks in Python, R, Julia and JavaScript.
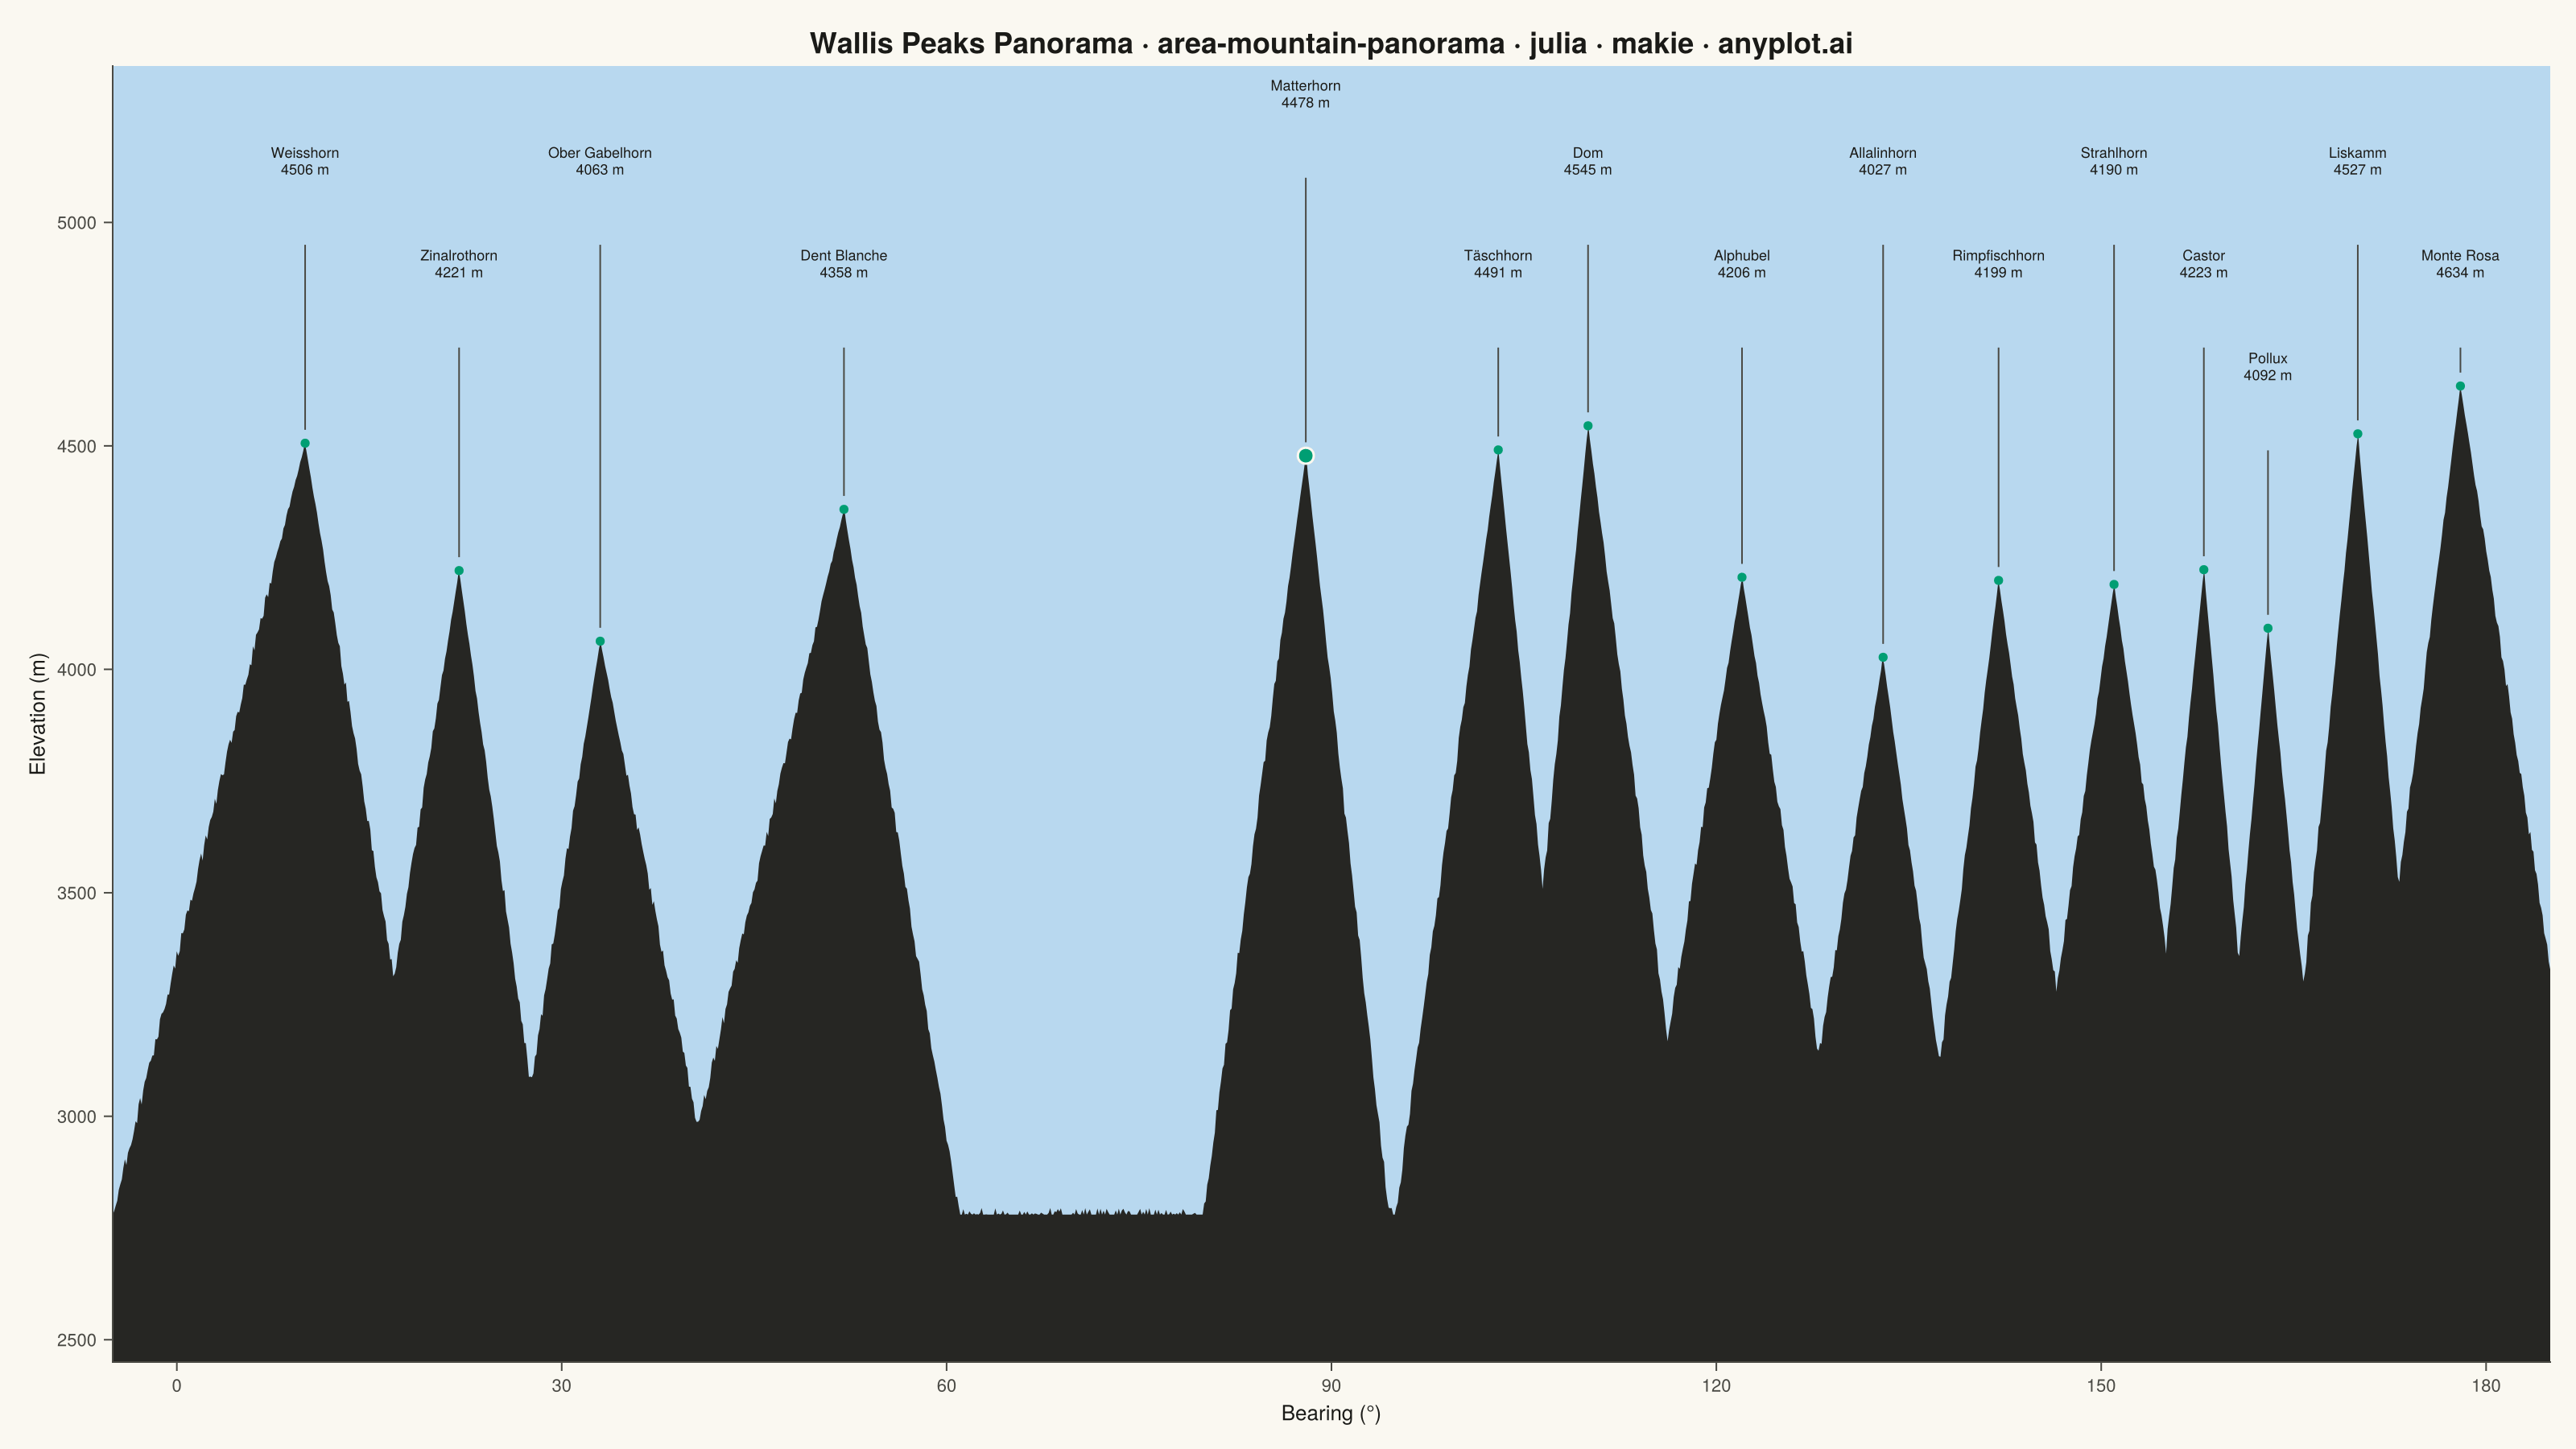
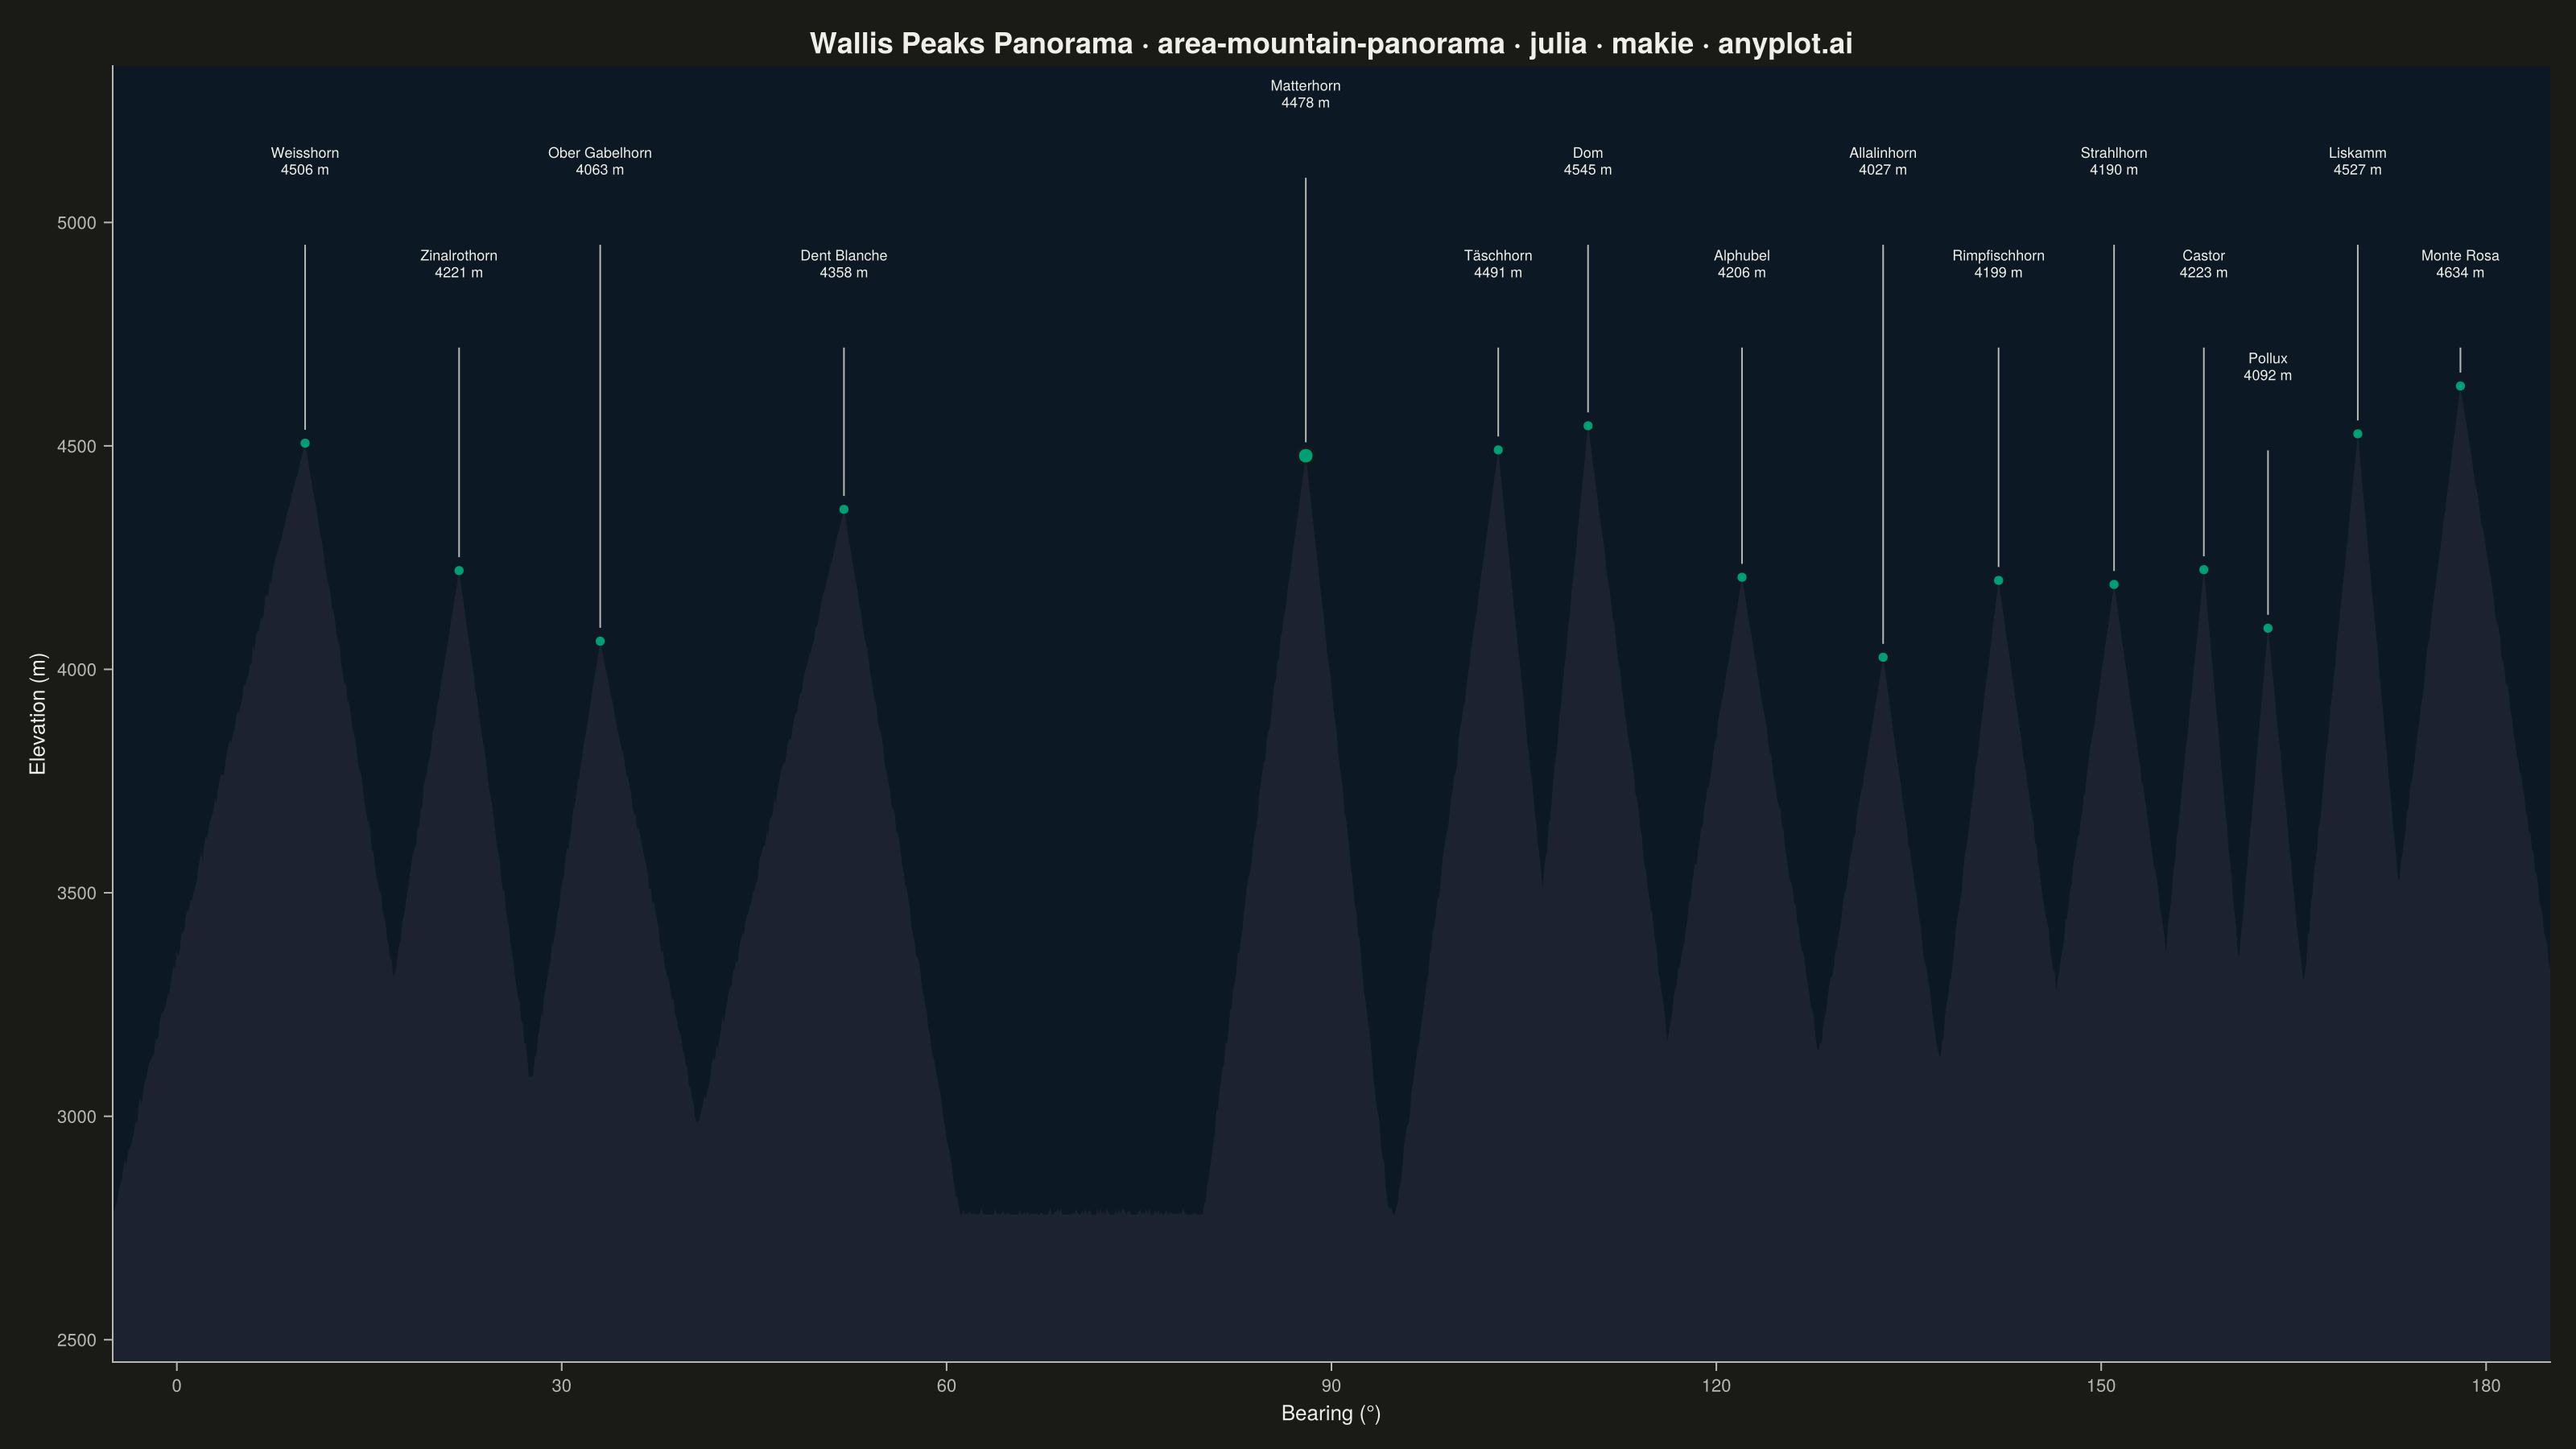
A panoramic mountain silhouette chart that renders the horizon as seen from a fixed vantage point, like a photograph of a ridgeline against the sky. A filled area under the skyline curve traces the ridgeline across a horizontal viewing range (in degrees of bearing or horizontal distance), and major summits are annotated with their name and elevation. The skyline is jagged and angular — sharp triangular peaks with steep, often asymmetric flanks meeting at pointed apexes, connected by rugged ridges with cols, sub-peaks and rocky notches — not a sequence of smooth bell-shaped bumps. Unlike an elevation-profile-along-a-trail, this plot is the angular view of the surrounding peaks from a single observer, making it ideal for summit-identification infographics, alpine panoramas, and travel guides.
# anyplot.ai
# area-mountain-panorama: Mountain Panorama Profile with Labeled Peaks
# Library: makie 0.21.9 | Julia 1.11.9
# Quality: 80/100 | Created: 2026-06-30

using CairoMakie
using Colors
using Random

Random.seed!(42)

const THEME    = get(ENV, "ANYPLOT_THEME", "light")
const PAGE_BG  = THEME == "light" ? colorant"#FAF8F1" : colorant"#1A1A17"
const INK      = THEME == "light" ? colorant"#1A1A17" : colorant"#F0EFE8"
const INK_SOFT = THEME == "light" ? colorant"#4A4A44" : colorant"#B8B7B0"
const SKY_BG   = THEME == "light" ? colorant"#B8D8EF" : colorant"#0D1825"
# Dark-mode luminance bumped to #324060 so silhouette reads clearly against navy sky
const MTN_FILL = THEME == "light" ? colorant"#262623" : colorant"#324060"
const BRAND    = colorant"#009E73"

# Peaks: (angle_deg, elevation_m, name, left_slope_deg, right_slope_deg)
# Panorama from Gornergrat-area vantage, sweeping west to east
const PEAKS = [
    ( 10.0, 4506.0, "Weisshorn",      15.0, 10.0),
    ( 22.0, 4221.0, "Zinalrothorn",    8.0,  7.0),
    ( 33.0, 4063.0, "Ober Gabelhorn",  7.0,  9.0),
    ( 52.0, 4358.0, "Dent Blanche",   13.0,  9.0),
    ( 88.0, 4478.0, "Matterhorn",      8.0,  6.5),
    (103.0, 4491.0, "Täschhorn",       8.0,  6.0),
    (110.0, 4545.0, "Dom",             6.0,  8.0),
    (122.0, 4206.0, "Alphubel",        8.0,  8.0),
    (133.0, 4027.0, "Allalinhorn",     7.0,  6.0),
    (142.0, 4199.0, "Rimpfischhorn",   6.0,  7.0),
    (151.0, 4190.0, "Strahlhorn",      7.0,  7.0),
    (158.0, 4223.0, "Castor",          5.0,  4.5),
    (163.0, 4092.0, "Pollux",          4.0,  4.5),
    (170.0, 4527.0, "Liskamm",         6.0,  5.5),
    (178.0, 4634.0, "Monte Rosa",      8.0, 10.0),
]

# Staggered label heights — alternating levels prevent overlap across 15 dense peaks
const LABEL_YS = [
    5100.0,  # Weisshorn
    4870.0,  # Zinalrothorn
    5100.0,  # Ober Gabelhorn
    4870.0,  # Dent Blanche
    5250.0,  # Matterhorn (focal point — highest label)
    4870.0,  # Täschhorn
    5100.0,  # Dom
    4870.0,  # Alphubel
    5100.0,  # Allalinhorn
    4870.0,  # Rimpfischhorn
    5100.0,  # Strahlhorn
    4870.0,  # Castor
    4640.0,  # Pollux (close to Castor — lowered further)
    5100.0,  # Liskamm
    4870.0,  # Monte Rosa
]

const BASELINE = 2780.0
const N        = 1600

angles = collect(LinRange(-5.0, 185.0, N))

# Asymmetric tent function: sharp triangular peak, linear flanks
function tent(ang, pa, pe, lw, rw)
    dx = ang - pa
    (dx <= -lw || dx >= rw) && return BASELINE
    return dx < 0 ? BASELINE + (pe - BASELINE) * (dx + lw) / lw :
                    pe  - (pe  - BASELINE) * dx / rw
end

# Ridgeline = max of all tent functions
ridgeline = [maximum(tent(a, pa, pe, lw, rw) for (pa, pe, pname, lw, rw) in PEAKS)
             for a in angles]

# Midpoint-displacement jaggedness, damped near summits to preserve sharp apexes
jitter = 30.0 .* (rand(N) .- 0.5)
for (pa, pe, pname, lw, rw) in PEAKS
    for i in eachindex(angles)
        d = abs(angles[i] - pa)
        d < 3.0 && (jitter[i] *= d / 3.0)
    end
end
ridgeline .+= jitter

# Restore exact summit elevations after jitter
for (pa, pe, pname, lw, rw) in PEAKS
    ridgeline[argmin(abs.(angles .- pa))] = pe
end
ridgeline = max.(ridgeline, BASELINE)

# Silhouette polygon: ridgeline + closed base
sil_pts = [Point2f(a, r) for (a, r) in zip(angles, ridgeline)]
push!(sil_pts, Point2f(Float32(angles[end]), 2400.0f0))
push!(sil_pts, Point2f(Float32(angles[1]),   2400.0f0))

# Composite Makie theme — consolidates all chrome into one reusable Theme object
const ANYPLOT_MAKIE_THEME = Theme(
    fontsize        = 14,
    backgroundcolor = PAGE_BG,
    Axis = (
        backgroundcolor   = SKY_BG,
        titlecolor        = INK,
        xlabelcolor       = INK,
        ylabelcolor       = INK,
        xticklabelcolor   = INK_SOFT,
        yticklabelcolor   = INK_SOFT,
        xtickcolor        = INK_SOFT,
        ytickcolor        = INK_SOFT,
        leftspinecolor    = INK_SOFT,
        bottomspinecolor  = INK_SOFT,
        topspinevisible   = false,
        rightspinevisible = false,
        xgridvisible      = false,
        ygridvisible      = false,
    ),
)

with_theme(ANYPLOT_MAKIE_THEME) do
    title_str = "Wallis Peaks Panorama · area-mountain-panorama · julia · makie · anyplot.ai"
    title_sz  = max(11, round(Int, 20 * 67 / length(title_str)))

    fig = Figure(size = (1600, 900), backgroundcolor = PAGE_BG)

    # Makie layout: subtitle Label sits above the axis panel in row 0
    Label(fig[0, 1], "Swiss Alps · Wallis Region · Gornergrat Vantage · 3100 m";
          fontsize = 11, color = INK_SOFT, tellwidth = false)
    rowgap!(fig.layout, 1, 2)

    ax = Axis(
        fig[1, 1];
        title          = title_str,
        titlesize      = title_sz,
        xlabel         = "Bearing (°)",
        ylabel         = "Elevation (m)",
        xlabelsize     = 13,
        ylabelsize     = 13,
        xticklabelsize = 11,
        yticklabelsize = 11,
        xticks         = 0:30:180,
        yticks         = 2500:500:5000,
    )

    xlims!(ax, -5.0, 185.0)
    ylims!(ax, 2450.0, 5350.0)

    # Mountain silhouette fill
    poly!(ax, sil_pts; color = MTN_FILL, strokewidth = 0)

    # Peak markers and staggered labels with leader lines
    for (i, (pa, pe, name, lw, rw)) in enumerate(PEAKS)
        is_matterhorn = (name == "Matterhorn")
        ms = is_matterhorn ? 14 : 8
        sw = is_matterhorn ? 1.5 : 0.0
        scatter!(ax, [pa], [pe]; color = BRAND, markersize = ms,
                 strokewidth = sw, strokecolor = PAGE_BG)

        lh = LABEL_YS[i]
        lines!(ax, [pa, pa], [pe + 30.0, lh - 150.0]; color = INK_SOFT, linewidth = 1.0)
        text!(ax, pa, lh; text = "$(name)\n$(Int(pe)) m",
              color = INK, fontsize = 11, align = (:center, :bottom))
    end

    save("plot-$(THEME).png", fig; px_per_unit = 2)
end
Runnable source as JSON, for any HTTP client: https://api.anyplot.ai/specs/area-mountain-panorama/makie/code. Any spec id and library id listed in llms-full.txt fit the same URL shape; every URL below is complete and callable.
{
  "spec_id": "area-mountain-panorama",
  "language": "julia",
  "library": "makie",
  "page": "https://anyplot.ai/area-mountain-panorama/julia/makie",
  "hub": "https://anyplot.ai/area-mountain-panorama",
  "code_json": "https://api.anyplot.ai/specs/area-mountain-panorama/makie/code",
  "spec_json": "https://api.anyplot.ai/specs/area-mountain-panorama",
  "render_light_png": "https://storage.googleapis.com/anyplot-images/plots/area-mountain-panorama/julia/makie/plot-light.png",
  "render_dark_png": "https://storage.googleapis.com/anyplot-images/plots/area-mountain-panorama/julia/makie/plot-dark.png",
  "quality_score": 80.0,
  "license": "MIT",
  "guide": "https://anyplot.ai/llms.txt"
}
Part of Mountain Panorama Profile with Labeled Peaks on anyplot.ai.