The same plot in 14 other libraries — JavaScript: Chart.js, D3.js, Highcharts, MUI X Charts; Python: Altair, Bokeh, lets-plot, Matplotlib, Plotly, plotnine, Pygal, Seaborn; R: ggplot2; Julia: Makie.jl. Compare all 15 side by side: Mountain Panorama Profile with Labeled Peaks in Python, R, Julia and JavaScript.
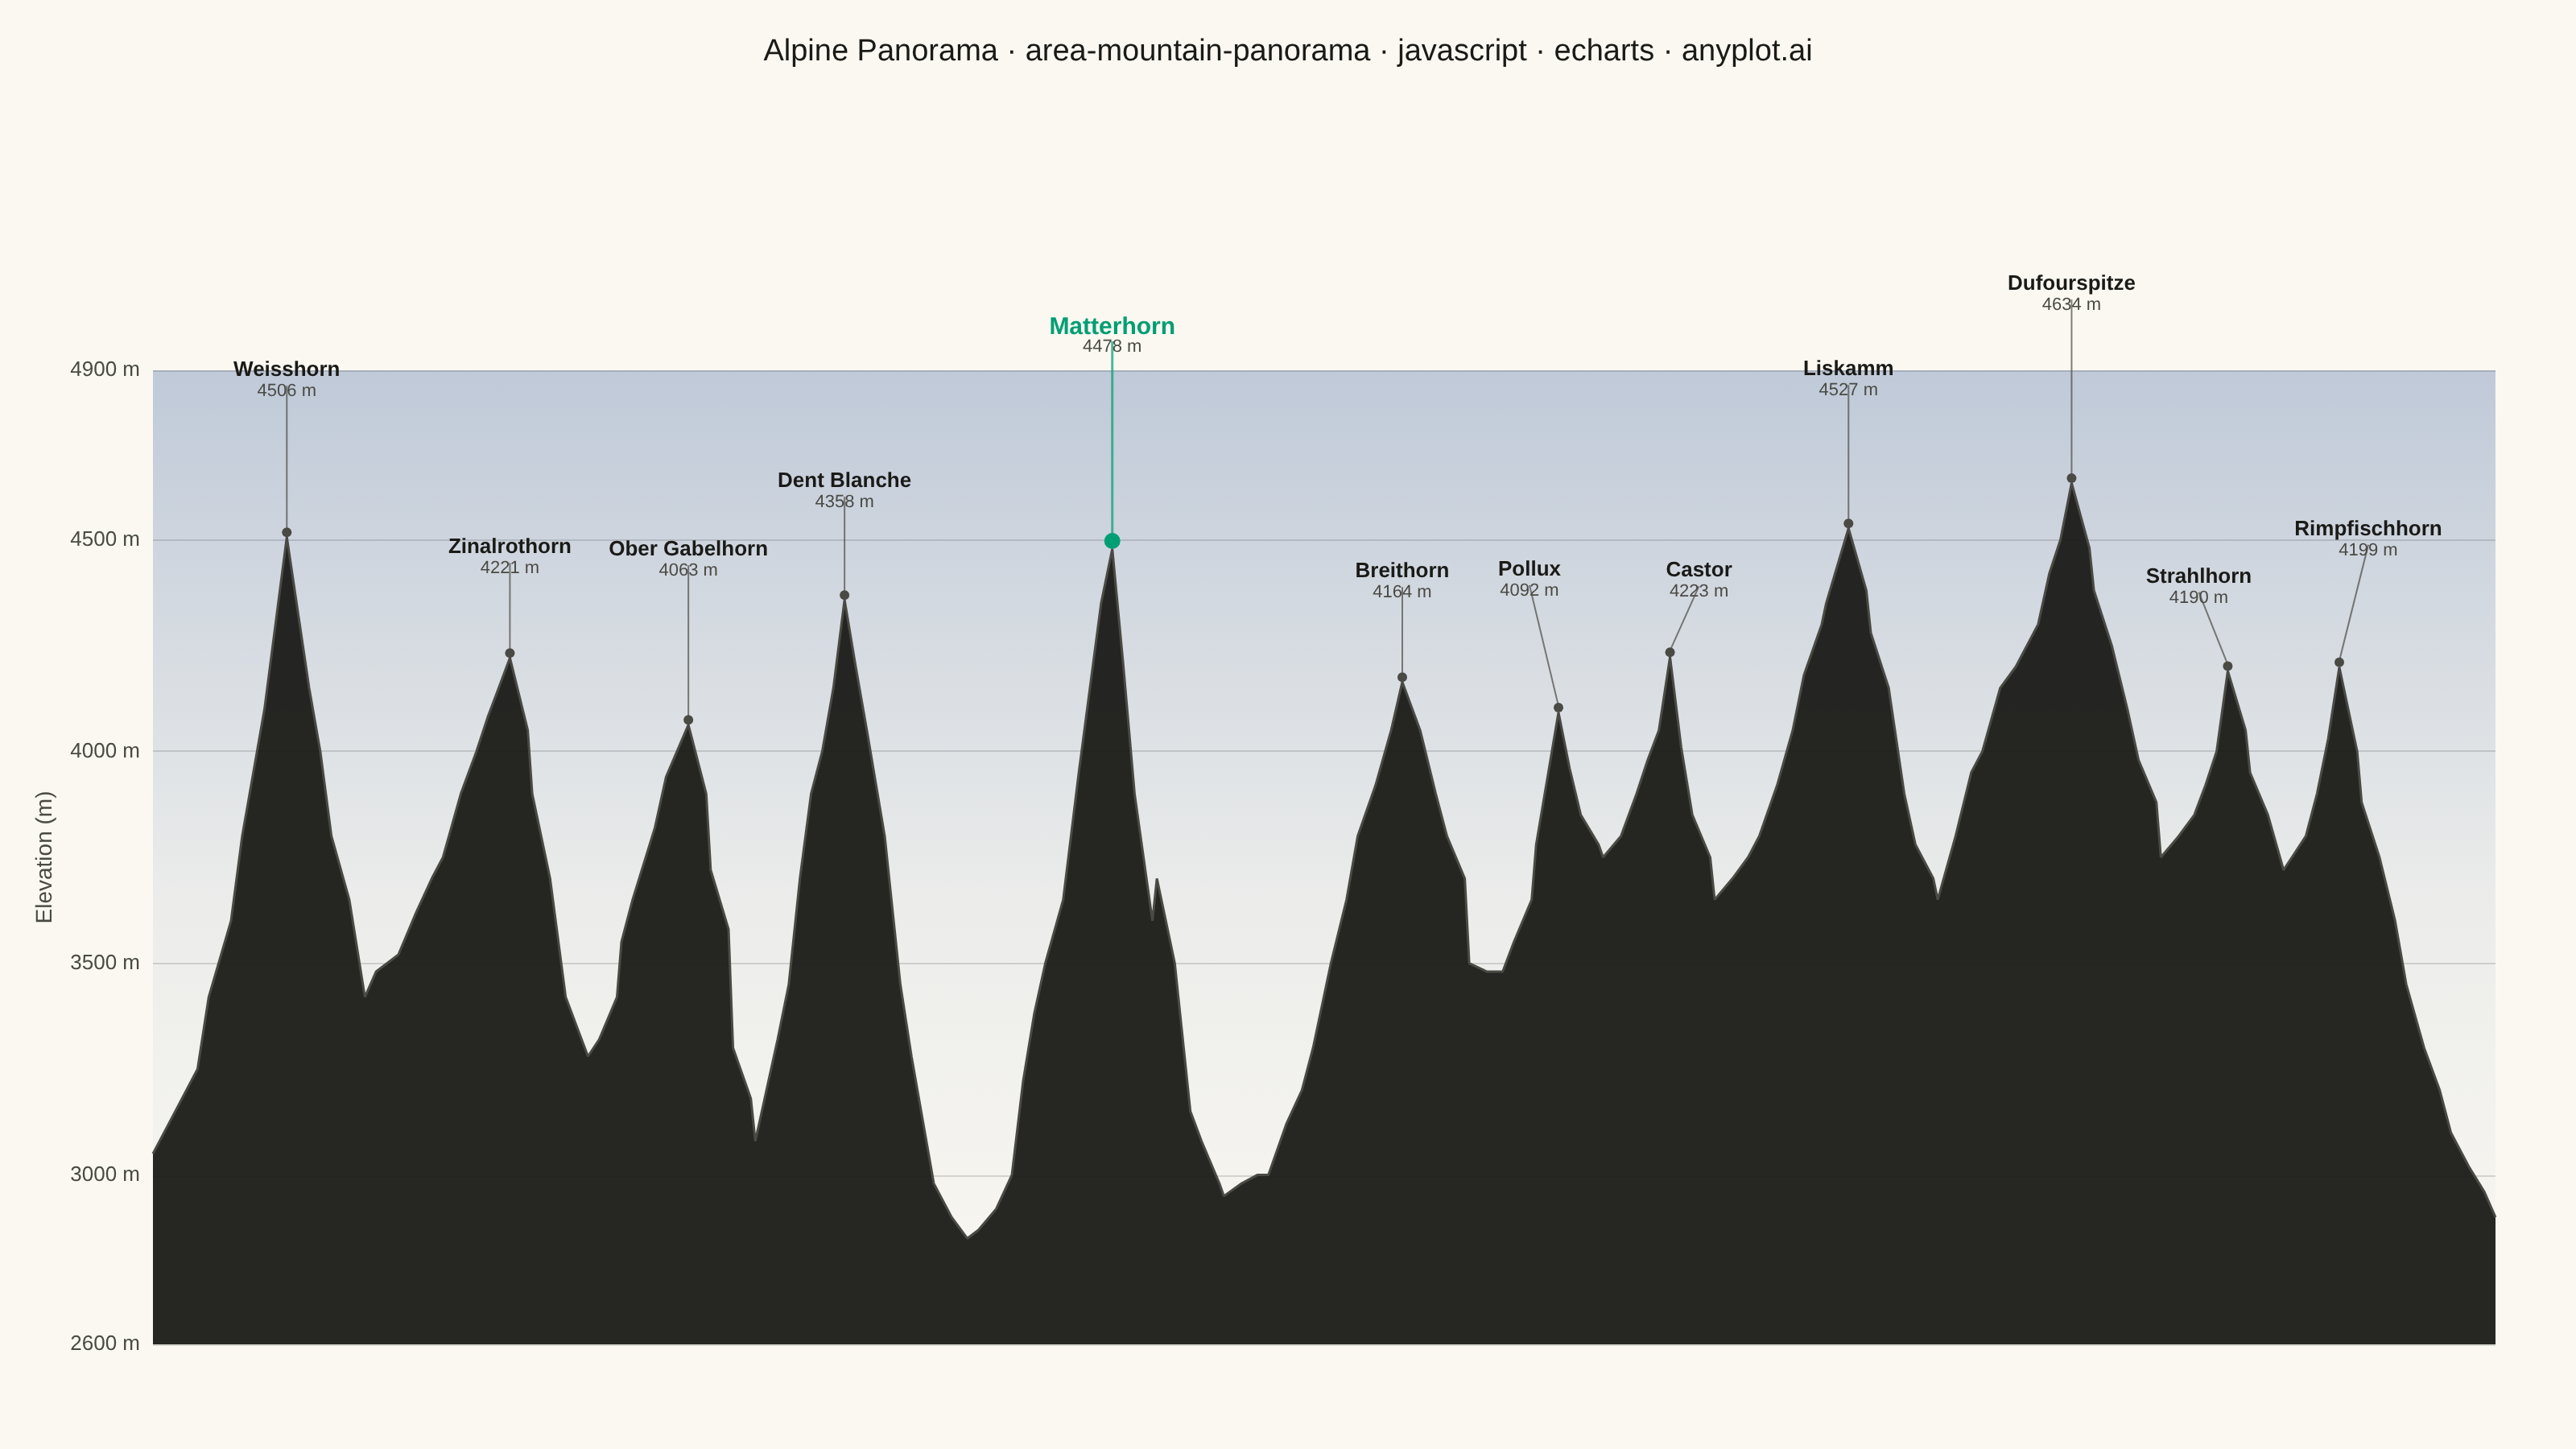
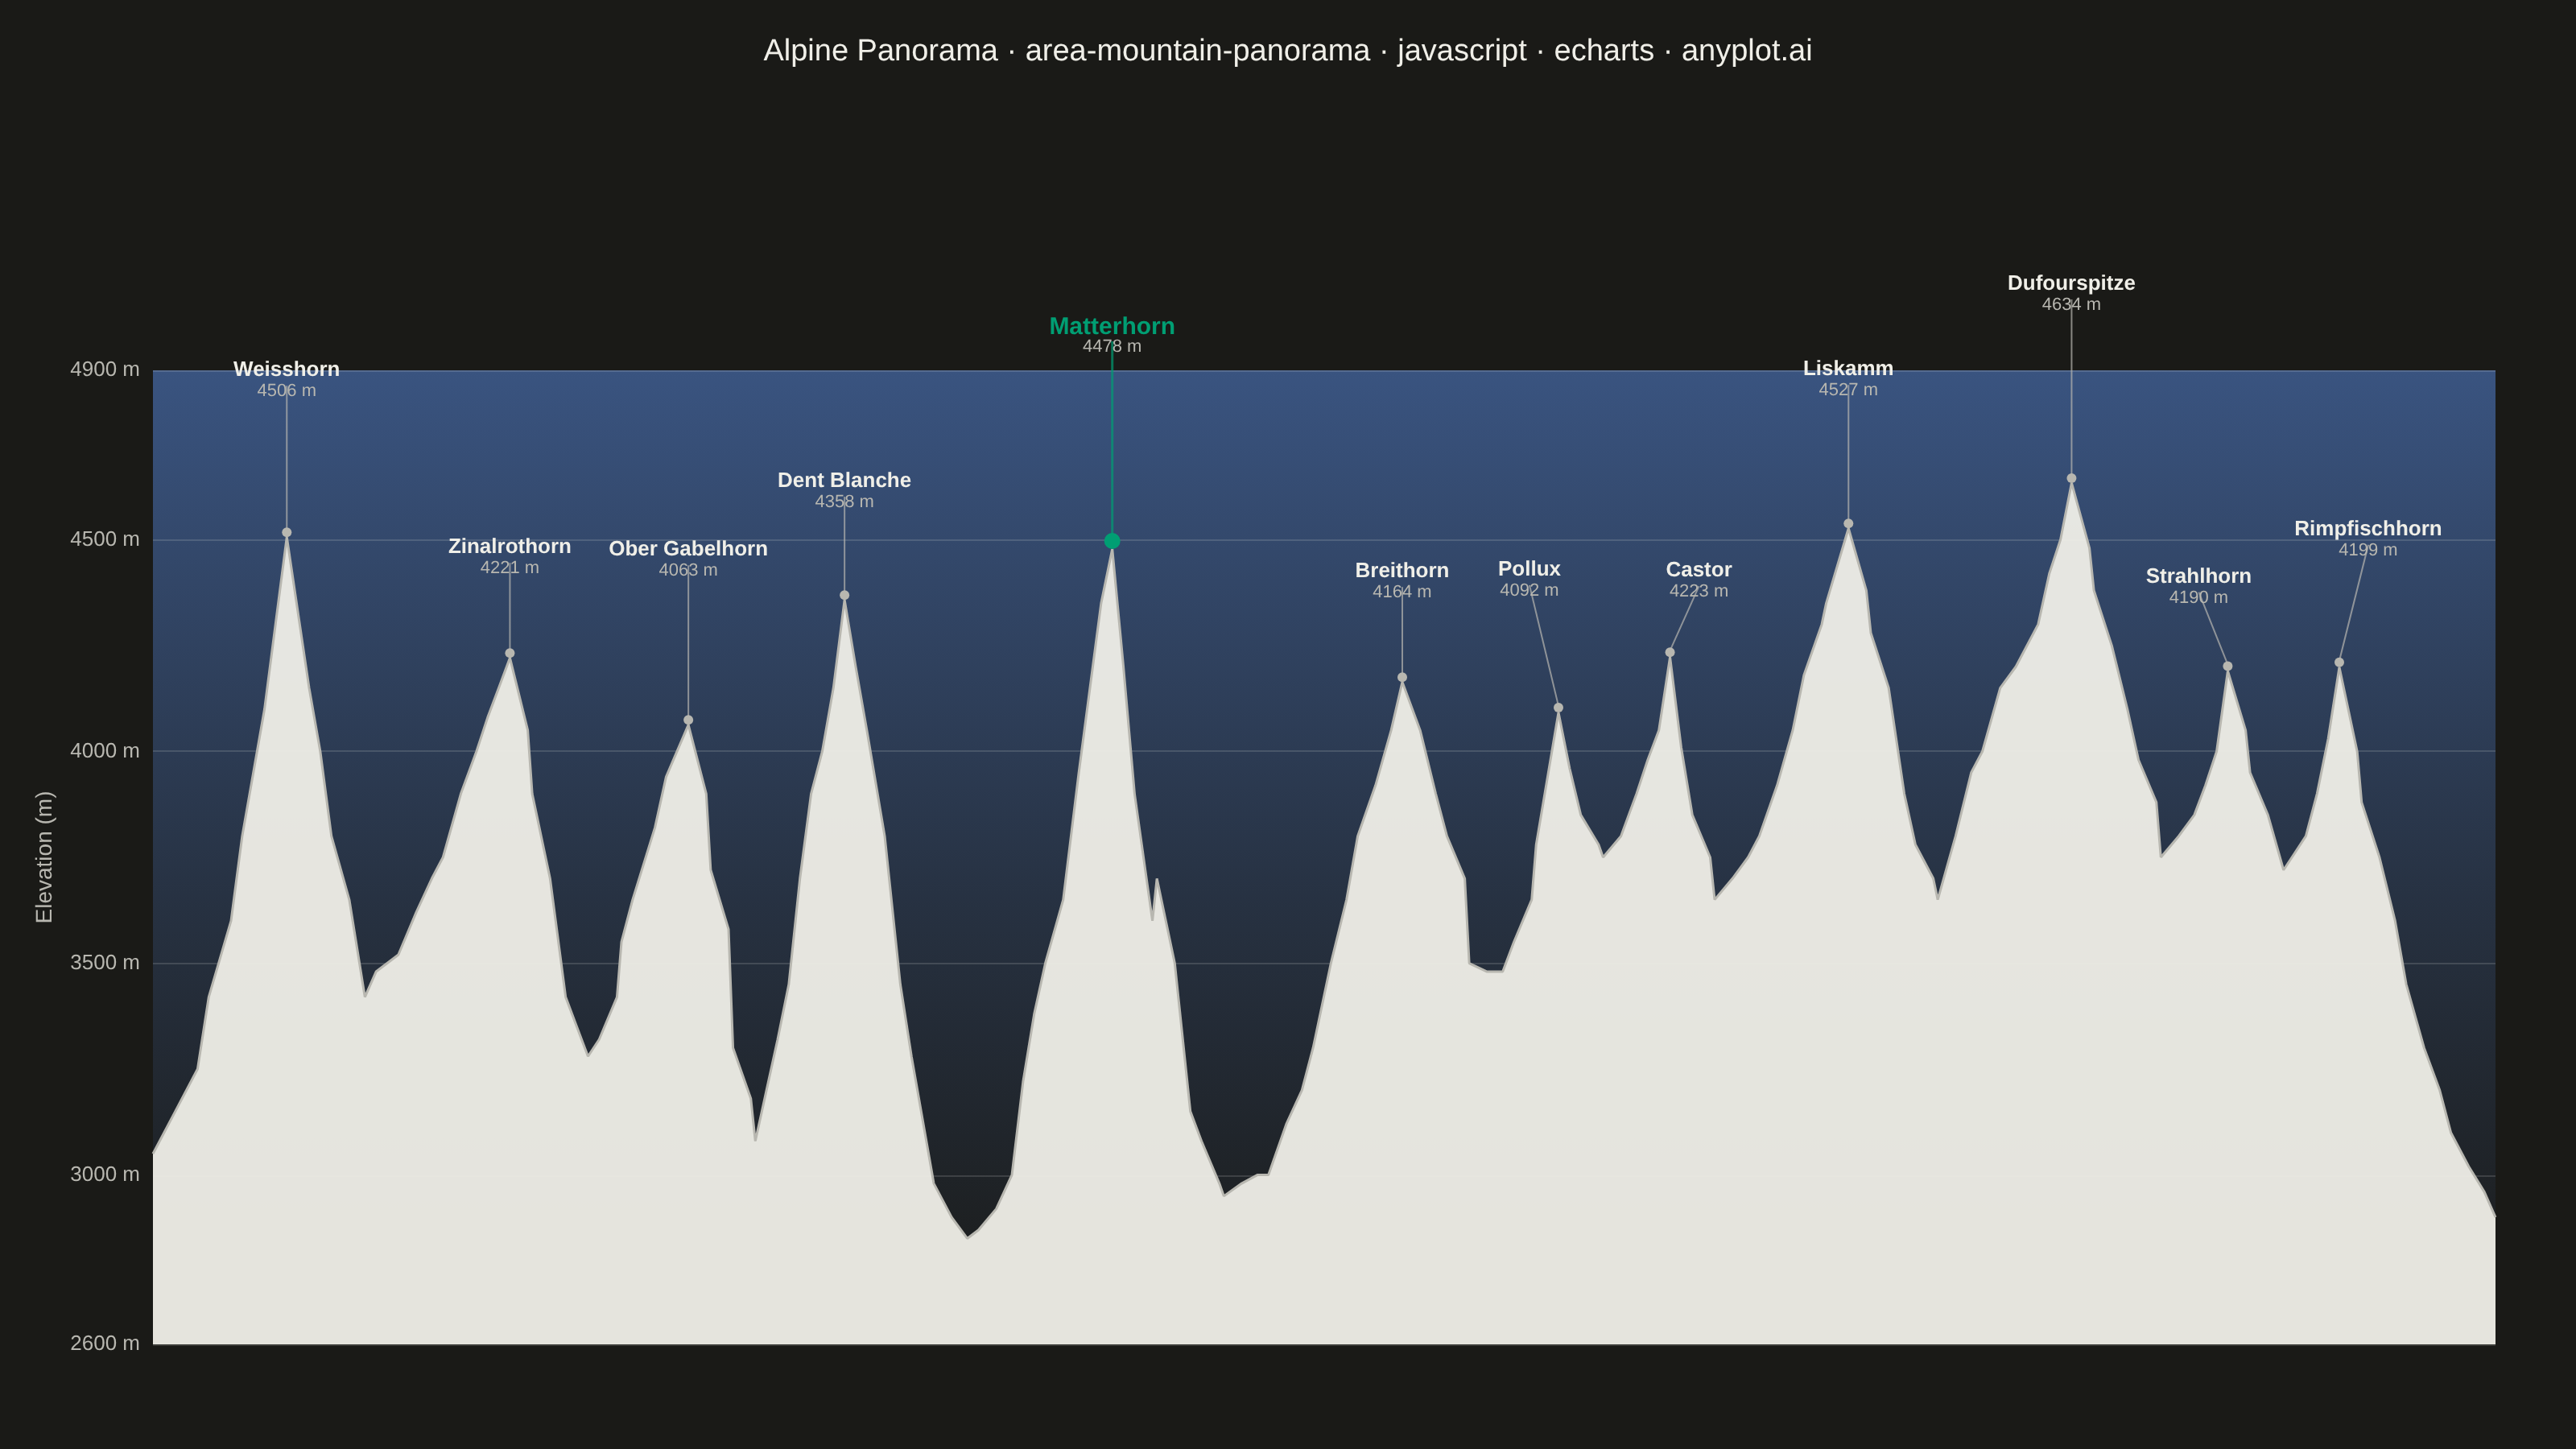
A panoramic mountain silhouette chart that renders the horizon as seen from a fixed vantage point, like a photograph of a ridgeline against the sky. A filled area under the skyline curve traces the ridgeline across a horizontal viewing range (in degrees of bearing or horizontal distance), and major summits are annotated with their name and elevation. The skyline is jagged and angular — sharp triangular peaks with steep, often asymmetric flanks meeting at pointed apexes, connected by rugged ridges with cols, sub-peaks and rocky notches — not a sequence of smooth bell-shaped bumps. Unlike an elevation-profile-along-a-trail, this plot is the angular view of the surrounding peaks from a single observer, making it ideal for summit-identification infographics, alpine panoramas, and travel guides.
// anyplot.ai
// area-mountain-panorama: Mountain Panorama Profile with Labeled Peaks
// Library: echarts 5.5.1 | JavaScript 22.23.0
// Quality: 91/100 | Created: 2026-06-30

const t = window.ANYPLOT_TOKENS;
const THEME = window.ANYPLOT_THEME || 'light';

// Wallis (Valais) panorama from Zermatt — Weisshorn to Rimpfischhorn
// peaks: [bearing_deg, elevation_m, name]
const peaks = [
  [6,   4506, "Weisshorn"],
  [16,  4221, "Zinalrothorn"],
  [24,  4063, "Ober Gabelhorn"],
  [31,  4358, "Dent Blanche"],
  [43,  4478, "Matterhorn"],
  [56,  4164, "Breithorn"],
  [63,  4092, "Pollux"],
  [68,  4223, "Castor"],
  [76,  4527, "Liskamm"],
  [86,  4634, "Dufourspitze"],
  [93,  4190, "Strahlhorn"],
  [98,  4199, "Rimpfischhorn"],
];
const MATTERHORN_IDX = 4;

// Piecewise-linear ridgeline — sharp triangular peaks with inter-summit jaggedness
const ridgePoints = [
  [0, 3050], [1, 3150], [2, 3250], [2.5, 3420], [3.5, 3600], [4, 3800], [5, 4100],
  [6, 4506],
  [7, 4150], [7.5, 4000], [8, 3800], [8.8, 3650], [9.5, 3420], [10, 3480], [11, 3520],
  [11.8, 3620], [12.5, 3700], [13, 3750], [13.8, 3900], [14.5, 4000], [15, 4080], [15.5, 4150],
  [16, 4221],
  [16.8, 4050], [17, 3900], [17.8, 3700], [18.5, 3420], [19, 3350], [19.5, 3280],
  [20, 3320], [20.8, 3420], [21, 3550], [21.5, 3650], [22.5, 3820], [23, 3940],
  [24, 4063],
  [24.8, 3900], [25, 3720], [25.8, 3580], [26, 3300], [26.8, 3180], [27, 3080],
  [27.5, 3200], [28, 3320], [28.5, 3450], [29, 3700], [29.5, 3900], [30, 4000], [30.5, 4150],
  [31, 4358],
  [31.5, 4200], [32, 4050], [32.8, 3800], [33.5, 3450], [34, 3280], [35, 2980],
  [35.8, 2900], [36.5, 2850], [37, 2870], [37.8, 2920], [38.5, 3000], [39, 3220], [39.5, 3380],
  [40, 3500], [40.8, 3650], [41.5, 3950], [42, 4150], [42.5, 4350],
  [43, 4478],
  [43.5, 4200], [44, 3900], [44.8, 3600], [45, 3700], [45.8, 3500], [46.5, 3150],
  [47, 3080], [47.8, 2980], [48, 2950],
  [48.8, 2980], [49.5, 3000], [50, 3000], [50.8, 3120], [51.5, 3200], [52, 3300],
  [52.8, 3500], [53.5, 3650], [54, 3800], [54.8, 3920], [55.5, 4050],
  [56, 4164],
  [56.8, 4050], [57.5, 3900], [58, 3800], [58.8, 3700], [59, 3500],
  [59.8, 3480], [60.5, 3480], [61, 3550], [61.8, 3650], [62, 3780],
  [63, 4092],
  [63.5, 3960], [64, 3850], [64.8, 3780], [65, 3750],
  [65.8, 3800], [66.5, 3900], [67, 3980], [67.5, 4050],
  [68, 4223],
  [68.5, 4010], [69, 3850], [69.8, 3750], [70, 3650], [70.8, 3700], [71.5, 3750],
  [72, 3800], [72.8, 3920], [73.5, 4050], [74, 4180], [74.8, 4300], [75, 4350],
  [76, 4527],
  [76.8, 4380], [77, 4280], [77.8, 4150], [78.5, 3900], [79, 3780], [79.8, 3700],
  [80, 3650], [80.8, 3800], [81.5, 3950], [82, 4000], [82.8, 4150], [83.5, 4200], [84.5, 4300],
  [85, 4420], [85.5, 4500],
  [86, 4634],
  [86.8, 4480], [87, 4380], [87.8, 4250], [88.5, 4100], [89, 3980], [89.8, 3880],
  [90, 3750], [90.8, 3800], [91.5, 3850], [92, 3920], [92.5, 4000],
  [93, 4190],
  [93.8, 4050], [94, 3950], [94.8, 3850], [95.5, 3720], [96, 3760], [96.5, 3800],
  [97, 3900], [97.5, 4030],
  [98, 4199],
  [98.8, 4000], [99, 3880],
  [99.8, 3750], [100.5, 3600], [101, 3450], [101.8, 3300], [102.5, 3200], [103, 3100],
  [103.8, 3020], [104.5, 2960], [105, 2900],
];

// Sky gradient — Imprint blue (#4467A3, palette[2]) layered as background series
const skyTopColor = THEME === 'dark' ? 'rgba(68,103,163,0.75)' : 'rgba(68,103,163,0.32)';
const skyMidColor = THEME === 'dark' ? 'rgba(68,103,163,0.30)' : 'rgba(68,103,163,0.08)';

// Mountain silhouette — theme-adaptive ink tokens (no custom hex values)
const fillColor = t.ink;
const ridgeColor = t.inkSoft;

// Imprint palette position 1 — highlight the focal Matterhorn peak
const BRAND = t.palette[0]; // #009E73

const titleText = "Alpine Panorama · area-mountain-panorama · javascript · echarts · anyplot.ai";
const titleFontSize = Math.max(14, Math.round(22 * Math.min(1.0, 67 / titleText.length)));

const chart = echarts.init(document.getElementById("container"));

chart.setOption({
  animation: false,
  color: t.palette,
  backgroundColor: t.pageBg,
  title: {
    text: titleText,
    left: 'center',
    top: 18,
    textStyle: { color: t.ink, fontSize: titleFontSize, fontWeight: 'normal' },
  },
  grid: {
    left: 95,
    right: 50,
    top: 230,
    bottom: 65,
  },
  xAxis: {
    type: 'value',
    min: 0,
    max: 105,
    show: false,
  },
  yAxis: {
    type: 'value',
    min: 2600,
    max: 4900,
    name: 'Elevation (m)',
    nameLocation: 'middle',
    nameGap: 60,
    nameTextStyle: { color: t.inkSoft, fontSize: 14 },
    axisLabel: {
      color: t.inkSoft,
      fontSize: 13,
      formatter: (v) => `${v} m`,
    },
    axisLine: { show: false },
    axisTick: { show: false },
    splitLine: { lineStyle: { color: t.grid, width: 1 } },
  },
  series: [
    {
      // Sky gradient — Imprint blue layered as background series behind mountain
      type: 'line',
      data: [[0, 4900], [105, 4900]],
      smooth: false,
      symbol: 'none',
      lineStyle: { width: 0, opacity: 0 },
      areaStyle: {
        color: {
          type: 'linear', x: 0, y: 0, x2: 0, y2: 1,
          colorStops: [
            { offset: 0,    color: skyTopColor },
            { offset: 0.55, color: skyMidColor },
            { offset: 1,    color: 'rgba(68,103,163,0)' },
          ],
        },
        opacity: 1,
      },
      z: -1,
    },
    {
      // Mountain silhouette
      type: 'line',
      data: ridgePoints,
      smooth: false,
      symbol: 'none',
      lineStyle: { color: ridgeColor, width: 1.5 },
      areaStyle: {
        color: fillColor,
        opacity: 0.95,
      },
      z: 0,
    },
  ],
});

// Peak annotations: staggered leader lines + two-line labels (name + elevation)
// Wider xShifts for dense clusters (Pollux/Castor, Strahlhorn/Rimpfischhorn)
const yOffsets = [110,  75, 115,  80, 145,  75,  95,  60, 105, 130,  65,  92];
const xShifts  = [  0,   0,   0,   0,   0,   0, -18, +18,   0,   0, -18, +18];

const graphics = [];
peaks.forEach(([angle, elev, name], i) => {
  const result = chart.convertToPixel('grid', [angle, elev]);
  if (!result) return;
  const [px, py] = result;

  const ly = py - yOffsets[i];
  const lx = px + xShifts[i];
  const isMH = (i === MATTERHORN_IDX);

  const dotColor     = isMH ? BRAND : t.inkSoft;
  const lineStroke   = isMH ? BRAND : t.inkSoft;
  const dotR         = isMH ? 5 : 3;
  const nameFill     = isMH ? BRAND : t.ink;
  const nameFontSize = isMH ? 15 : 13;
  const lineWidth    = isMH ? 1.5 : 1;

  // Leader line: from just above summit dot to just below elevation label
  graphics.push({
    type: 'line',
    z: 20,
    shape: { x1: px, y1: py - dotR - 1, x2: lx, y2: ly + 16 },
    style: { stroke: lineStroke, lineWidth, opacity: 0.7 },
  });

  // Summit dot
  graphics.push({
    type: 'circle',
    z: 20,
    shape: { cx: px, cy: py - dotR, r: dotR },
    style: { fill: dotColor, stroke: 'none' },
  });

  // Peak name (bold, baseline at ly)
  graphics.push({
    type: 'text',
    z: 20,
    x: lx,
    y: ly,
    style: {
      text: name,
      textAlign: 'center',
      textBaseline: 'bottom',
      fill: nameFill,
      fontSize: nameFontSize,
      fontWeight: 'bold',
    },
  });

  // Elevation — 14px gap below name baseline for breathing room
  graphics.push({
    type: 'text',
    z: 20,
    x: lx,
    y: ly + 14,
    style: {
      text: `${elev} m`,
      textAlign: 'center',
      textBaseline: 'top',
      fill: t.inkSoft,
      fontSize: 11,
    },
  });
});

chart.setOption({ graphic: graphics });
Runnable source as JSON, for any HTTP client: https://api.anyplot.ai/specs/area-mountain-panorama/echarts/code. Any spec id and library id listed in llms-full.txt fit the same URL shape; every URL below is complete and callable.
{
  "spec_id": "area-mountain-panorama",
  "language": "javascript",
  "library": "echarts",
  "page": "https://anyplot.ai/area-mountain-panorama/javascript/echarts",
  "hub": "https://anyplot.ai/area-mountain-panorama",
  "code_json": "https://api.anyplot.ai/specs/area-mountain-panorama/echarts/code",
  "spec_json": "https://api.anyplot.ai/specs/area-mountain-panorama",
  "render_light_png": "https://storage.googleapis.com/anyplot-images/plots/area-mountain-panorama/javascript/echarts/plot-light.png",
  "render_dark_png": "https://storage.googleapis.com/anyplot-images/plots/area-mountain-panorama/javascript/echarts/plot-dark.png",
  "interactive_light_html": "https://storage.googleapis.com/anyplot-images/plots/area-mountain-panorama/javascript/echarts/plot-light.html",
  "interactive_dark_html": "https://storage.googleapis.com/anyplot-images/plots/area-mountain-panorama/javascript/echarts/plot-dark.html",
  "quality_score": 91.0,
  "license": "MIT",
  "guide": "https://anyplot.ai/llms.txt"
}
Part of Mountain Panorama Profile with Labeled Peaks on anyplot.ai.