The same plot in 14 other libraries — JavaScript: Chart.js, D3.js, Apache ECharts, MUI X Charts; Python: Altair, Bokeh, lets-plot, Matplotlib, Plotly, plotnine, Pygal, Seaborn; R: ggplot2; Julia: Makie.jl. Compare all 15 side by side: Mountain Panorama Profile with Labeled Peaks in Python, R, Julia and JavaScript.
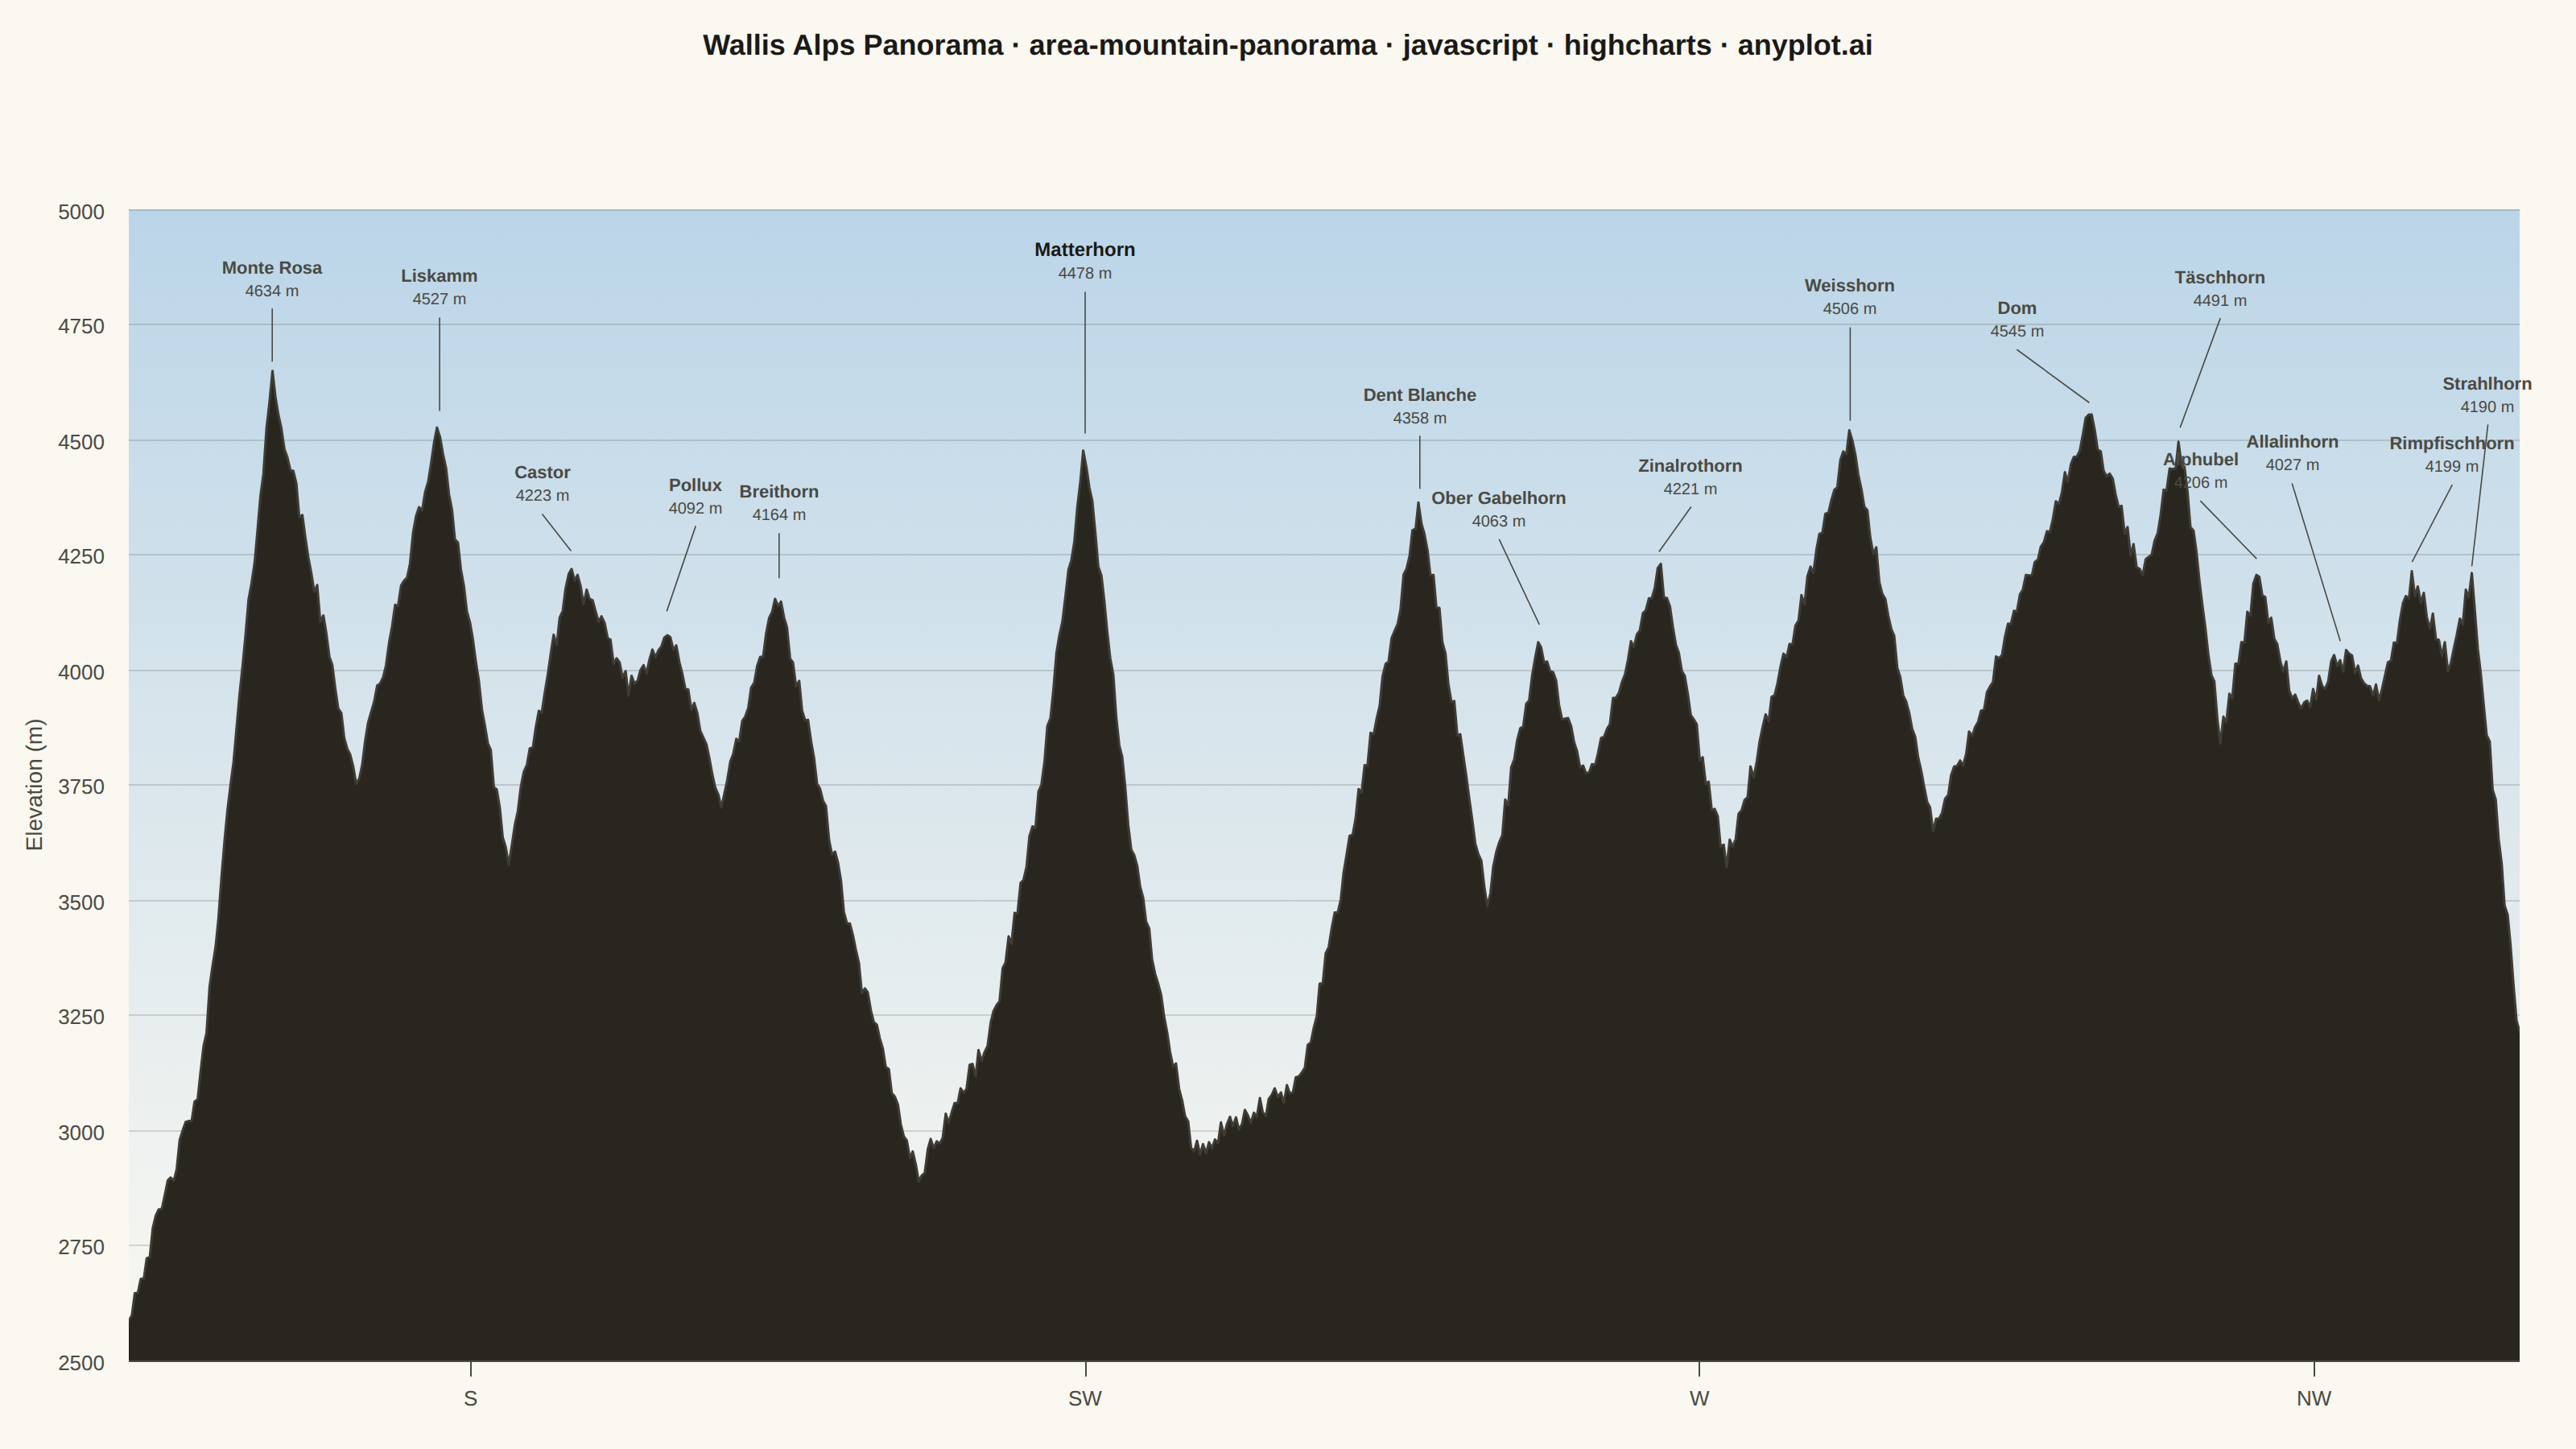
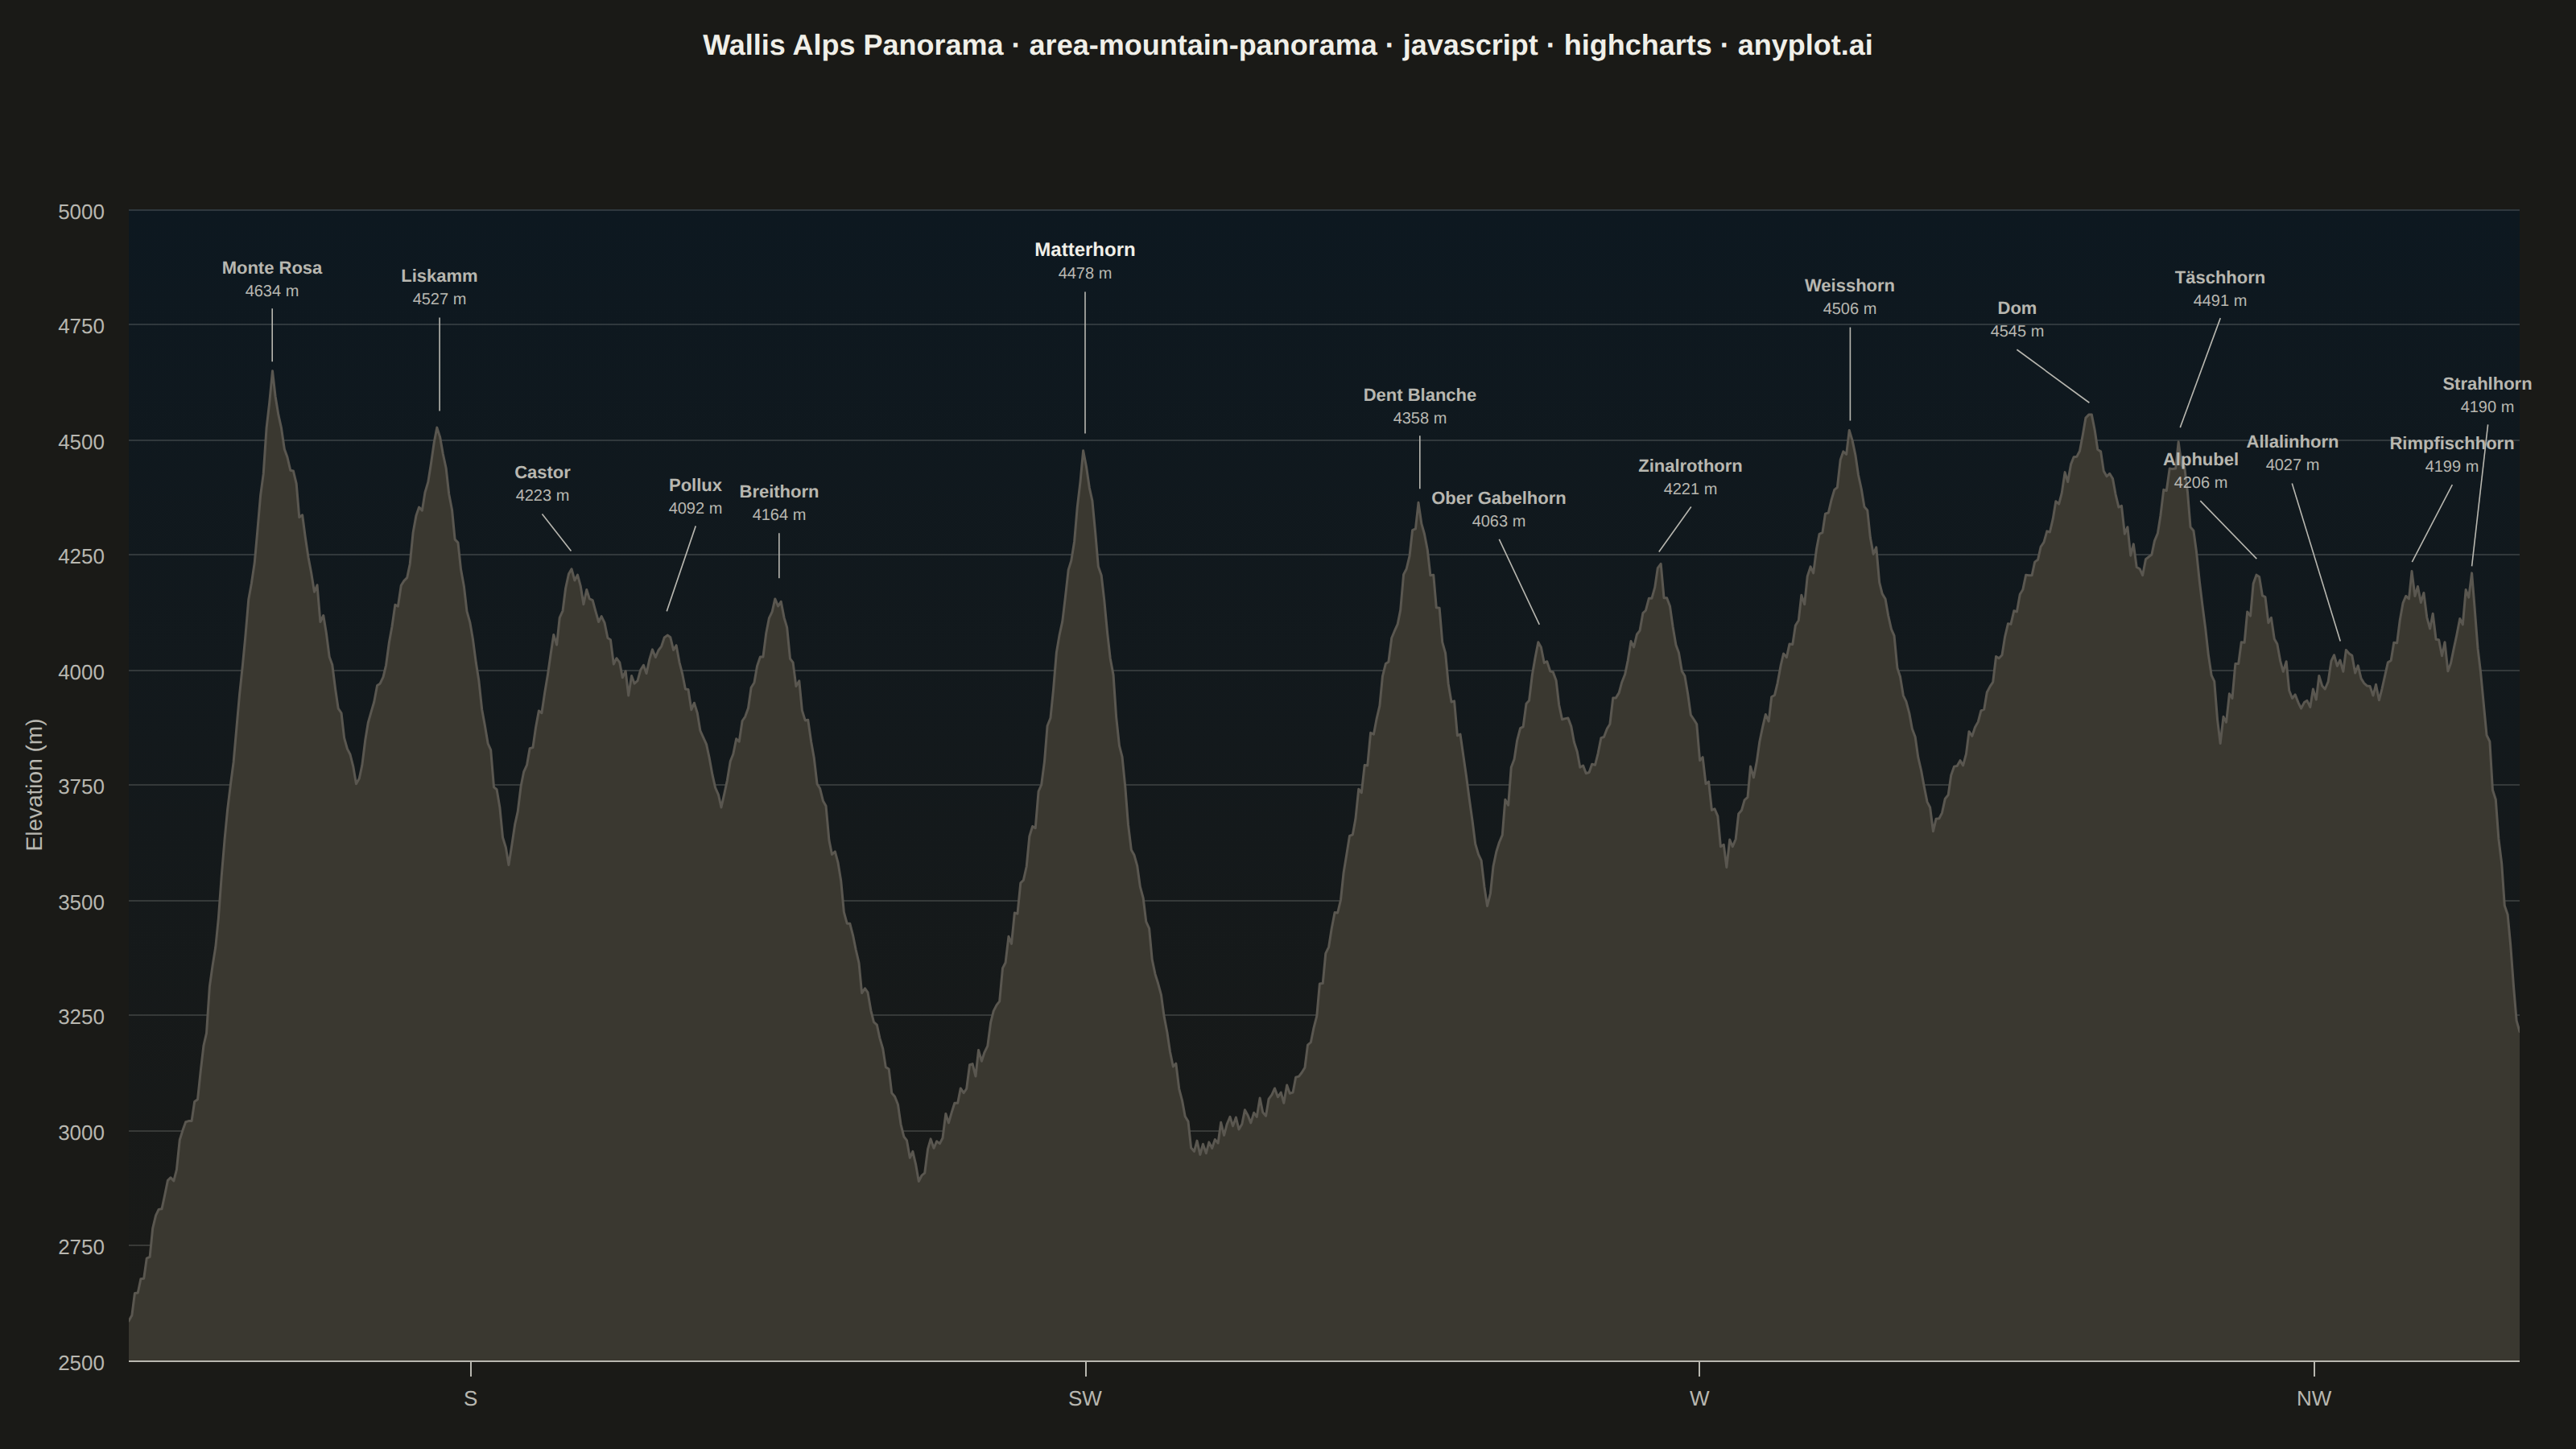
A panoramic mountain silhouette chart that renders the horizon as seen from a fixed vantage point, like a photograph of a ridgeline against the sky. A filled area under the skyline curve traces the ridgeline across a horizontal viewing range (in degrees of bearing or horizontal distance), and major summits are annotated with their name and elevation. The skyline is jagged and angular — sharp triangular peaks with steep, often asymmetric flanks meeting at pointed apexes, connected by rugged ridges with cols, sub-peaks and rocky notches — not a sequence of smooth bell-shaped bumps. Unlike an elevation-profile-along-a-trail, this plot is the angular view of the surrounding peaks from a single observer, making it ideal for summit-identification infographics, alpine panoramas, and travel guides.
// anyplot.ai
// area-mountain-panorama: Mountain Panorama Profile with Labeled Peaks
// Library: highcharts 12.6.0 | JavaScript 22.23.0
// Quality: 84/100 | Created: 2026-06-30

//# anyplot-orientation: landscape

const t = window.ANYPLOT_TOKENS;
const THEME = window.ANYPLOT_THEME;

// Spec requires 'dark solid color silhouette / evening/dusk feel' — rock and sky
// tones use thematic custom colors for geographic authenticity (justified by spec).
const ROCK_FILL  = THEME === "dark" ? "#3A3830" : "#29261F";
const ROCK_LINE  = THEME === "dark" ? "#5A5750" : "#3F3C35";
const SKY_TOP    = THEME === "dark" ? "#0D1820" : "#BBD5E8";
const SKY_BOTTOM = THEME === "dark" ? "#1A1A17" : "#FAF8F1";

// --- Ridgeline control points: [panorama_x (0–1000), elevation_m] ---
// Wallis (Valais) Alps panorama viewed from Gornergrat area — SSE to NNW
// x=0 ≈ 155° bearing (SSE), x=1000 ≈ 330° bearing (NNW)
const ctrlPts = [
  [0,    2600],
  [30,   3100],
  [60,   4634],  // Monte Rosa / Dufourspitze  4634 m
  [95,   3750],
  [130,  4527],  // Liskamm                    4527 m
  [158,  3580],
  [185,  4223],  // Castor                     4223 m
  [210,  3960],
  [225,  4092],  // Pollux                     4092 m
  [248,  3720],
  [272,  4164],  // Breithorn                  4164 m
  [305,  3350],
  [330,  2900],  // col toward Zermatt valley
  [360,  3200],
  [380,  3700],
  [400,  4478],  // Matterhorn — focal peak    4478 m
  [420,  3600],  // steep east flank
  [445,  2950],
  [490,  3100],
  [540,  4358],  // Dent Blanche               4358 m
  [568,  3500],
  [590,  4063],  // Ober Gabelhorn             4063 m
  [610,  3750],
  [640,  4221],  // Zinalrothorn               4221 m
  [668,  3580],
  [720,  4506],  // Weisshorn                  4506 m
  [755,  3650],
  [820,  4545],  // Dom                        4545 m (highest peak entirely in Switzerland)
  [842,  4200],
  [858,  4491],  // Täschhorn                  4491 m
  [875,  3850],
  [890,  4206],  // Alphubel                   4206 m
  [908,  3900],
  [925,  4027],  // Allalinhorn                4027 m
  [942,  3950],
  [955,  4199],  // Rimpfischhorn              4199 m
  [970,  4020],
  [980,  4190],  // Strahlhorn                 4190 m
  [1000, 3200],
];

// Piecewise-linear ridgeline with deterministic LCG noise (seed 42, sharp rocky texture)
let _lcgS = 42 >>> 0;
const ridgelineData = [];
for (let i = 0; i < 800; i++) {
  const x = (i / 799) * 1000;
  let lo = 0;
  for (let j = 0; j < ctrlPts.length - 1; j++) {
    if (ctrlPts[j][0] <= x) lo = j;
  }
  const hi = Math.min(lo + 1, ctrlPts.length - 1);
  const span = ctrlPts[hi][0] - ctrlPts[lo][0];
  const frac = span > 0 ? (x - ctrlPts[lo][0]) / span : 0;
  const elev = ctrlPts[lo][1] + frac * (ctrlPts[hi][1] - ctrlPts[lo][1]);
  _lcgS = (_lcgS * 1664525 + 1013904223) >>> 0;
  ridgelineData.push([Math.round(x * 10) / 10, Math.round(elev + (_lcgS / 4294967296 - 0.5) * 55)]);
}

// --- Peak annotations ---
// yOff: pixels above summit (negative = up); xOff: horizontal shift to stagger clustered labels
const annotatedPeaks = [
  { name: "Monte Rosa",     sub: "4634 m", x: 60,  elev: 4634, yOff: -65,  xOff: 0   },
  { name: "Liskamm",        sub: "4527 m", x: 130, elev: 4527, yOff: -90,  xOff: 0   },
  { name: "Castor",         sub: "4223 m", x: 185, elev: 4223, yOff: -55,  xOff: -18 },
  { name: "Pollux",         sub: "4092 m", x: 225, elev: 4092, yOff: -85,  xOff: 18  },
  { name: "Breithorn",      sub: "4164 m", x: 272, elev: 4164, yOff: -60,  xOff: 0   },
  { name: "Matterhorn",     sub: "4478 m", x: 400, elev: 4478, yOff: -120, xOff: 0   },
  { name: "Dent Blanche",   sub: "4358 m", x: 540, elev: 4358, yOff: -65,  xOff: 0   },
  { name: "Ober Gabelhorn", sub: "4063 m", x: 590, elev: 4063, yOff: -85,  xOff: -25 },
  { name: "Zinalrothorn",   sub: "4221 m", x: 640, elev: 4221, yOff: -60,  xOff: 20  },
  { name: "Weisshorn",      sub: "4506 m", x: 720, elev: 4506, yOff: -90,  xOff: 0   },
  { name: "Dom",            sub: "4545 m", x: 820, elev: 4545, yOff: -65,  xOff: -45 },
  { name: "Täschhorn",      sub: "4491 m", x: 858, elev: 4491, yOff: -100, xOff: 25  },
  { name: "Alphubel",       sub: "4206 m", x: 890, elev: 4206, yOff: -68,  xOff: -35 },
  { name: "Allalinhorn",    sub: "4027 m", x: 925, elev: 4027, yOff: -130, xOff: -30 },
  { name: "Rimpfischhorn",  sub: "4199 m", x: 955, elev: 4199, yOff: -80,  xOff: 25  },
  { name: "Strahlhorn",     sub: "4190 m", x: 980, elev: 4190, yOff: -120, xOff: 10  },
];

const TITLE =
  "Wallis Alps Panorama · area-mountain-panorama · javascript · highcharts · anyplot.ai";

// --- Chart ---
const chart = Highcharts.chart("container", {
  chart: {
    type: "area",
    backgroundColor: "transparent",
    plotBackgroundColor: {
      linearGradient: { x1: 0, y1: 0, x2: 0, y2: 1 },
      stops: [[0, SKY_TOP], [1, SKY_BOTTOM]],
    },
    animation: false,
    style: { fontFamily: "inherit" },
    margin: [130, 35, 55, 80],
  },
  credits: { enabled: false },
  colors: t.palette,
  title: {
    text: TITLE,
    style: { color: t.ink, fontSize: "18px", fontWeight: "600" },
    y: 24,
  },
  xAxis: {
    min: 0,
    max: 1000,
    // compass bearing labels at S=143, SW=400, W=657, NW=914
    tickPositions: [143, 400, 657, 914],
    labels: {
      formatter: function () {
        const compassLabels = { 143: "S", 400: "SW", 657: "W", 914: "NW" };
        return compassLabels[this.value] || "";
      },
      style: { color: t.inkSoft, fontSize: "13px" },
    },
    lineColor: t.inkSoft,
    tickColor: t.inkSoft,
    gridLineWidth: 0,
    title: { text: null },
  },
  yAxis: {
    min: 2500,
    title: {
      text: "Elevation (m)",
      style: { color: t.inkSoft, fontSize: "14px" },
    },
    lineColor: t.inkSoft,
    tickColor: t.inkSoft,
    gridLineColor: t.grid,
    labels: { style: { color: t.inkSoft, fontSize: "13px" } },
  },
  legend: { enabled: false },
  tooltip: { enabled: false },
  plotOptions: {
    series: { animation: false },
    area: {
      lineWidth: 1.5,
      lineColor: ROCK_LINE,
      fillColor: ROCK_FILL,
      marker: { enabled: false },
    },
  },
  series: [{ name: "Ridgeline", data: ridgelineData }],
});

// --- Peak annotations: thin leader lines + two-line labels via SVGRenderer ---
annotatedPeaks.forEach(function (peak) {
  const px = chart.xAxis[0].toPixels(peak.x, false);
  const py = chart.yAxis[0].toPixels(peak.elev, false);
  const lx = px + peak.xOff;
  const ly = py + peak.yOff;
  const isMatterhorn = peak.name === "Matterhorn";

  // Thin leader line from summit point to label anchor
  chart.renderer
    .path(["M", px, py - 10, "L", lx, ly + 22])
    .attr({ stroke: t.inkSoft, "stroke-width": 0.8, zIndex: 4 })
    .add();

  // Peak name — Matterhorn gets stronger visual weight as the focal peak
  chart.renderer
    .text(peak.name, lx, ly)
    .attr({ align: "center", zIndex: 5 })
    .css({
      color: isMatterhorn ? t.ink : t.inkSoft,
      fontSize: isMatterhorn ? "12px" : "11px",
      fontWeight: isMatterhorn ? "800" : "700",
    })
    .add();

  // Elevation sub-label
  chart.renderer
    .text(peak.sub, lx, ly + 14)
    .attr({ align: "center", zIndex: 5 })
    .css({ color: t.inkSoft, fontSize: "10px" })
    .add();
});
Runnable source as JSON, for any HTTP client: https://api.anyplot.ai/specs/area-mountain-panorama/highcharts/code. Any spec id and library id listed in llms-full.txt fit the same URL shape; every URL below is complete and callable.
{
  "spec_id": "area-mountain-panorama",
  "language": "javascript",
  "library": "highcharts",
  "page": "https://anyplot.ai/area-mountain-panorama/javascript/highcharts",
  "hub": "https://anyplot.ai/area-mountain-panorama",
  "code_json": "https://api.anyplot.ai/specs/area-mountain-panorama/highcharts/code",
  "spec_json": "https://api.anyplot.ai/specs/area-mountain-panorama",
  "render_light_png": "https://storage.googleapis.com/anyplot-images/plots/area-mountain-panorama/javascript/highcharts/plot-light.png",
  "render_dark_png": "https://storage.googleapis.com/anyplot-images/plots/area-mountain-panorama/javascript/highcharts/plot-dark.png",
  "interactive_light_html": "https://storage.googleapis.com/anyplot-images/plots/area-mountain-panorama/javascript/highcharts/plot-light.html",
  "interactive_dark_html": "https://storage.googleapis.com/anyplot-images/plots/area-mountain-panorama/javascript/highcharts/plot-dark.html",
  "quality_score": 84.0,
  "license": "MIT",
  "guide": "https://anyplot.ai/llms.txt"
}
Part of Mountain Panorama Profile with Labeled Peaks on anyplot.ai.