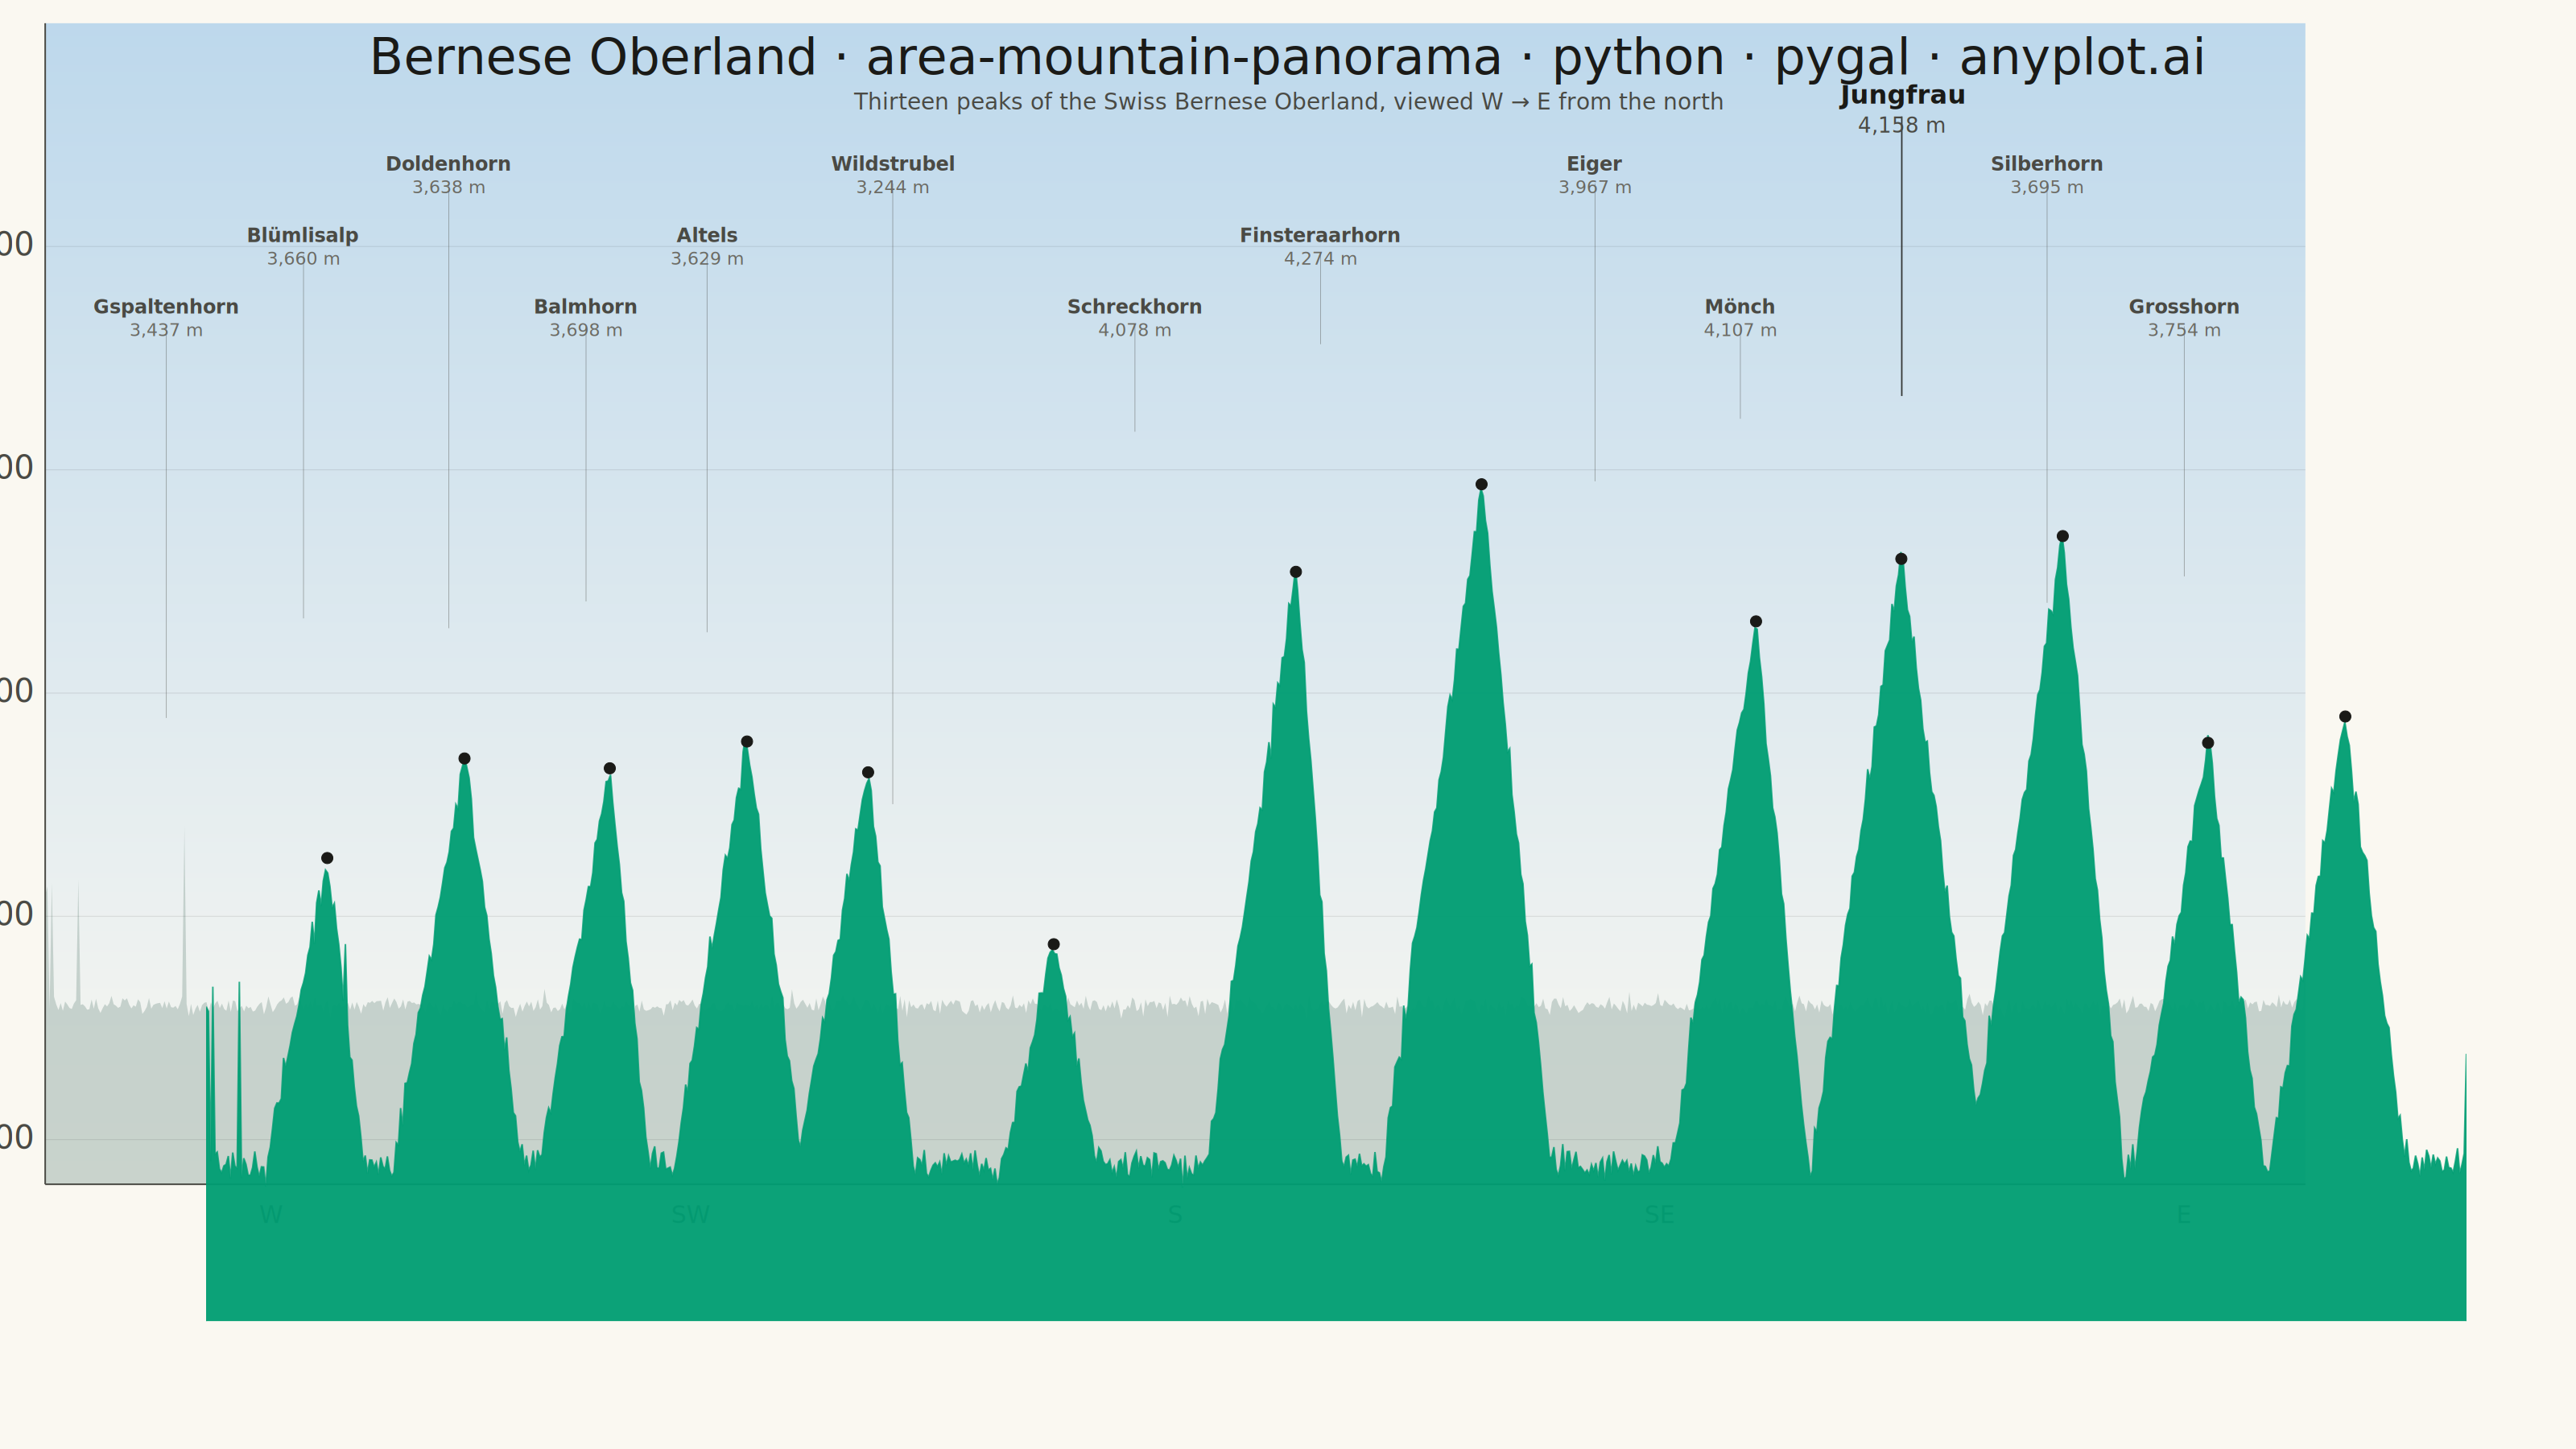
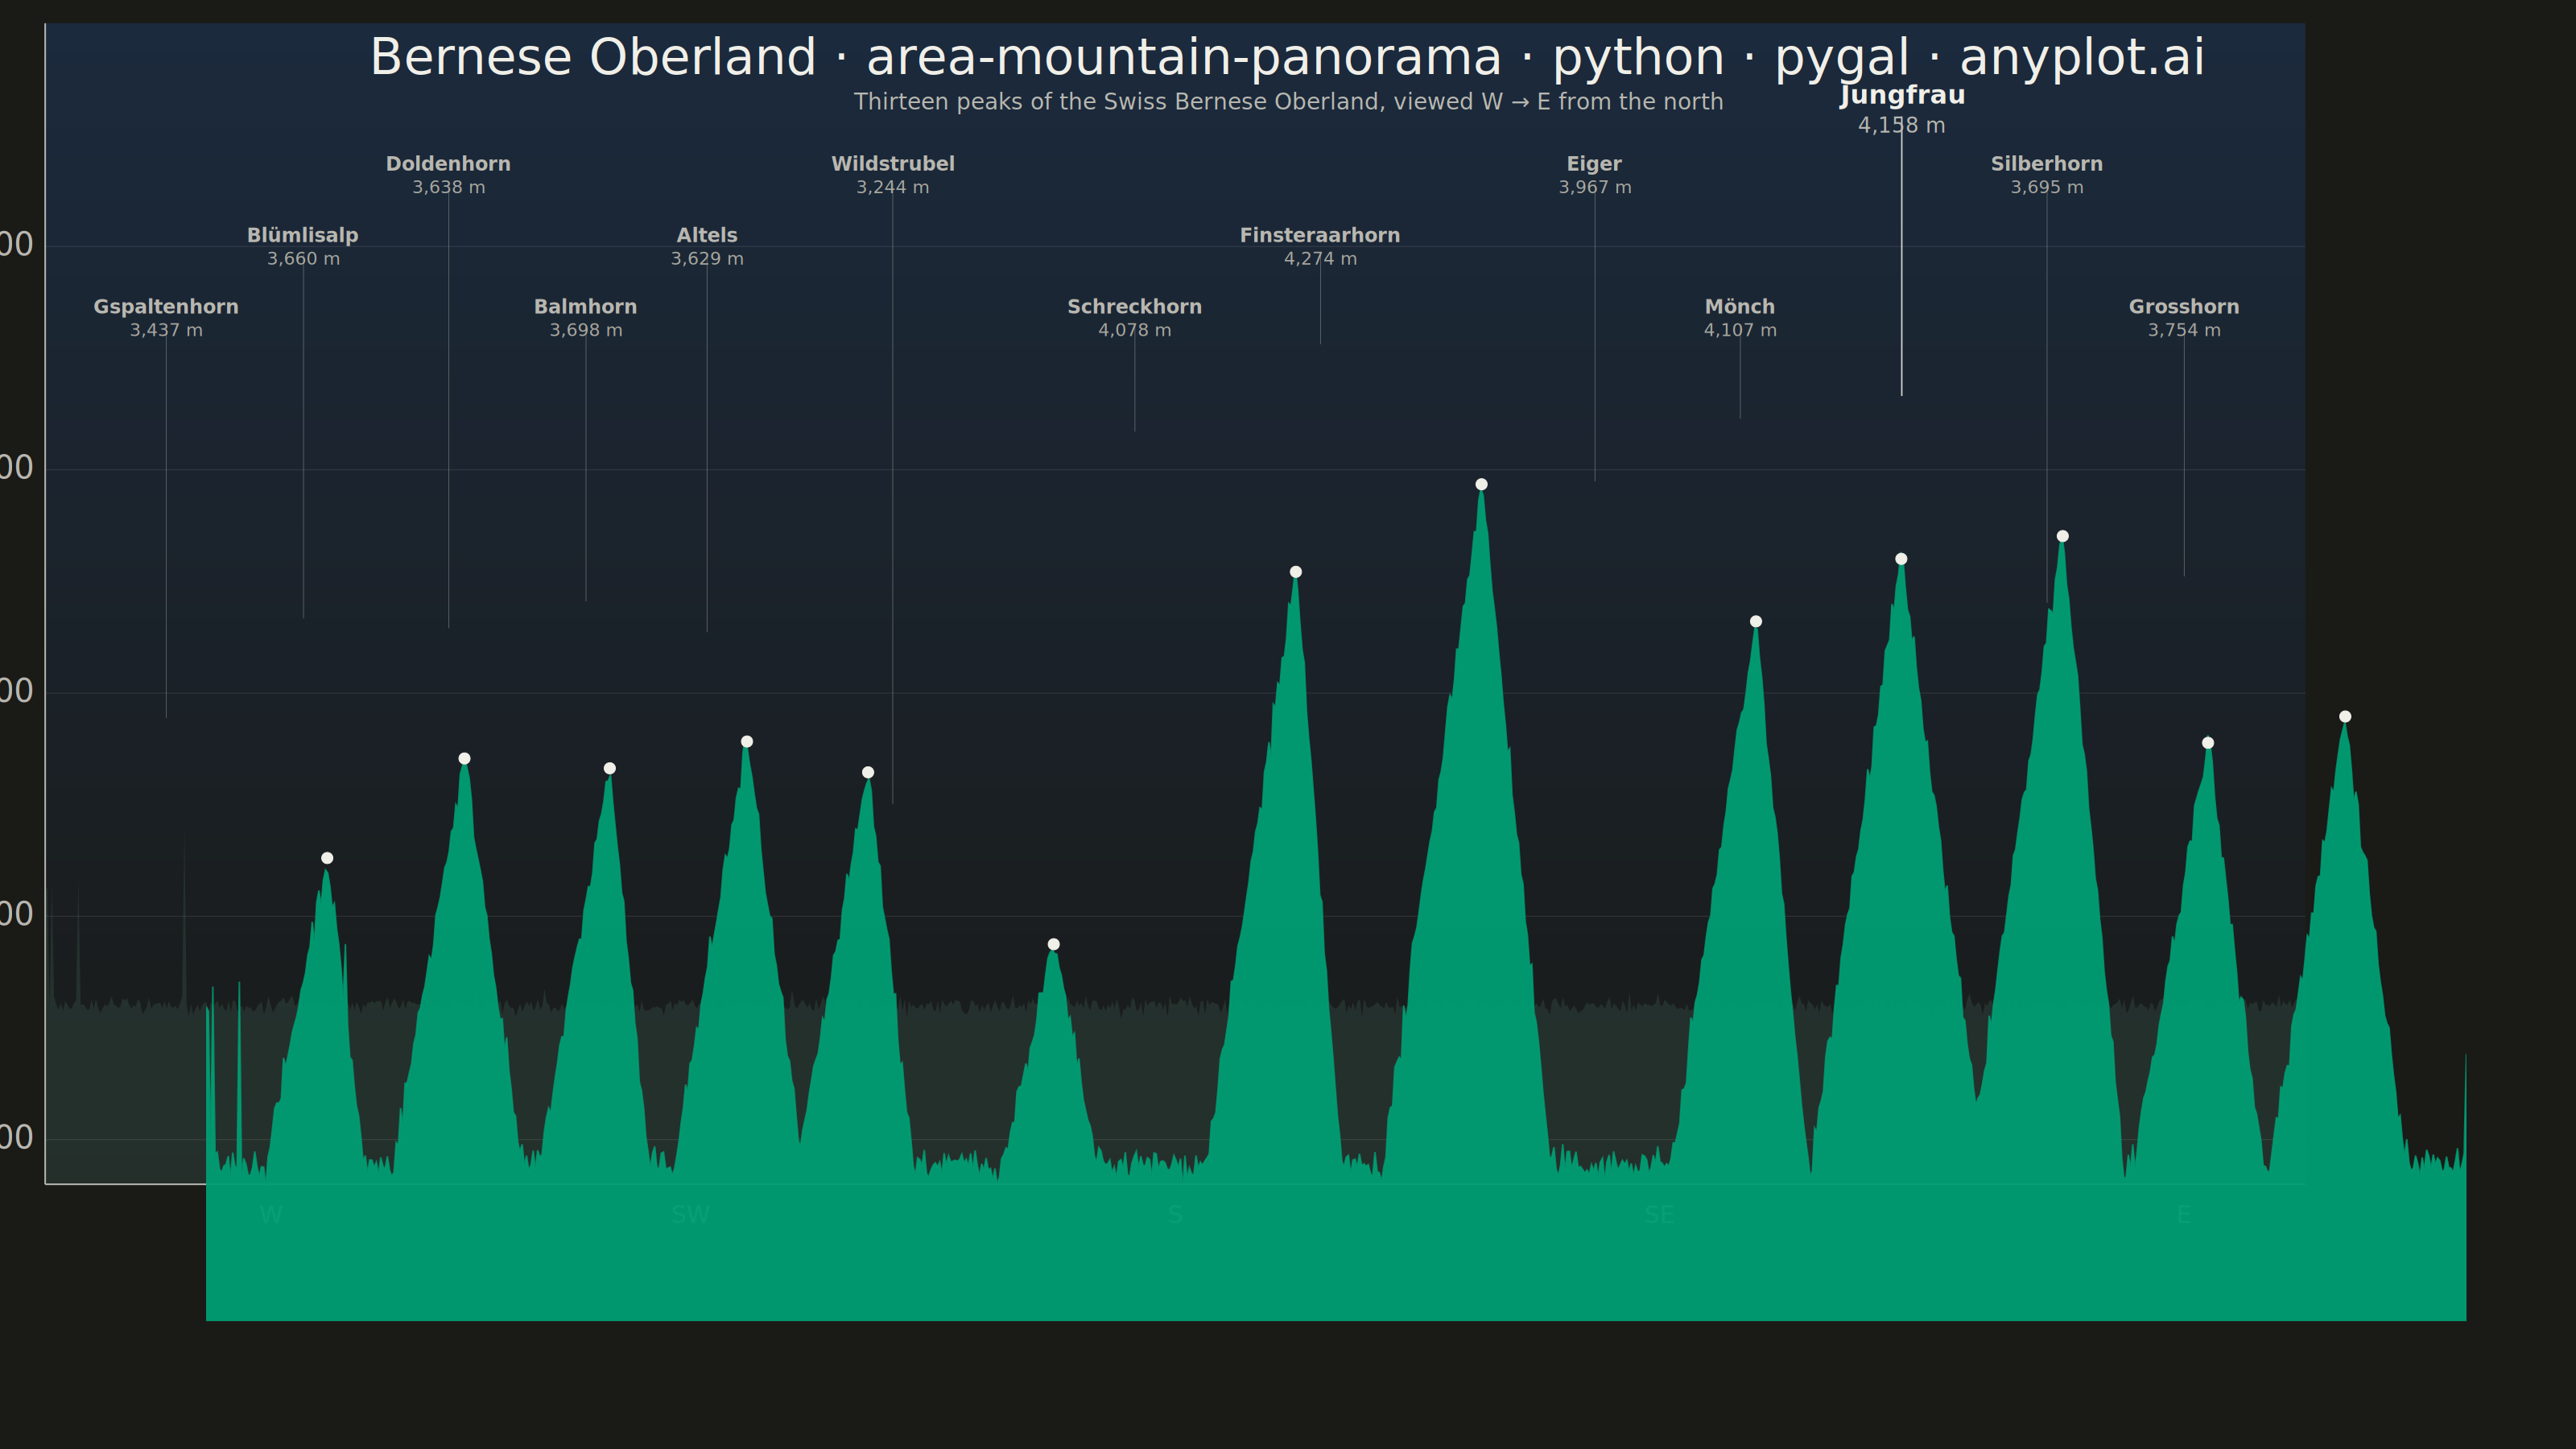
A panoramic mountain silhouette chart that renders the horizon as seen from a fixed vantage point, like a photograph of a ridgeline against the sky. A filled area under the skyline curve traces the ridgeline across a horizontal viewing range (in degrees of bearing or horizontal distance), and major summits are annotated with their name and elevation. The skyline is jagged and angular — sharp triangular peaks with steep, often asymmetric flanks meeting at pointed apexes, connected by rugged ridges with cols, sub-peaks and rocky notches — not a sequence of smooth bell-shaped bumps. Unlike an elevation-profile-along-a-trail, this plot is the angular view of the surrounding peaks from a single observer, making it ideal for summit-identification infographics, alpine panoramas, and travel guides.
""" anyplot.ai
area-mountain-panorama: Mountain Panorama Profile with Labeled Peaks
Library: pygal 3.1.3 | Python 3.13.14
Quality: 88/100 | Updated: 2026-06-30
"""

import os
import re
import sys


# Script filename shadows the installed `pygal` package when run as `python pygal.py`;
# dropping the script directory from sys.path lets the real package resolve.
sys.path.pop(0)

import cairosvg
import numpy as np
import pygal
from pygal.style import Style


# Theme tokens (Imprint palette, theme-adaptive chrome)
THEME = os.getenv("ANYPLOT_THEME", "light")
PAGE_BG = "#FAF8F1" if THEME == "light" else "#1A1A17"
SKY_TOP = "#BDD8EC" if THEME == "light" else "#1B2A3D"
INK = "#1A1A17" if THEME == "light" else "#F0EFE8"
INK_SOFT = "#4A4A44" if THEME == "light" else "#B8B7B0"
INK_MUTED = "#6B6A63" if THEME == "light" else "#A8A79F"
BRAND = "#009E73"

# Data — Bernese Oberland (Switzerland), thirteen peaks viewed W → E from north
peaks = [
    ("Gspaltenhorn", 15, 3437),
    ("Blümlisalp", 32, 3660),
    ("Doldenhorn", 50, 3638),
    ("Balmhorn", 67, 3698),
    ("Altels", 82, 3629),
    ("Wildstrubel", 105, 3244),
    ("Schreckhorn", 135, 4078),
    ("Finsteraarhorn", 158, 4274),
    ("Eiger", 192, 3967),
    ("Mönch", 210, 4107),
    ("Jungfrau", 230, 4158),
    ("Silberhorn", 248, 3695),
    ("Grosshorn", 265, 3754),
]

# Jagged silhouette: midpoint-displacement fractal base + asymmetric tent peaks
# (spec explicitly prohibits Gaussian bumps — this ridge reads as alpine rock)
np.random.seed(42)
N = 1024
angle = np.linspace(0, 280, N)

mdp_ridge = np.zeros(N)
mdp_ridge[0] = 3100.0
mdp_ridge[N - 1] = 3000.0
step = N - 1
amp = 310.0
while step > 1:
    half = step // 2
    for i in range(0, N - step, step):
        midval = (mdp_ridge[i] + mdp_ridge[i + step]) / 2.0
        mdp_ridge[i + half] = midval + float(np.random.randn()) * amp
    amp *= 0.62
    step = half
mdp_ridge = np.clip(mdp_ridge, 2750.0, 3450.0)

# Asymmetric tent functions — distinct left/right slope ratios per peak for variety
asym = [0.60, 0.80, 0.55, 0.75, 0.65, 0.85, 0.50, 0.70, 0.60, 0.90, 0.65, 0.75, 0.80]
ridge = mdp_ridge.copy()
for idx, (_name, pos, elev) in enumerate(peaks):
    left_w = 7.0 + (elev - 3000) / 200.0
    right_w = left_w * asym[idx]
    peak_h = elev - 2600.0
    bump = np.where(
        angle <= pos,
        peak_h * np.maximum(0.0, 1.0 - np.abs(angle - pos) / left_w),
        peak_h * np.maximum(0.0, 1.0 - np.abs(angle - pos) / right_w),
    )
    ridge = np.maximum(ridge, 2600.0 + bump)

# Fine-grain jaggedness along the full ridgeline
ridge += np.random.randn(N) * 18.0

# Secondary depth ridge (more distant range peeking above main ridge valleys — DE-01 depth)
np.random.seed(99)
depth_ridge = np.zeros(N)
depth_ridge[0] = 3050.0
depth_ridge[N - 1] = 2950.0
step = N - 1
amp_d = 240.0
while step > 1:
    half = step // 2
    for i in range(0, N - step, step):
        midval = (depth_ridge[i] + depth_ridge[i + step]) / 2.0
        depth_ridge[i + half] = midval + float(np.random.randn()) * amp_d
    amp_d *= 0.62
    step = half
depth_ridge = np.clip(depth_ridge, 2800.0, 3550.0)
depth_ridge += np.random.randn(N) * 10.0

# Canvas — 3200×1800 landscape (hard contract per pygal library prompt)
CANVAS_W, CANVAS_H = 3200, 1800
MARGIN_L, MARGIN_R = 200, 80
MARGIN_T, MARGIN_B = 170, 130

Y_FLOOR, Y_CEIL = 2400, 5000
X_MIN, X_MAX = 0, 280

font = "DejaVu Sans, Helvetica, Arial, sans-serif"

# Imprint palette — first series is brand green (#009E73), peaks series uses INK
custom_style = Style(
    background=PAGE_BG,
    plot_background="transparent",
    foreground=INK_SOFT,
    foreground_strong=INK,
    foreground_subtle=INK_MUTED,
    colors=(BRAND, INK if THEME == "light" else "#F0EFE8"),
    font_family=font,
    title_font_family=font,
    label_font_family=font,
    major_label_font_family=font,
    tooltip_font_family=font,
    title_font_size=66,
    label_font_size=56,
    major_label_font_size=44,
    legend_font_size=44,
    tooltip_font_size=22,
    stroke_width=2,
    opacity=".95",
    opacity_hover=".75",
    transition="200ms ease-in",
)

chart = pygal.XY(
    width=CANVAS_W,
    height=CANVAS_H,
    style=custom_style,
    show_legend=False,
    show_x_labels=False,
    show_y_labels=False,
    show_x_guides=False,
    show_y_guides=False,
    margin_left=MARGIN_L,
    margin_right=MARGIN_R,
    margin_top=MARGIN_T,
    margin_bottom=MARGIN_B,
    xrange=(X_MIN, X_MAX),
    range=(Y_FLOOR, Y_CEIL),
    fill=True,
    show_dots=False,
    stroke_style={"width": 2},
    truncate_label=-1,
)

ridge_data = [{"value": (float(a), float(e))} for a, e in zip(angle, ridge, strict=False)]
chart.add("Skyline", ridge_data)

peak_data = [{"value": (float(pos), float(elev)), "label": f"{name} · {elev:,} m"} for name, pos, elev in peaks]
chart.add("Peaks", peak_data, show_dots=True, dots_size=7, stroke=False, fill=False)

# Render pygal SVG; back-compute plot-box from the two extreme summit dots
base_svg = chart.render(is_unicode=True)

dot_re = re.compile(r'<circle cx="([-\d.]+)" cy="([-\d.]+)"[^>]*class="dot')
dots = [(float(cx), float(cy)) for cx, cy in dot_re.findall(base_svg)]
(p1x, p1y) = dots[0]
(p2x, p2y) = dots[-1]
ref_a, ref_b = peaks[0], peaks[-1]

# Linear mapping: data → SVG pixel (calibrated from dot positions)
x_scale = (p2x - p1x) / (ref_b[1] - ref_a[1])
x_off = p1x - ref_a[1] * x_scale
y_scale = (p2y - p1y) / (ref_b[2] - ref_a[2])
y_off = p1y - ref_a[2] * y_scale

# Plot-box corners via inlined transform (svg = data * scale + offset)
plot_x_left = X_MIN * x_scale + x_off
plot_x_right = X_MAX * x_scale + x_off
plot_y_top = Y_CEIL * y_scale + y_off
plot_y_bottom = Y_FLOOR * y_scale + y_off
plot_w = plot_x_right - plot_x_left
plot_h = plot_y_bottom - plot_y_top

# SVG chrome — injected before pygal's plot group so silhouette and dots stay on top
svg_parts = [
    f'<rect x="0" y="0" width="{CANVAS_W}" height="{CANVAS_H}" fill="{PAGE_BG}" stroke="none"/>',
    f"""<defs>
        <linearGradient id="skyGrad" x1="0" y1="0" x2="0" y2="1">
            <stop offset="0%" stop-color="{SKY_TOP}"/>
            <stop offset="100%" stop-color="{PAGE_BG}"/>
        </linearGradient>
        <clipPath id="plotClip">
            <rect x="{plot_x_left:.2f}" y="{plot_y_top:.2f}" width="{plot_w:.2f}" height="{plot_h:.2f}"/>
        </clipPath>
    </defs>""",
    f'<rect x="{plot_x_left:.2f}" y="{plot_y_top:.2f}" '
    f'width="{plot_w:.2f}" height="{plot_h:.2f}" fill="url(#skyGrad)" stroke="none"/>',
]

# Secondary depth ridge polygon (distant muted ridge visible above main valleys)
depth_fill = "#A8BAB4" if THEME == "light" else "#2C3E38"
depth_pts = " ".join(f"{angle[i] * x_scale + x_off:.1f},{depth_ridge[i] * y_scale + y_off:.1f}" for i in range(N))
depth_pts += f" {plot_x_right:.1f},{plot_y_bottom:.1f} {plot_x_left:.1f},{plot_y_bottom:.1f}"
svg_parts.append(
    f'<polygon points="{depth_pts}" fill="{depth_fill}" opacity="0.60" clip-path="url(#plotClip)" stroke="none"/>'
)

# Title — scaled for long descriptive string (formula: round(66 * 67 / len(title)))
title_str = "Bernese Oberland · area-mountain-panorama · python · pygal · anyplot.ai"
title_fs = max(44, round(66 * 67 / len(title_str)))
svg_parts.append(
    f'<text x="{CANVAS_W / 2:.2f}" y="92" text-anchor="middle" fill="{INK}" '
    f'style="font-size:{title_fs}px;font-weight:500;font-family:{font}">'
    f"{title_str}</text>"
)

# Subtitle
svg_parts.append(
    f'<text x="{CANVAS_W / 2:.2f}" y="136" text-anchor="middle" fill="{INK_SOFT}" '
    f'style="font-size:28px;font-family:{font}">'
    f"Thirteen peaks of the Swiss Bernese Oberland, viewed W → E from the north</text>"
)

# Y-axis gridlines + tick labels
y_ticks = [2500, 3000, 3500, 4000, 4500]
for v in y_ticks:
    ty = v * y_scale + y_off
    svg_parts.append(
        f'<text x="{plot_x_left - 16:.2f}" y="{ty + 11:.2f}" text-anchor="end" '
        f'fill="{INK_SOFT}" style="font-size:40px;font-family:{font}">{v:,}</text>'
    )
    svg_parts.append(
        f'<line x1="{plot_x_left:.2f}" y1="{ty:.2f}" '
        f'x2="{plot_x_right:.2f}" y2="{ty:.2f}" '
        f'stroke="{INK}" stroke-opacity="0.10" stroke-width="1.2"/>'
    )

# Y-axis title (rotated)
y_title_x = plot_x_left - 130
y_title_y = plot_y_top + plot_h / 2
svg_parts.append(
    f'<text x="{y_title_x:.2f}" y="{y_title_y:.2f}" text-anchor="middle" fill="{INK}" '
    f'style="font-size:38px;font-family:{font}" '
    f'transform="rotate(-90,{y_title_x:.2f},{y_title_y:.2f})">Elevation (m)</text>'
)

# Compass bearings on x-axis
compass_ticks = [(28, "W"), (80, "SW"), (140, "S"), (200, "SE"), (265, "E")]
for ang_val, label in compass_ticks:
    tx = ang_val * x_scale + x_off
    svg_parts.append(
        f'<text x="{tx:.2f}" y="{plot_y_bottom + 48:.2f}" text-anchor="middle" '
        f'fill="{INK_SOFT}" style="font-size:30px;font-family:{font}">{label}</text>'
    )

# L-shaped axis frame
svg_parts.append(
    f'<line x1="{plot_x_left:.2f}" y1="{plot_y_top:.2f}" '
    f'x2="{plot_x_left:.2f}" y2="{plot_y_bottom:.2f}" stroke="{INK_SOFT}" stroke-width="2"/>'
)
svg_parts.append(
    f'<line x1="{plot_x_left:.2f}" y1="{plot_y_bottom:.2f}" '
    f'x2="{plot_x_right:.2f}" y2="{plot_y_bottom:.2f}" stroke="{INK_SOFT}" stroke-width="2"/>'
)

# Peak labels — 4 tiers; Jungfrau (focal) pinned to topmost tier
LABEL_TIERS = [4350, 4510, 4670, 4820]
for i, (name, pos, elev) in enumerate(peaks):
    is_focal = name == "Jungfrau"
    tier_idx = 3 if is_focal else (i % 3)
    tier_y_data = LABEL_TIERS[tier_idx]

    sx = pos * x_scale + x_off
    sy_summit = elev * y_scale + y_off
    sy_label = tier_y_data * y_scale + y_off

    leader_color = INK if is_focal else INK_SOFT
    leader_op = 0.85 if is_focal else 0.40
    leader_w = 1.8 if is_focal else 1.0

    svg_parts.append(
        f'<line x1="{sx:.2f}" y1="{sy_summit - 4:.2f}" '
        f'x2="{sx:.2f}" y2="{sy_label + 16:.2f}" '
        f'stroke="{leader_color}" stroke-opacity="{leader_op}" stroke-width="{leader_w}"/>'
    )

    name_fs = 32 if is_focal else 24
    elev_fs = 26 if is_focal else 22
    name_weight = "700" if is_focal else "600"
    name_color = INK if is_focal else INK_SOFT
    elev_color = INK_SOFT if is_focal else INK_MUTED

    svg_parts.append(
        f'<text x="{sx:.2f}" y="{sy_label:.2f}" text-anchor="middle" fill="{name_color}" '
        f'style="font-size:{name_fs}px;font-weight:{name_weight};font-family:{font}">'
        f"{name}</text>"
    )
    svg_parts.append(
        f'<text x="{sx:.2f}" y="{sy_label + name_fs + 4:.2f}" text-anchor="middle" '
        f'fill="{elev_color}" style="font-size:{elev_fs}px;font-family:{font}">'
        f"{elev:,} m</text>"
    )

custom_svg = "\n".join(svg_parts)

# Inject chrome before pygal's plot group so silhouette and interactive dots stay on top
plot_group_idx = base_svg.find('class="plot"')
if plot_group_idx != -1:
    insert_idx = base_svg.rfind("<g", 0, plot_group_idx)
    output_svg = base_svg[:insert_idx] + custom_svg + "\n" + base_svg[insert_idx:]
else:
    output_svg = base_svg.replace("</svg>", f"{custom_svg}\n</svg>")

# Clip the pygal fill to the plot-box so it doesn't bleed into the bottom margin
output_svg = output_svg.replace('class="plot"', 'class="plot" clip-path="url(#plotClip)"', 1)

cairosvg.svg2png(bytestring=output_svg.encode("utf-8"), write_to=f"plot-{THEME}.png", output_width=CANVAS_W)

html_content = f"""<!DOCTYPE html>
<html>
<head>
    <meta charset="utf-8">
    <title>area-mountain-panorama · python · pygal · anyplot.ai</title>
    <style>
        body {{ margin: 0; background: {PAGE_BG}; display: flex;
                justify-content: center; align-items: center; min-height: 100vh; }}
        .chart {{ max-width: 100%; height: auto; }}
    </style>
</head>
<body>
    <figure class="chart">
        {output_svg}
    </figure>
</body>
</html>
"""

with open(f"plot-{THEME}.html", "w", encoding="utf-8") as f:
    f.write(html_content)
Runnable source as JSON, for any HTTP client: https://api.anyplot.ai/specs/area-mountain-panorama/pygal/code. Any spec id and library id listed in llms-full.txt fit the same URL shape; every URL below is complete and callable.
{
  "spec_id": "area-mountain-panorama",
  "language": "python",
  "library": "pygal",
  "page": "https://anyplot.ai/area-mountain-panorama/python/pygal",
  "hub": "https://anyplot.ai/area-mountain-panorama",
  "code_json": "https://api.anyplot.ai/specs/area-mountain-panorama/pygal/code",
  "spec_json": "https://api.anyplot.ai/specs/area-mountain-panorama",
  "render_light_png": "https://storage.googleapis.com/anyplot-images/plots/area-mountain-panorama/python/pygal/plot-light.png",
  "render_dark_png": "https://storage.googleapis.com/anyplot-images/plots/area-mountain-panorama/python/pygal/plot-dark.png",
  "interactive_light_html": "https://storage.googleapis.com/anyplot-images/plots/area-mountain-panorama/python/pygal/plot-light.html",
  "interactive_dark_html": "https://storage.googleapis.com/anyplot-images/plots/area-mountain-panorama/python/pygal/plot-dark.html",
  "quality_score": 88.0,
  "license": "MIT",
  "guide": "https://anyplot.ai/llms.txt"
}
Part of Mountain Panorama Profile with Labeled Peaks on anyplot.ai.