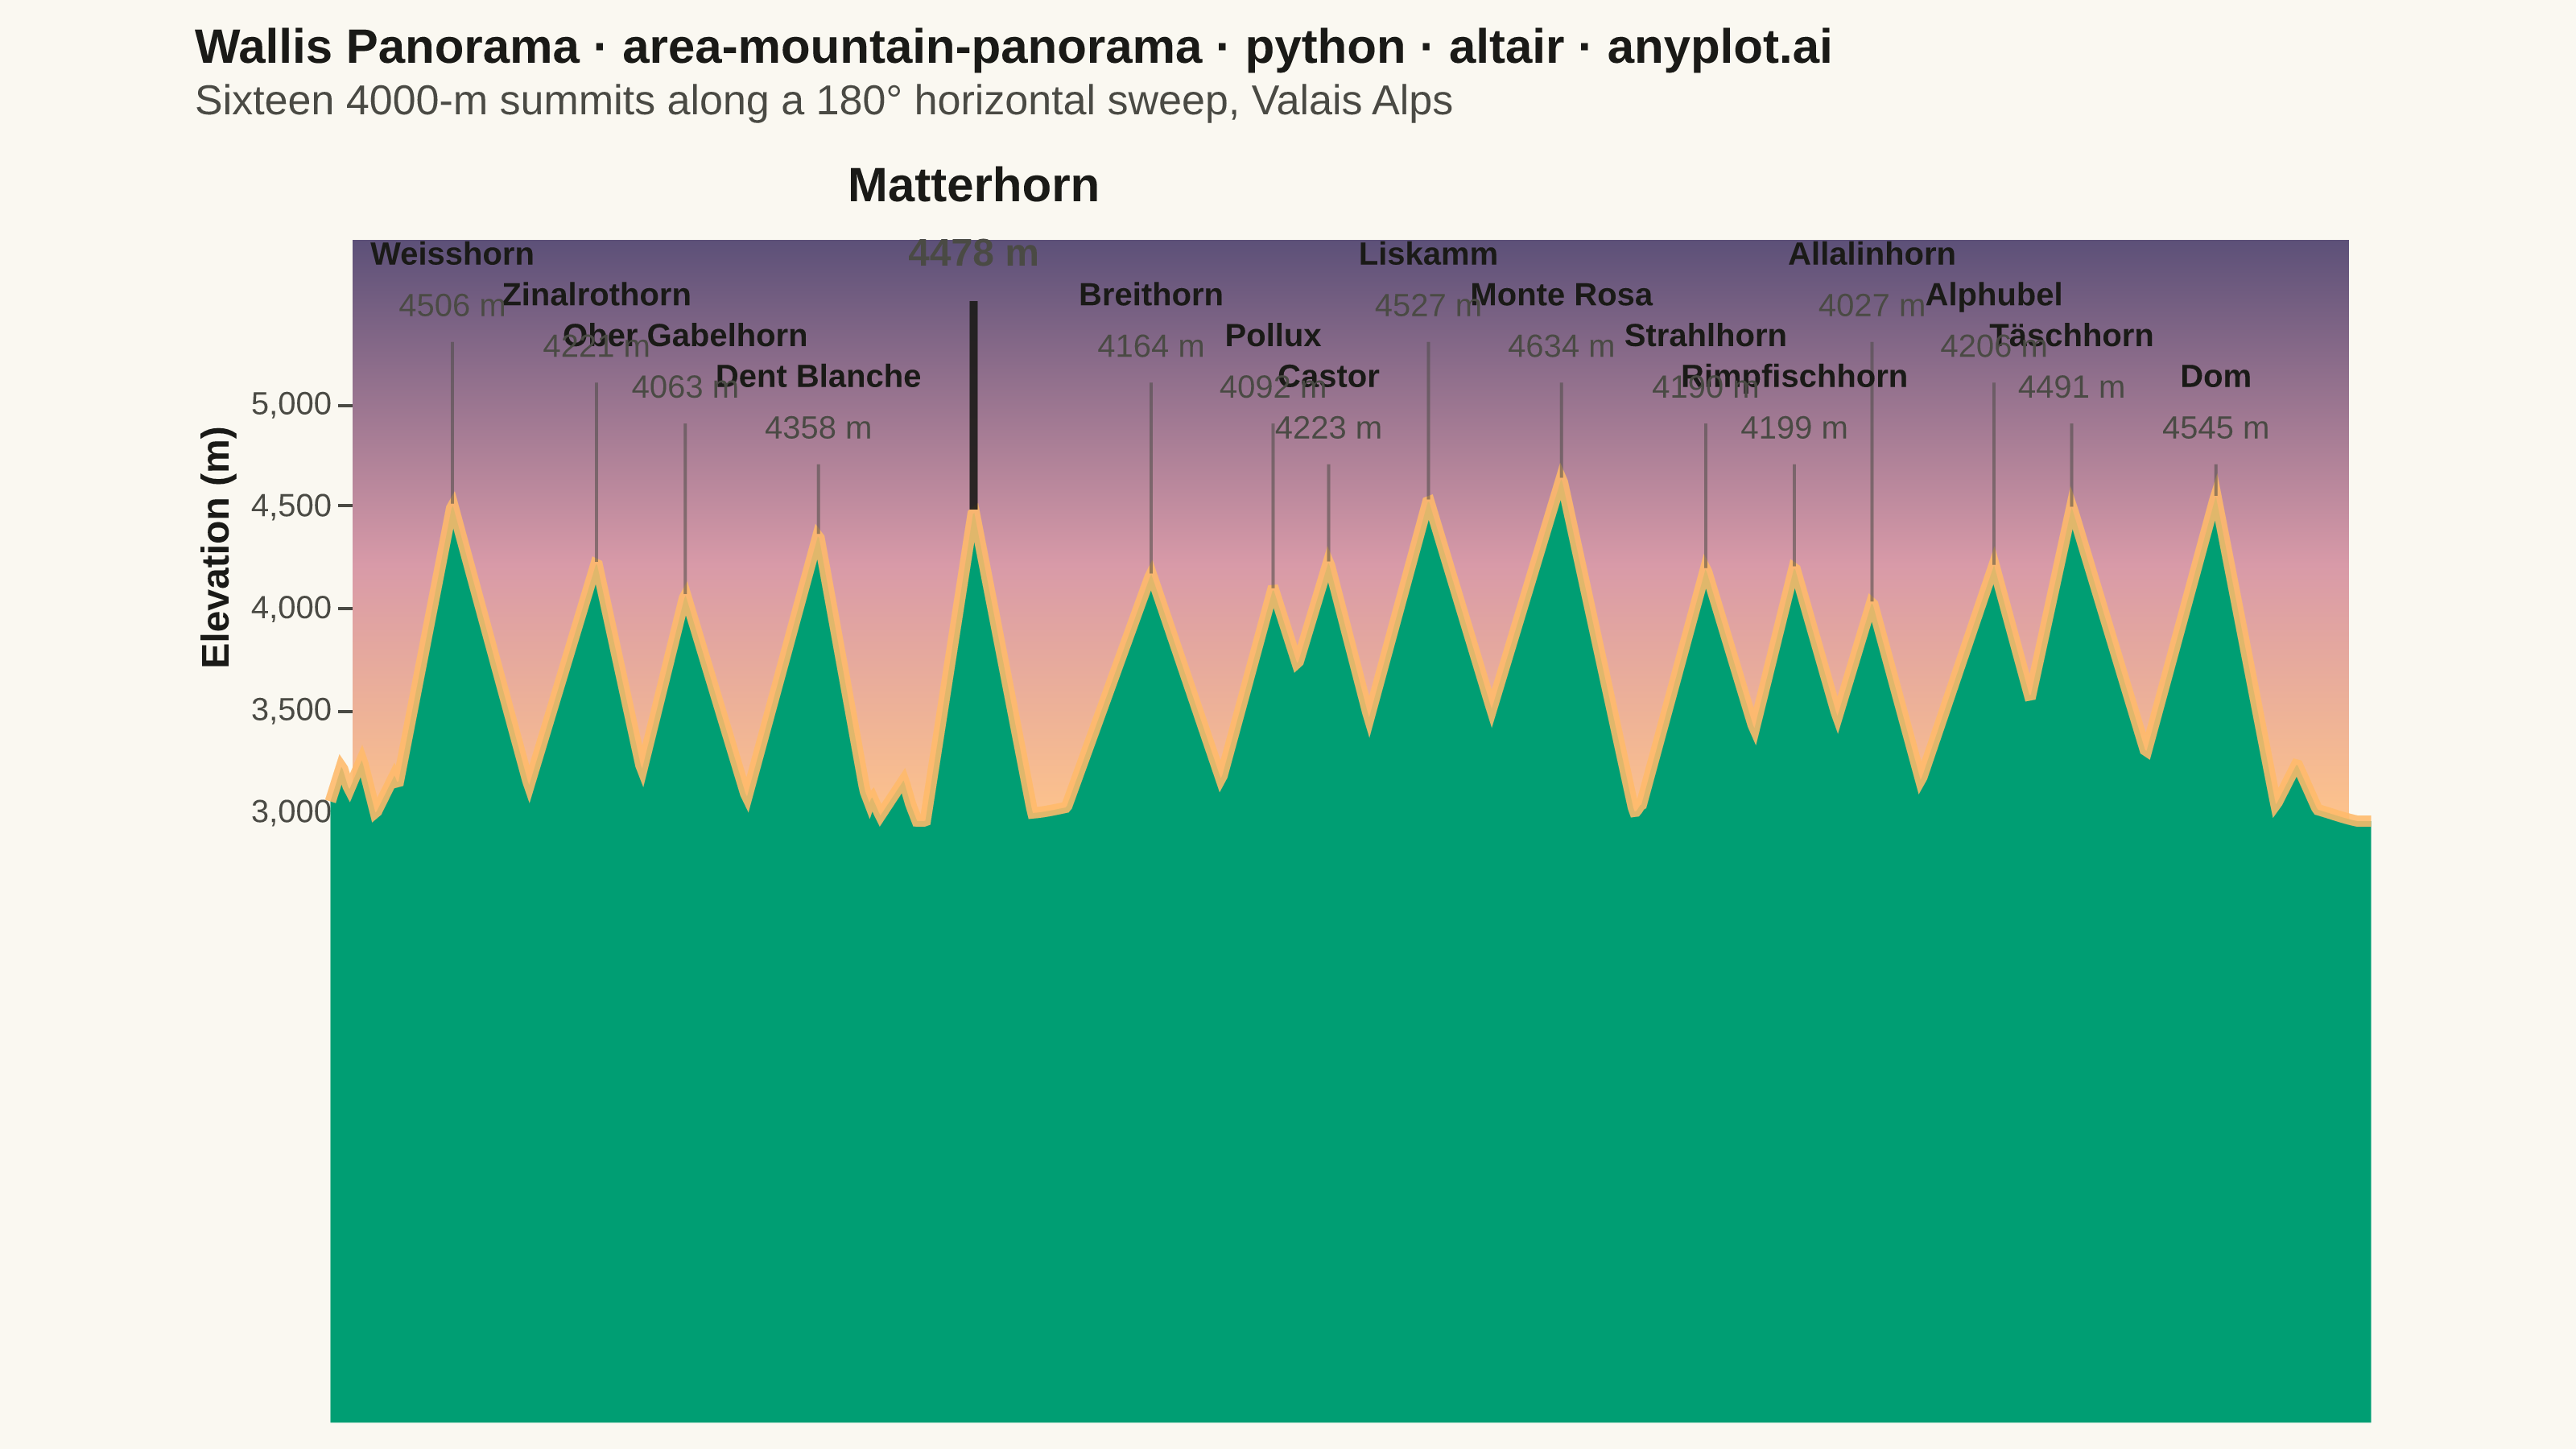
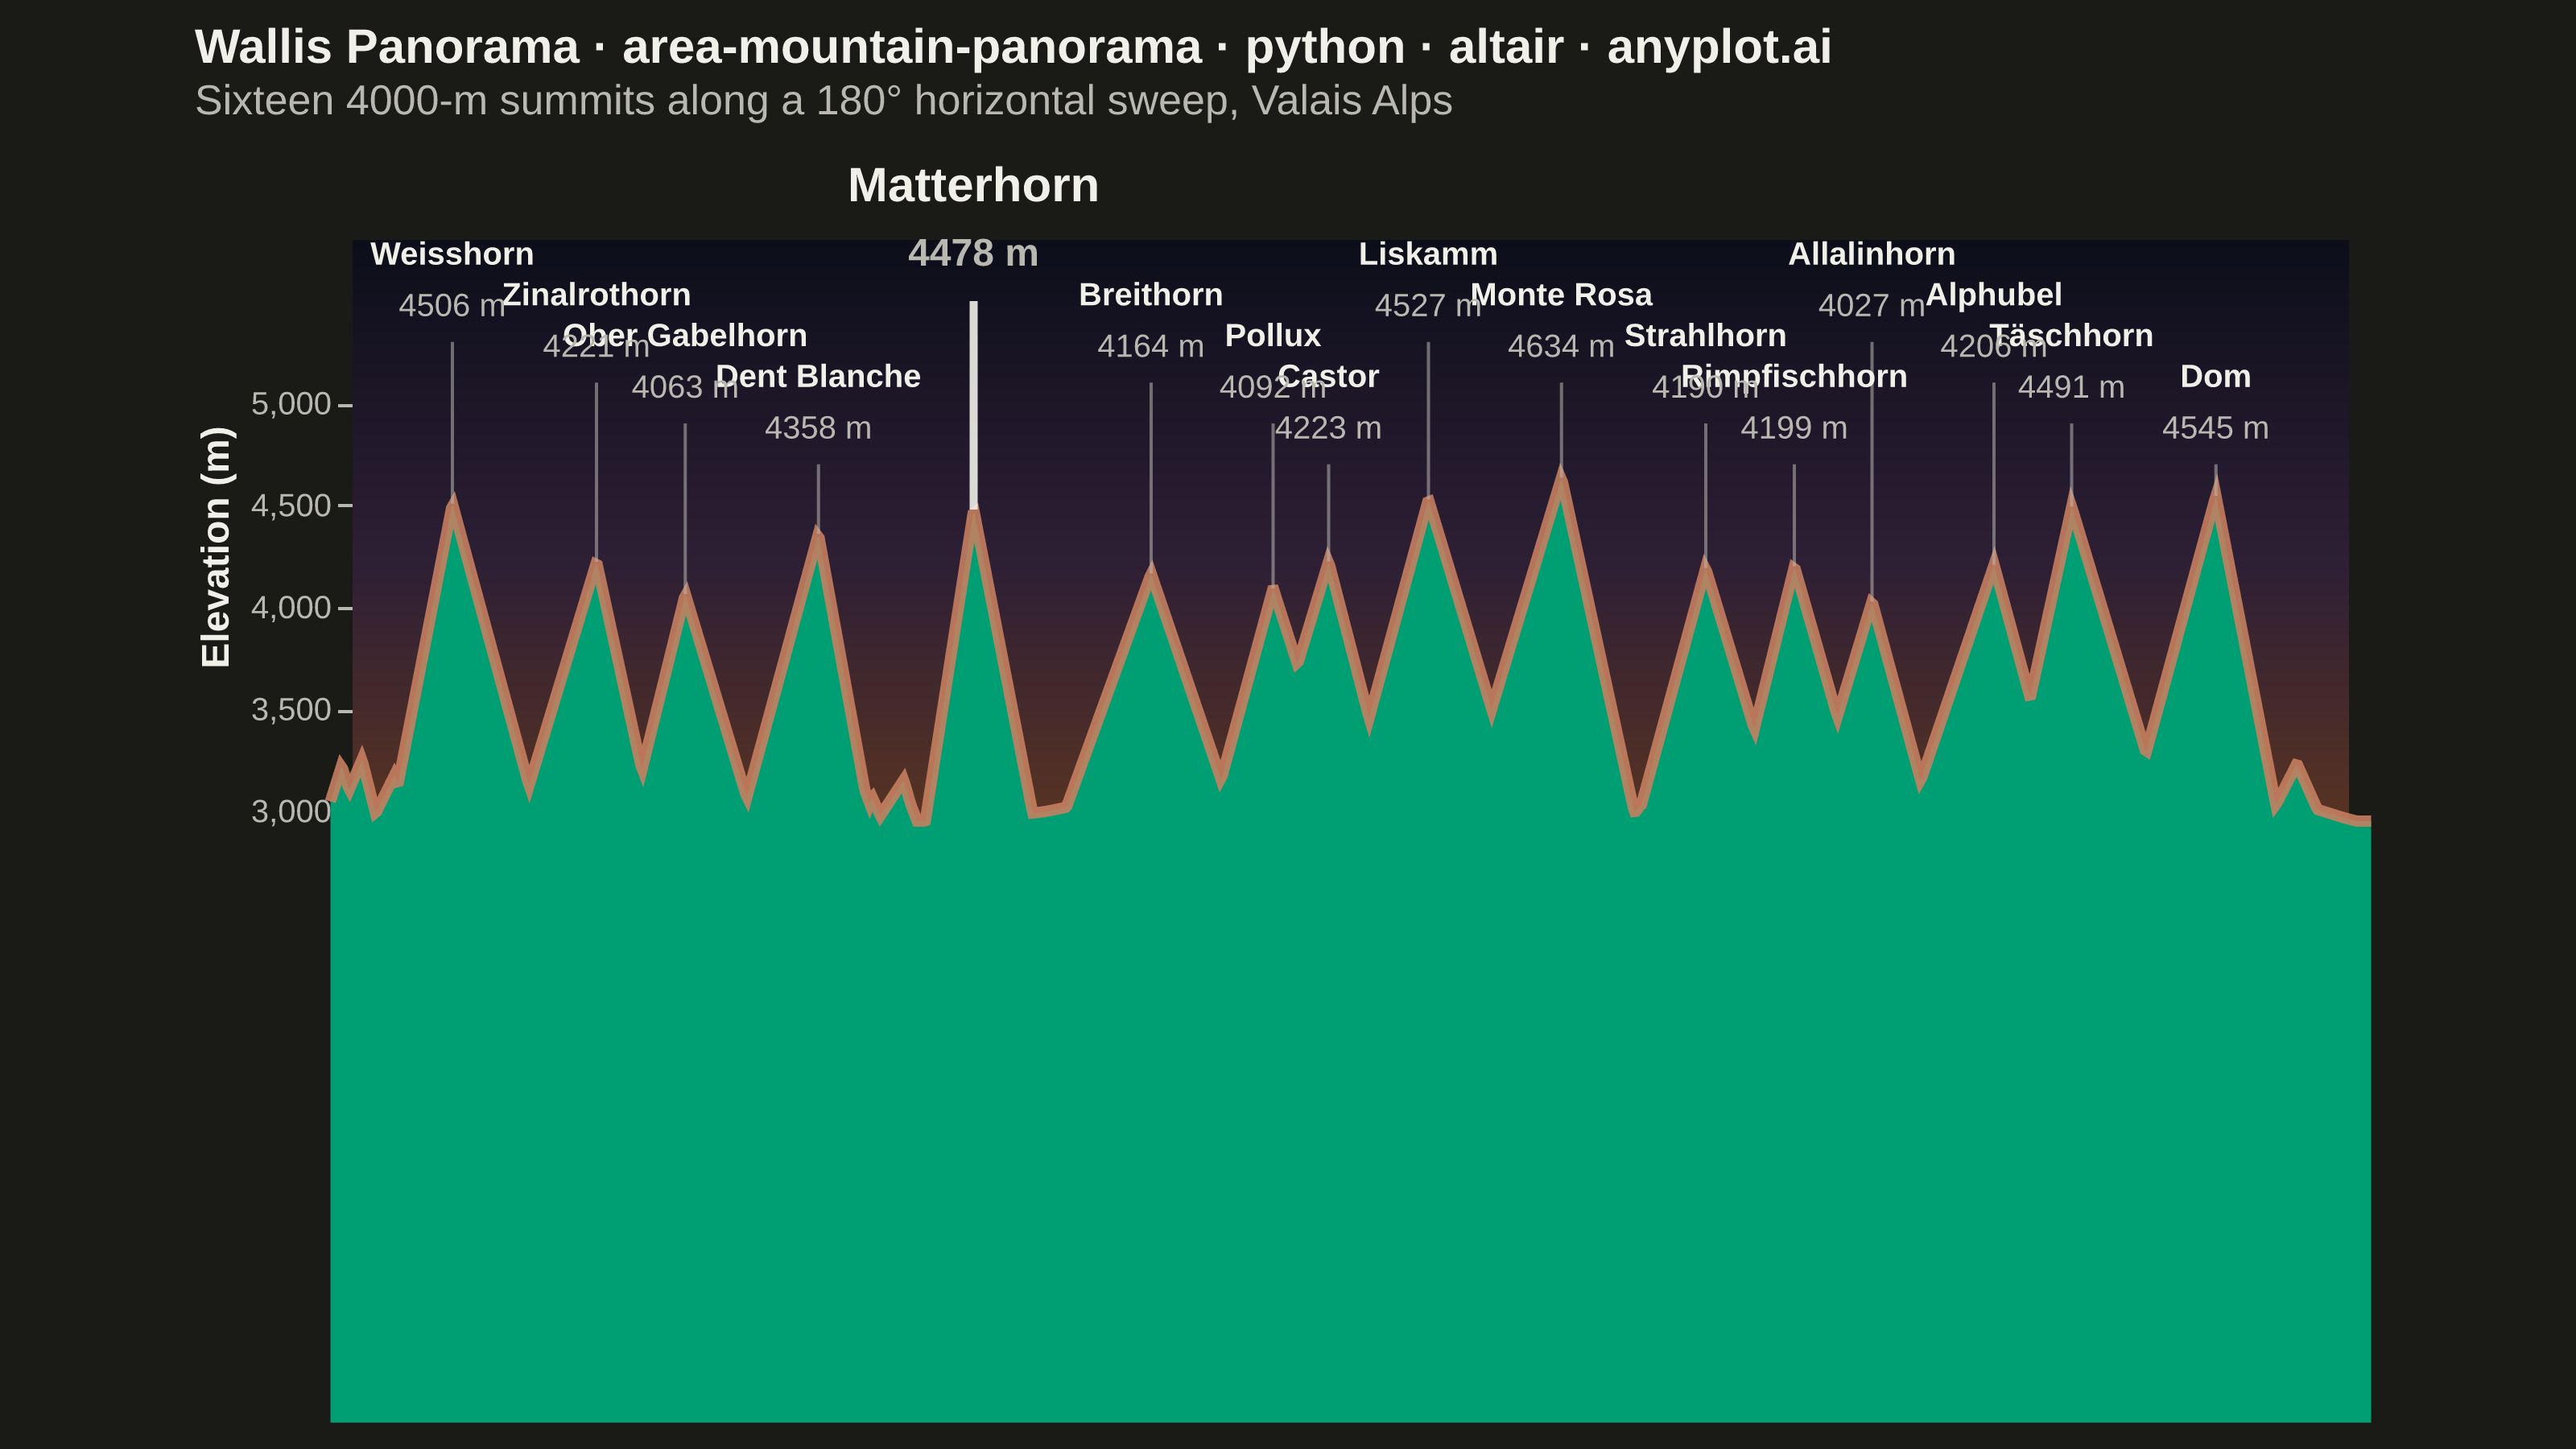
A panoramic mountain silhouette chart that renders the horizon as seen from a fixed vantage point, like a photograph of a ridgeline against the sky. A filled area under the skyline curve traces the ridgeline across a horizontal viewing range (in degrees of bearing or horizontal distance), and major summits are annotated with their name and elevation. The skyline is jagged and angular — sharp triangular peaks with steep, often asymmetric flanks meeting at pointed apexes, connected by rugged ridges with cols, sub-peaks and rocky notches — not a sequence of smooth bell-shaped bumps. Unlike an elevation-profile-along-a-trail, this plot is the angular view of the surrounding peaks from a single observer, making it ideal for summit-identification infographics, alpine panoramas, and travel guides.
""" anyplot.ai
area-mountain-panorama: Mountain Panorama Profile with Labeled Peaks
Library: altair 6.2.2 | Python 3.13.14
Quality: 84/100 | Updated: 2026-06-30
"""

import importlib
import os
import sys


# Drop script directory from sys.path so `altair` resolves the package, not this file
sys.path[:] = [p for p in sys.path if os.path.abspath(p or ".") != os.path.dirname(os.path.abspath(__file__))]
alt = importlib.import_module("altair")
np = importlib.import_module("numpy")
pd = importlib.import_module("pandas")
from PIL import Image


# Theme tokens — chrome flips with theme; Imprint palette data colors stay constant
THEME = os.getenv("ANYPLOT_THEME", "light")
PAGE_BG = "#FAF8F1" if THEME == "light" else "#1A1A17"
INK = "#1A1A17" if THEME == "light" else "#F0EFE8"
INK_SOFT = "#4A4A44" if THEME == "light" else "#B8B7B0"
BRAND = "#009E73"  # Imprint palette position 1 — silhouette fill (single data series)

# Theme-adaptive dusk sky gradient (spec-authorized chrome above the ridgeline)
SKY_HORIZON = "#FFC58A" if THEME == "light" else "#5A3422"
SKY_MID = "#D89AA8" if THEME == "light" else "#2E1F35"
SKY_ZENITH = "#5C5078" if THEME == "light" else "#0C0E1A"
# Alpenglow rim — warm gold / rose-copper at the sky-to-silhouette boundary
ALPENGLOW = "#FFBA6A" if THEME == "light" else "#C88060"

BASE_ELEV = 2950

# All 16 major Wallis (Valais, CH) summits across a 180° horizontal sweep.
# left_slope / right_slope: m/degree for piecewise-linear tent flanks.
peaks = pd.DataFrame(
    [
        ("Weisshorn", 4506, 9, 280, 200),
        ("Zinalrothorn", 4221, 22, 180, 250),
        ("Ober Gabelhorn", 4063, 30, 220, 180),
        ("Dent Blanche", 4358, 42, 200, 300),
        ("Matterhorn", 4478, 56, 350, 280),  # focal point — steepest flanks
        ("Breithorn", 4164, 72, 150, 160),
        ("Pollux", 4092, 83, 200, 170),
        ("Castor", 4223, 88, 180, 210),
        ("Liskamm", 4527, 97, 200, 180),
        ("Monte Rosa", 4634, 109, 180, 250),
        ("Strahlhorn", 4190, 122, 200, 180),
        ("Rimpfischhorn", 4199, 130, 220, 190),
        ("Allalinhorn", 4027, 137, 180, 200),
        ("Alphubel", 4206, 148, 160, 200),
        ("Täschhorn", 4491, 155, 250, 180),
        ("Dom", 4545, 168, 200, 280),
    ],
    columns=["name", "elevation_m", "angle_deg", "left_slope", "right_slope"],
)

# Ridgeline — piecewise-linear tent/triangle functions per spec.
# Spec explicitly forbids Gaussian/bell-curve bumps; each summit uses two linear
# flanks meeting at a sharp apex, with asymmetric slope steepness.
np.random.seed(42)
angles = np.linspace(-2, 182, 1500)

# Base ridge always at or above BASE_ELEV — positive-only sinusoidal undulation
ridge_elev = BASE_ELEV + np.maximum(0, 70 * np.sin(angles * 0.12) + 22 * np.sin(angles * 0.47 + 1.1))

# Rocky inter-peak jaggedness: 65 random tent functions (NOT Gaussian)
for _ in range(65):
    pos = np.random.uniform(-2, 182)
    height = np.random.uniform(60, 320)
    lslope = np.random.uniform(60, 220)
    rslope = np.random.uniform(60, 220)
    tent = BASE_ELEV + height - np.where(angles <= pos, lslope * (pos - angles), rslope * (angles - pos))
    ridge_elev = np.maximum(ridge_elev, np.maximum(BASE_ELEV, tent))

# Named peaks: steep asymmetric tent functions — sharp apex + linear flanks
for _, row in peaks.iterrows():
    pos, elev = row["angle_deg"], row["elevation_m"]
    tent = elev - np.where(angles <= pos, row["left_slope"] * (pos - angles), row["right_slope"] * (angles - pos))
    ridge_elev = np.maximum(ridge_elev, np.maximum(BASE_ELEV, tent))

ridge = pd.DataFrame({"angle_deg": angles, "elevation_m": ridge_elev})

# Four label tiers assigned by round-robin for maximum same-tier angular separation
# (minimum ~33° within each tier, preventing label collision).
# TIER_A (5300): Weisshorn(9°), Liskamm(97°), Allalinhorn(137°)
# TIER_B (5100): Zinalrothorn(22°), Breithorn(72°), Monte Rosa(109°), Alphubel(148°)
# TIER_C (4900): Ober Gabelhorn(30°), Pollux(83°), Strahlhorn(122°), Täschhorn(155°)
# TIER_D (4700): Dent Blanche(42°), Castor(88°), Rimpfischhorn(130°), Dom(168°)
# MATTERHORN SPECIAL (5500): strongest focal accent
TIER_A, TIER_B, TIER_C, TIER_D, TIER_MAT = 5300, 5100, 4900, 4700, 5500
label_y_map = {
    "Weisshorn": TIER_A,
    "Zinalrothorn": TIER_B,
    "Ober Gabelhorn": TIER_C,
    "Dent Blanche": TIER_D,
    "Matterhorn": TIER_MAT,
    "Breithorn": TIER_B,
    "Pollux": TIER_C,
    "Castor": TIER_D,
    "Liskamm": TIER_A,
    "Monte Rosa": TIER_B,
    "Strahlhorn": TIER_C,
    "Rimpfischhorn": TIER_D,
    "Allalinhorn": TIER_A,
    "Alphubel": TIER_B,
    "Täschhorn": TIER_C,
    "Dom": TIER_D,
}
peaks["label_y"] = peaks["name"].map(label_y_map)
peaks["elev_label"] = peaks["elevation_m"].apply(lambda v: f"{v} m")

matterhorn = peaks[peaks["name"] == "Matterhorn"]
others = peaks[peaks["name"] != "Matterhorn"]

# Coordinate system — only the sky layer carries the explicit scale + axis;
# other layers share it implicitly via Vega-Lite layer scale resolution.
X_SCALE = alt.Scale(domain=[0, 180])
Y_SCALE = alt.Scale(domain=[2900, 5800])
Y_AXIS = alt.Axis(values=[3000, 3500, 4000, 4500, 5000])

# Layer 1: dusk sky gradient (vertical linear, zenith → ridge horizon)
sky_df = pd.DataFrame({"x_min": [0], "x_max": [180], "y_min": [2900], "y_max": [5800]})
sky = (
    alt.Chart(sky_df)
    .mark_rect(
        color={
            "x1": 0,
            "y1": 0,
            "x2": 0,
            "y2": 1,
            "gradient": "linear",
            "stops": [
                {"offset": 0.0, "color": SKY_ZENITH},
                {"offset": 0.55, "color": SKY_MID},
                {"offset": 1.0, "color": SKY_HORIZON},
            ],
        }
    )
    .encode(
        x=alt.X("x_min:Q", scale=X_SCALE, axis=None),
        x2="x_max:Q",
        y=alt.Y("y_min:Q", scale=Y_SCALE, title="Elevation (m)", axis=Y_AXIS),
        y2="y_max:Q",
    )
)

# Layer 2: mountain silhouette — brand-green filled area below the ridgeline
silhouette = alt.Chart(ridge).mark_area(color=BRAND, opacity=1.0).encode(x="angle_deg:Q", y="elevation_m:Q")

# Layer 3: alpenglow rim — warm glowing stroke at the sky-to-silhouette boundary
alpenglow = (
    alt.Chart(ridge)
    .mark_line(color=ALPENGLOW, strokeWidth=3.5, opacity=0.88)
    .encode(x="angle_deg:Q", y="elevation_m:Q")
)

_tooltip = [alt.Tooltip("name:N", title="Peak"), alt.Tooltip("elevation_m:Q", title="Elevation (m)", format=",d")]

# Layers 4–5: leader lines from summit apex to label anchor
leaders = (
    alt.Chart(others)
    .mark_rule(strokeWidth=1.0, opacity=0.55, color=INK_SOFT)
    .encode(x="angle_deg:Q", y="elevation_m:Q", y2="label_y:Q", tooltip=_tooltip)
)
matterhorn_leader = (
    alt.Chart(matterhorn)
    .mark_rule(strokeWidth=2.5, opacity=0.9, color=INK)
    .encode(x="angle_deg:Q", y="elevation_m:Q", y2="label_y:Q", tooltip=_tooltip)
)

# Layers 6–7: center-aligned name/elevation labels for all non-Matterhorn peaks
name_labels = (
    alt.Chart(others)
    .mark_text(align="center", baseline="bottom", fontSize=10, fontWeight="bold", color=INK, dy=-22)
    .encode(x="angle_deg:Q", y="label_y:Q", text="name:N", tooltip=_tooltip)
)
elev_labels = (
    alt.Chart(others)
    .mark_text(align="center", baseline="bottom", fontSize=10, color=INK_SOFT, dy=-6)
    .encode(x="angle_deg:Q", y="label_y:Q", text="elev_label:N", tooltip=_tooltip)
)

# Layers 8–9: Matterhorn focal accent — larger font, heavier weight, composition anchor
matterhorn_name = (
    alt.Chart(matterhorn)
    .mark_text(align="center", baseline="bottom", fontSize=15, fontWeight="bold", color=INK, dy=-28)
    .encode(x="angle_deg:Q", y="label_y:Q", text="name:N", tooltip=_tooltip)
)
matterhorn_elev = (
    alt.Chart(matterhorn)
    .mark_text(align="center", baseline="bottom", fontSize=12, fontWeight="bold", color=INK_SOFT, dy=-8)
    .encode(x="angle_deg:Q", y="label_y:Q", text="elev_label:N", tooltip=_tooltip)
)

title_str = "Wallis Panorama · area-mountain-panorama · python · altair · anyplot.ai"
n = len(title_str)
ratio = 67 / n if n > 67 else 1.0
title_fs = max(11, round(16 * ratio))

# height=190: vl-convert with explicit Y_SCALE on the sky anchor layer adds ~47 CSS px
# of Y overhead per 190 CSS px (source height ≈ 1500px pre-pad, ≤1800px with title).
# DO NOT increase to ≥210 — overhead scales with height and tips over 1800 source px.
chart = (
    (
        sky
        + silhouette
        + alpenglow
        + leaders
        + matterhorn_leader
        + name_labels
        + elev_labels
        + matterhorn_name
        + matterhorn_elev
    )
    .properties(
        width=620,
        height=190,
        title=alt.Title(
            title_str,
            subtitle="Sixteen 4000-m summits along a 180° horizontal sweep, Valais Alps",
            subtitleColor=INK_SOFT,
            subtitleFontSize=13,
            fontSize=title_fs,
            anchor="start",
            offset=12,
            color=INK,
        ),
        background=PAGE_BG,
    )
    .configure_view(fill=PAGE_BG, stroke=None)
    .configure_axis(
        domainColor=INK_SOFT,
        tickColor=INK_SOFT,
        gridColor=INK,
        gridOpacity=0.0,
        labelColor=INK_SOFT,
        titleColor=INK,
        labelFontSize=10,
        titleFontSize=12,
        tickSize=5,
    )
)

chart.save(f"plot-{THEME}.png", scale_factor=4.0)
chart.save(f"plot-{THEME}.html")

# Pad-only to exact 3200×1800 target — altair.md Canvas rule (never crop)
TW, TH = 3200, 1800
_img = Image.open(f"plot-{THEME}.png").convert("RGB")
_w, _h = _img.size
if _w > TW or _h > TH:
    raise SystemExit(
        f"altair vl-convert produced {_w}×{_h}, exceeds target {TW}×{TH}. "
        f"Shrink chart .properties(width=, height=) values and re-render."
    )
if _w < TW or _h < TH:
    _canvas = Image.new("RGB", (TW, TH), PAGE_BG)
    _canvas.paste(_img, ((TW - _w) // 2, (TH - _h) // 2))
    _canvas.save(f"plot-{THEME}.png")
Runnable source as JSON, for any HTTP client: https://api.anyplot.ai/specs/area-mountain-panorama/altair/code. Any spec id and library id listed in llms-full.txt fit the same URL shape; every URL below is complete and callable.
{
  "spec_id": "area-mountain-panorama",
  "language": "python",
  "library": "altair",
  "page": "https://anyplot.ai/area-mountain-panorama/python/altair",
  "hub": "https://anyplot.ai/area-mountain-panorama",
  "code_json": "https://api.anyplot.ai/specs/area-mountain-panorama/altair/code",
  "spec_json": "https://api.anyplot.ai/specs/area-mountain-panorama",
  "render_light_png": "https://storage.googleapis.com/anyplot-images/plots/area-mountain-panorama/python/altair/plot-light.png",
  "render_dark_png": "https://storage.googleapis.com/anyplot-images/plots/area-mountain-panorama/python/altair/plot-dark.png",
  "interactive_light_html": "https://storage.googleapis.com/anyplot-images/plots/area-mountain-panorama/python/altair/plot-light.html",
  "interactive_dark_html": "https://storage.googleapis.com/anyplot-images/plots/area-mountain-panorama/python/altair/plot-dark.html",
  "quality_score": 84.0,
  "license": "MIT",
  "guide": "https://anyplot.ai/llms.txt"
}
Part of Mountain Panorama Profile with Labeled Peaks on anyplot.ai.