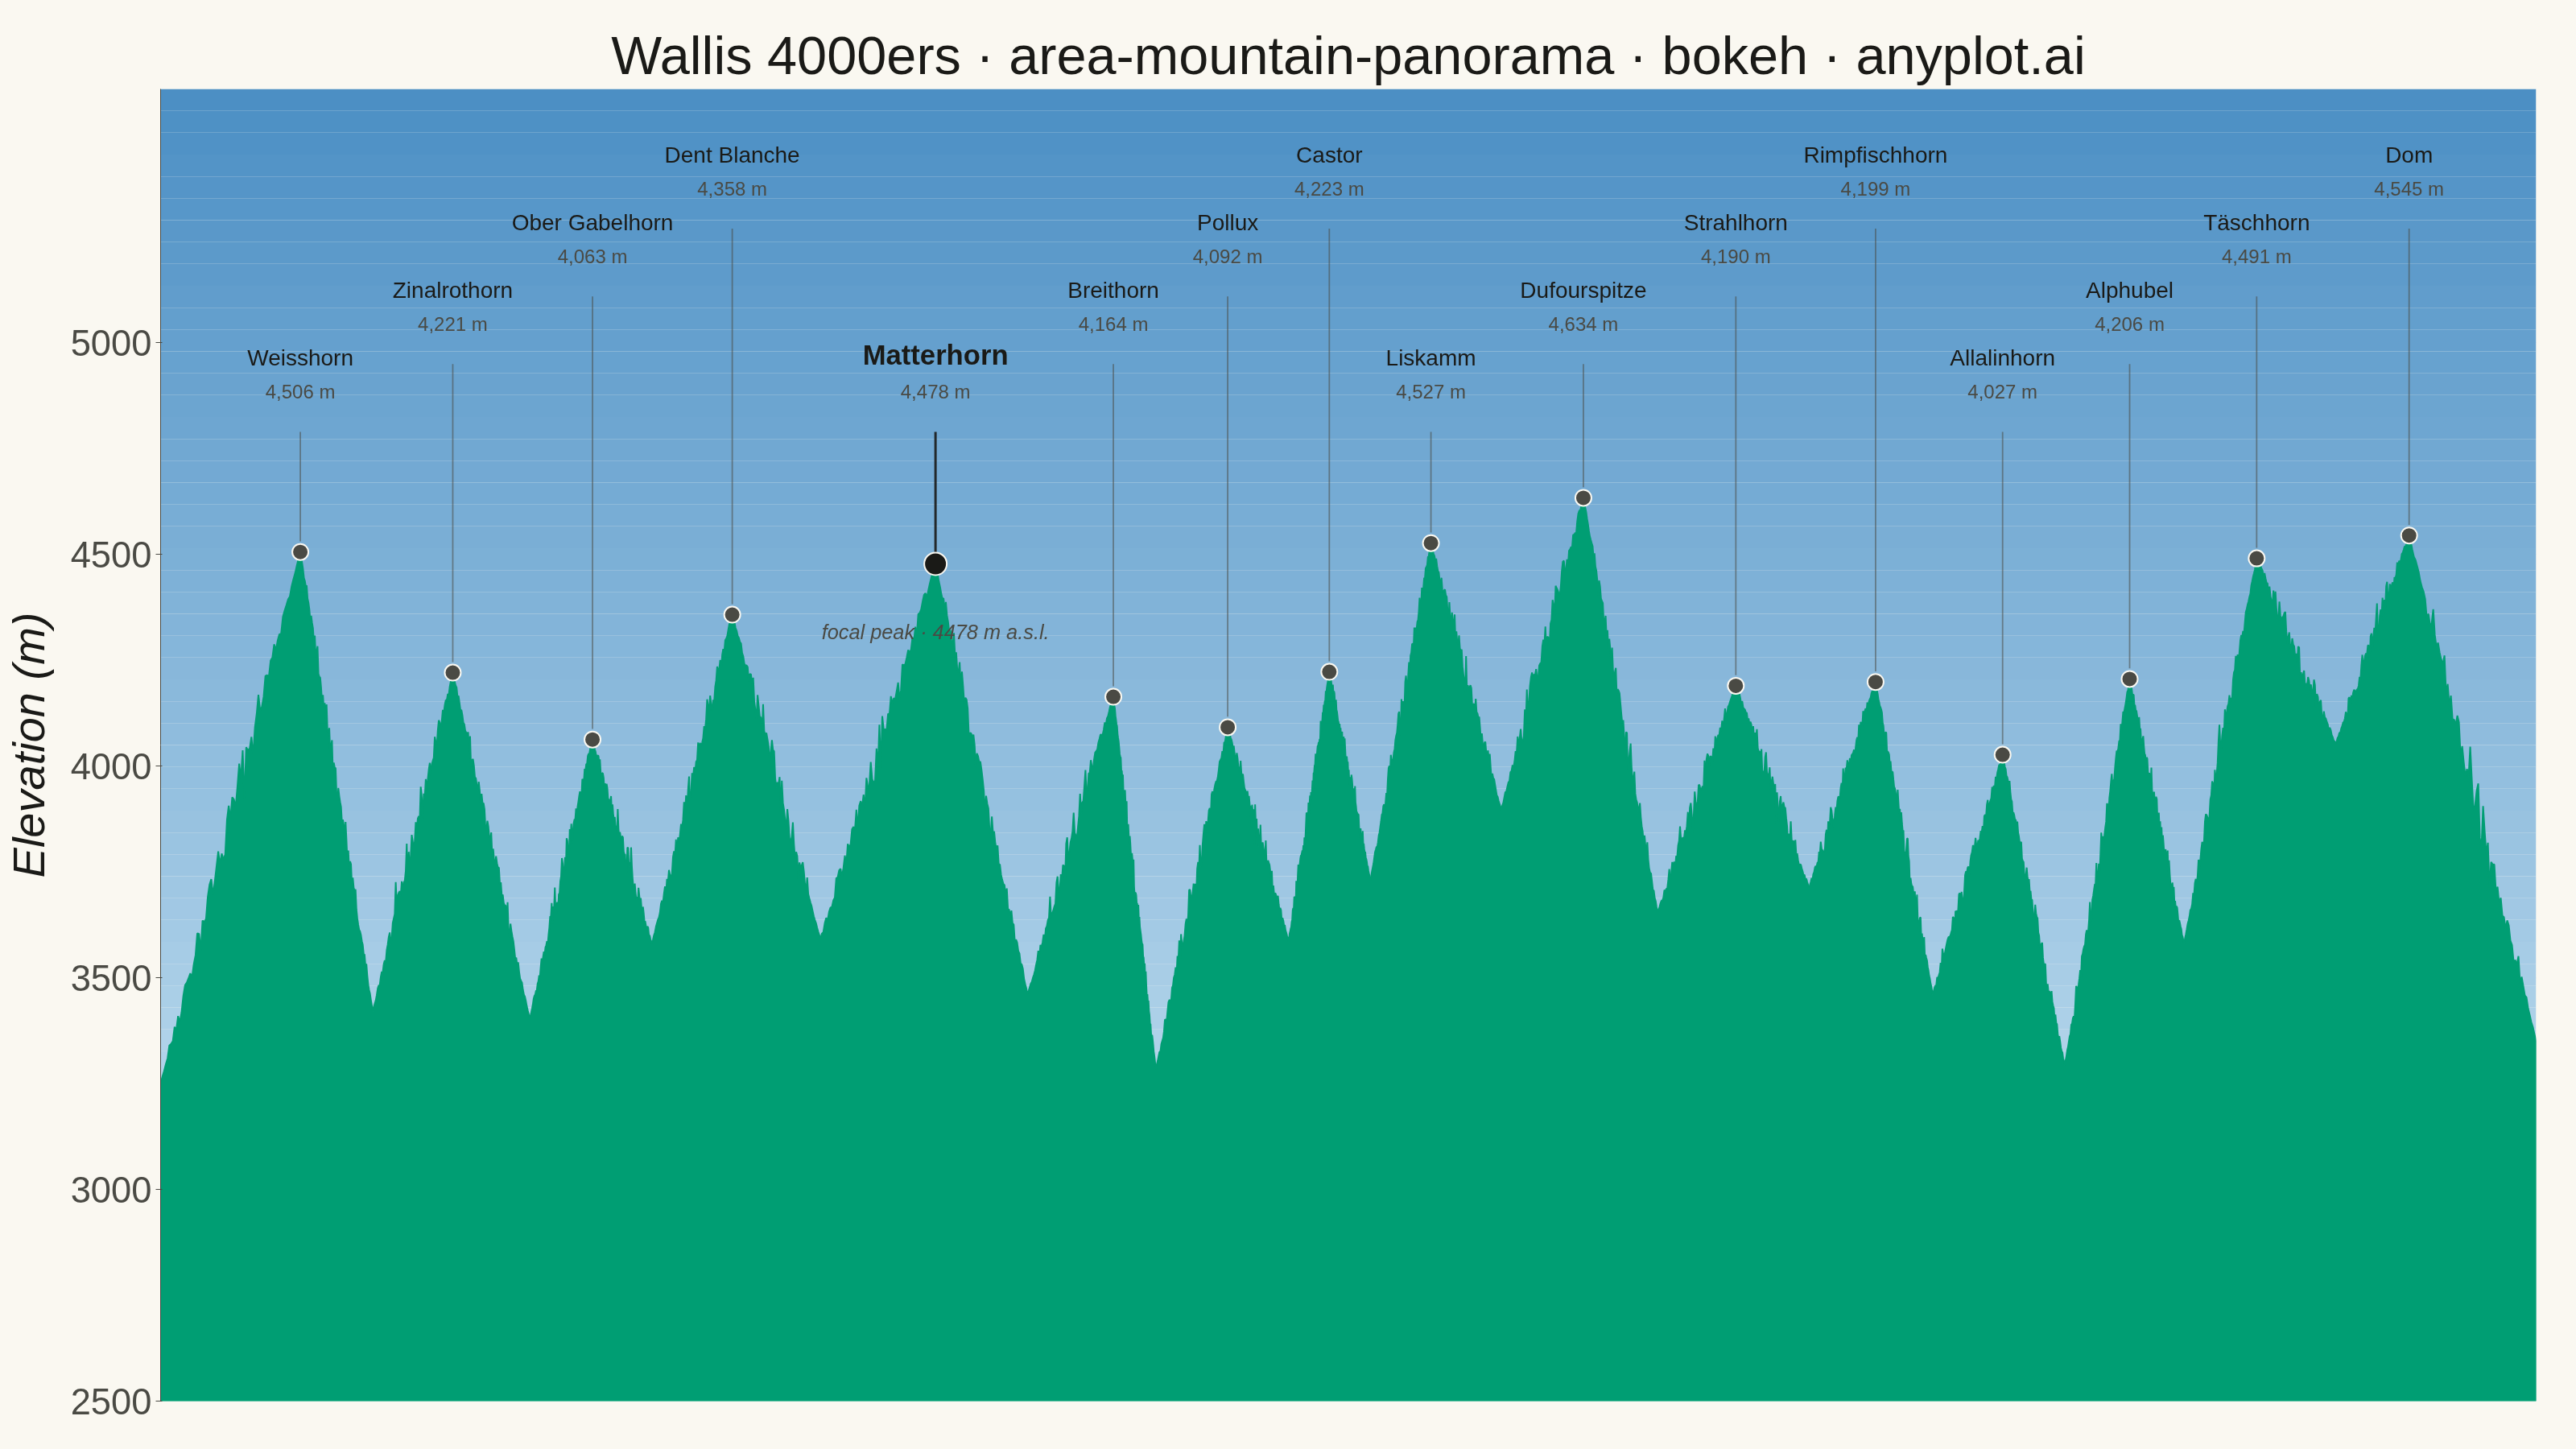
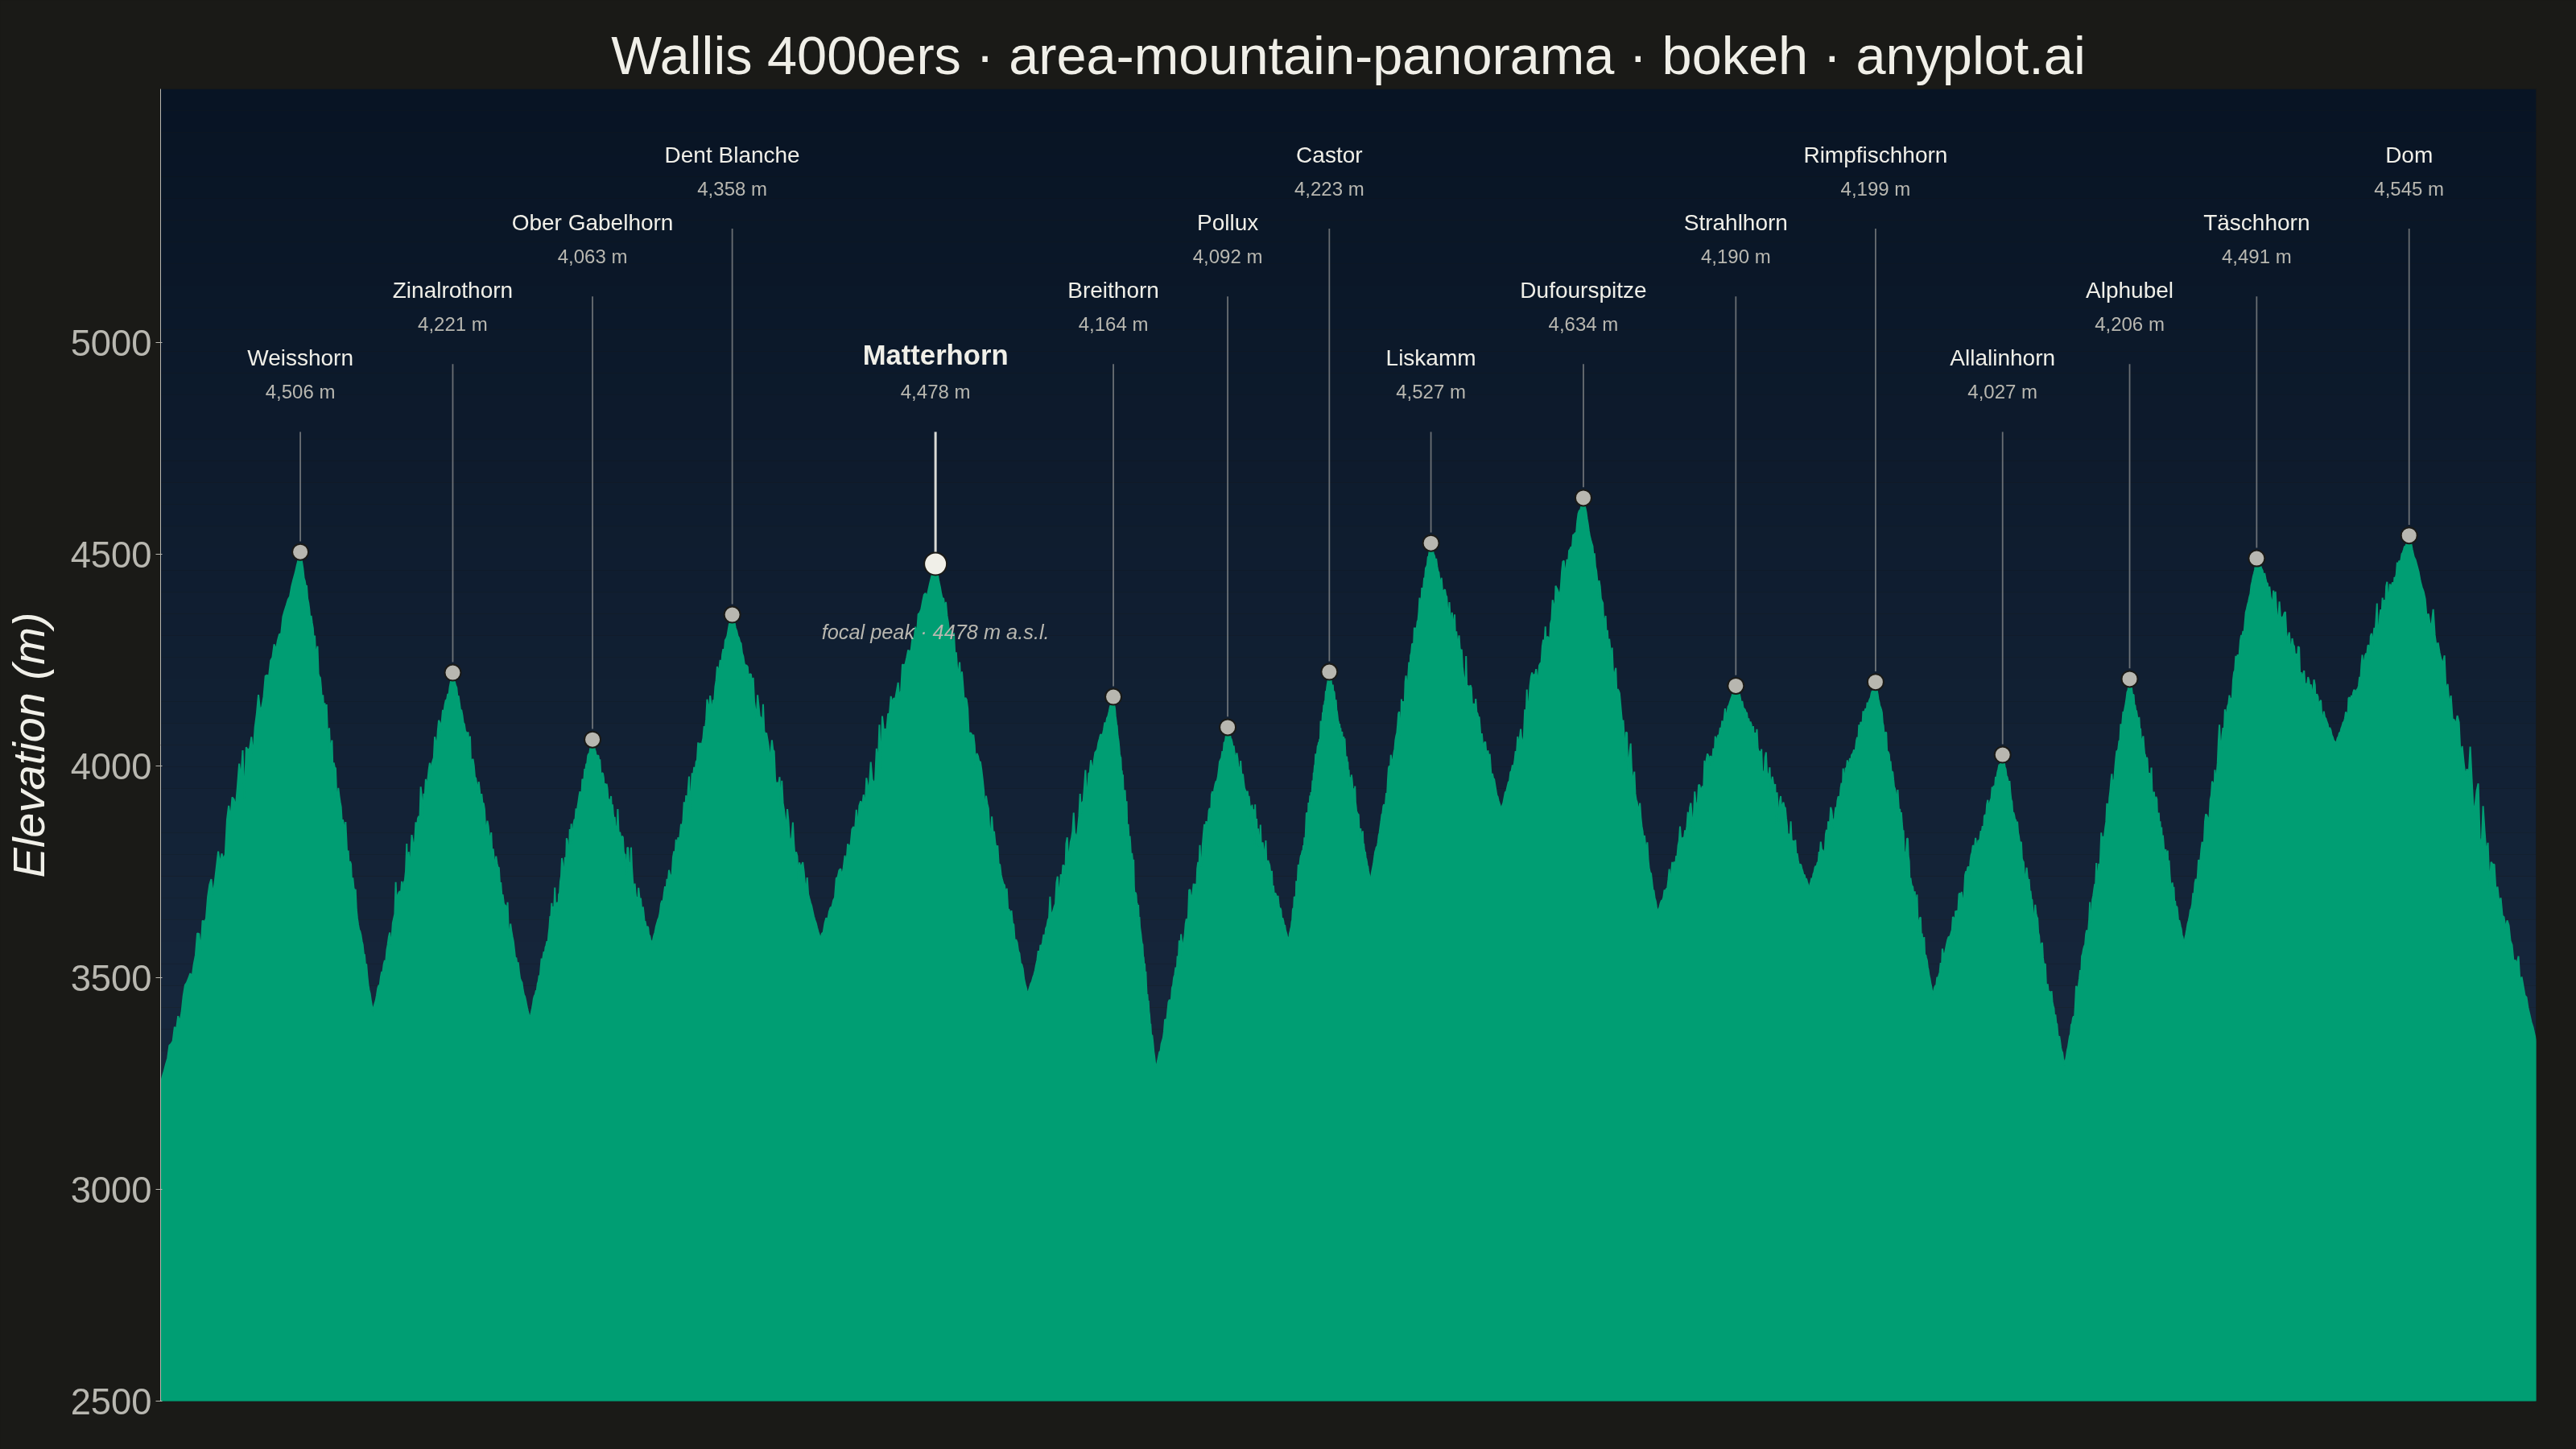
A panoramic mountain silhouette chart that renders the horizon as seen from a fixed vantage point, like a photograph of a ridgeline against the sky. A filled area under the skyline curve traces the ridgeline across a horizontal viewing range (in degrees of bearing or horizontal distance), and major summits are annotated with their name and elevation. The skyline is jagged and angular — sharp triangular peaks with steep, often asymmetric flanks meeting at pointed apexes, connected by rugged ridges with cols, sub-peaks and rocky notches — not a sequence of smooth bell-shaped bumps. Unlike an elevation-profile-along-a-trail, this plot is the angular view of the surrounding peaks from a single observer, making it ideal for summit-identification infographics, alpine panoramas, and travel guides.
""" anyplot.ai
area-mountain-panorama: Mountain Panorama Profile with Labeled Peaks
Library: bokeh 3.9.1 | Python 3.13.14
Quality: 87/100 | Updated: 2026-06-30
"""

import os
import sys
import time
from pathlib import Path


# Remove script's own directory from sys.path to prevent self-shadowing
# (this file is named bokeh.py; without this, `import bokeh` would find itself)
_here = os.path.dirname(os.path.abspath(__file__))
sys.path = [p for p in sys.path if os.path.abspath(p or ".") != _here]

import numpy as np
from bokeh.io import output_file, save
from bokeh.models import ColumnDataSource, FixedTicker, HoverTool, Label
from bokeh.plotting import figure
from selenium import webdriver
from selenium.webdriver.chrome.options import Options


# Theme tokens
THEME = os.getenv("ANYPLOT_THEME", "light")
PAGE_BG = "#FAF8F1" if THEME == "light" else "#1A1A17"
ELEVATED_BG = "#FFFDF6" if THEME == "light" else "#242420"
INK = "#1A1A17" if THEME == "light" else "#F0EFE8"
INK_SOFT = "#4A4A44" if THEME == "light" else "#B8B7B0"
BRAND = "#009E73"  # Imprint palette position 1 — always first series

# Atmospheric sky gradient endpoints per theme
SKY_TOP = "#4A8EC4" if THEME == "light" else "#081424"
SKY_HORIZON = "#D4EBF7" if THEME == "light" else "#1C2E45"

# Data — Wallis (Valais, Switzerland) summit panorama, ordered W → E
peaks = [
    ("Weisshorn", 8, 4506),
    ("Zinalrothorn", 20, 4221),
    ("Ober Gabelhorn", 31, 4063),
    ("Dent Blanche", 42, 4358),
    ("Matterhorn", 58, 4478),
    ("Breithorn", 72, 4164),
    ("Pollux", 81, 4092),
    ("Castor", 89, 4223),
    ("Liskamm", 97, 4527),
    ("Dufourspitze", 109, 4634),
    ("Strahlhorn", 121, 4190),
    ("Rimpfischhorn", 132, 4199),
    ("Allalinhorn", 142, 4027),
    ("Alphubel", 152, 4206),
    ("Täschhorn", 162, 4491),
    ("Dom", 174, 4545),
]

# Build ridgeline control points: peaks alternating with saddles (cols)
np.random.seed(42)
ctrl_x = [-3.0]
ctrl_y = [3250.0]
for i, (_, ang, el) in enumerate(peaks):
    ctrl_x.append(float(ang))
    ctrl_y.append(float(el))
    if i < len(peaks) - 1:
        next_ang = peaks[i + 1][1]
        next_el = peaks[i + 1][2]
        col_ang = (ang + next_ang) / 2 + np.random.uniform(-1.2, 1.2)
        col_drop = np.random.uniform(420, 820)
        col_el = min(el, next_el) - col_drop
        ctrl_x.append(float(col_ang))
        ctrl_y.append(float(col_el))
ctrl_x.append(184.0)
ctrl_y.append(3350.0)
ctrl_x = np.array(ctrl_x)
ctrl_y = np.array(ctrl_y)

# Piecewise-linear ridgeline with fractal jitter — sharp triangular peaks
# Uses linear interpolation (not cosine smoothstep) for pointed alpine apexes;
# tapered Gaussian noise adds rocky texture while preserving clean summit tips.
ridge_x_segs = []
ridge_y_segs = []
for i in range(len(ctrl_x) - 1):
    n = 80
    last = i == len(ctrl_x) - 2
    t = np.linspace(0.0, 1.0, n, endpoint=last)
    y_linear = ctrl_y[i] + (ctrl_y[i + 1] - ctrl_y[i]) * t
    seg_dx = abs(ctrl_x[i + 1] - ctrl_x[i])
    jitter_scale = 28 * np.sqrt(seg_dx / 8.0)
    taper = np.sin(np.pi * t)  # 0 at endpoints → no jitter at exact summit/col
    jitter = np.random.normal(0, jitter_scale, n) * taper
    ridge_x_segs.append(ctrl_x[i] + (ctrl_x[i + 1] - ctrl_x[i]) * t)
    ridge_y_segs.append(y_linear + jitter)

ridge_x = np.concatenate(ridge_x_segs)
ridge_y = np.concatenate(ridge_y_segs)

# Anchor silhouette polygon at y-floor
Y_FLOOR = 2500
Y_TOP = 5600
poly_x = np.concatenate([[ridge_x[0]], ridge_x, [ridge_x[-1]]])
poly_y = np.concatenate([[Y_FLOOR], ridge_y, [Y_FLOOR]])

# 4 label tiers — 3-previous penalty cycles all 4 evenly, spreading eastern cluster
LEVEL_TIERS = [4880, 5040, 5200, 5360]
tier_assignments = []
for i in range(len(peaks)):
    prev_tier = tier_assignments[i - 1] if i > 0 else -1
    prev2_tier = tier_assignments[i - 2] if i > 1 else -1
    prev3_tier = tier_assignments[i - 3] if i > 2 else -1
    scores = []
    for t_idx in range(4):
        penalty = 0
        if t_idx == prev_tier:
            penalty += 4
        if t_idx == prev2_tier:
            penalty += 2
        if t_idx == prev3_tier:
            penalty += 1
        scores.append(penalty)
    tier_assignments.append(int(np.argmin(scores)))

# Canvas — hard rule: 3200×1800 landscape
W, H = 3200, 1800

p = figure(
    width=W,
    height=H,
    title="Wallis 4000ers · area-mountain-panorama · bokeh · anyplot.ai",
    y_axis_label="Elevation (m)",
    x_range=(-3, 184),
    y_range=(Y_FLOOR, Y_TOP),
    background_fill_color=PAGE_BG,
    border_fill_color=PAGE_BG,
    toolbar_location=None,  # disable toolbar — adds ~30-50px above canvas in PNG
    min_border_bottom=60,
    min_border_left=180,
    min_border_top=110,
    min_border_right=50,
)


def _lerp_hex(c0, c1, t):
    r0, g0, b0 = [int(c0[j : j + 2], 16) for j in (1, 3, 5)]
    r1, g1, b1 = [int(c1[j : j + 2], 16) for j in (1, 3, 5)]
    return "#{:02X}{:02X}{:02X}".format(int(r0 + t * (r1 - r0)), int(g0 + t * (g1 - g0)), int(b0 + t * (b1 - b0)))


# Atmospheric sky gradient — drawn first so mountain silhouette overlaps correctly
N_SKY = 60
for k in range(N_SKY):
    t0, t1 = k / N_SKY, (k + 1) / N_SKY
    y0 = Y_FLOOR + t0 * (Y_TOP - Y_FLOOR)
    y1 = Y_FLOOR + t1 * (Y_TOP - Y_FLOOR)
    color = _lerp_hex(SKY_HORIZON, SKY_TOP, t0)
    p.quad(top=[y1], bottom=[y0], left=[-3.0], right=[184.0], color=color, line_color=None)

# Mountain silhouette — Imprint palette position 1 (brand green, always first series)
p.patch(poly_x, poly_y, fill_color=BRAND, line_color=BRAND, line_width=2)

# Peak labels, leader lines, summit dots
peak_names, peak_angles, peak_elevs = [], [], []
labels = []

for i, (name, ang, el) in enumerate(peaks):
    peak_names.append(name)
    peak_angles.append(ang)
    peak_elevs.append(el)

    tier_idx = tier_assignments[i]
    label_y = LEVEL_TIERS[tier_idx]
    is_focal = name == "Matterhorn"
    leader_color = INK if is_focal else INK_SOFT
    leader_alpha = 0.9 if is_focal else 0.55
    leader_width = 3.0 if is_focal else 1.8

    p.line(
        [ang, ang], [el + 25, label_y - 90], line_color=leader_color, line_alpha=leader_alpha, line_width=leader_width
    )

    dot_size = 28 if is_focal else 20
    p.scatter([ang], [el], size=dot_size, fill_color=INK if is_focal else INK_SOFT, line_color=PAGE_BG, line_width=2)

    labels.append(
        Label(
            x=ang,
            y=label_y + 55,
            text=name,
            text_color=INK,
            text_font_size="26pt" if is_focal else "21pt",
            text_font_style="bold" if is_focal else "normal",
            text_align="center",
            text_baseline="bottom",
        )
    )
    labels.append(
        Label(
            x=ang,
            y=label_y + 30,
            text=f"{el:,} m",
            text_color=INK_SOFT,
            text_font_size="18pt",
            text_align="center",
            text_baseline="top",
        )
    )

# Matterhorn focal callout — 19pt INK_SOFT (stronger than prior 16pt INK_MUTED)
labels.append(
    Label(
        x=58,
        y=4290,
        text="focal peak · 4478 m a.s.l.",
        text_color=INK_SOFT,
        text_font_size="19pt",
        text_font_style="italic",
        text_align="center",
        text_baseline="bottom",
    )
)

for lbl in labels:
    p.add_layout(lbl)

# HoverTool — invisible hit targets at each summit for interactive HTML artifact
peak_source = ColumnDataSource(
    {"x": peak_angles, "y": peak_elevs, "name": peak_names, "elevation": peak_elevs, "bearing": peak_angles}
)
hover_targets = p.scatter("x", "y", source=peak_source, size=30, fill_alpha=0.0, line_alpha=0.0)
p.add_tools(
    HoverTool(
        renderers=[hover_targets],
        tooltips=[("Peak", "@name"), ("Elevation", "@elevation{0,0} m"), ("Bearing", "@bearing°")],
    )
)

# Typography — per bokeh.md sizing for 3200×1800
p.title.text_font_size = "50pt"
p.title.text_color = INK
p.title.text_font_style = "normal"
p.title.align = "center"

p.yaxis.axis_label_text_font_size = "42pt"
p.yaxis.axis_label_text_color = INK
p.yaxis.major_label_text_font_size = "34pt"
p.yaxis.major_label_text_color = INK_SOFT
p.yaxis.axis_line_color = INK_SOFT
p.yaxis.major_tick_line_color = INK_SOFT
p.yaxis.minor_tick_line_color = None
p.yaxis.ticker = FixedTicker(ticks=[2500, 3000, 3500, 4000, 4500, 5000])
p.yaxis.axis_label_standoff = 18

# Hide x-axis — bearing angles would clutter the panorama silhouette
p.xaxis.visible = False

# Grid: y-only, very subtle
p.outline_line_color = None
p.xgrid.grid_line_color = None
p.ygrid.grid_line_color = INK
p.ygrid.grid_line_alpha = 0.10

# Save interactive HTML (required catalog artifact)
html_path = Path(f"plot-{THEME}.html")
output_file(str(html_path), title="Wallis 4000ers · area-mountain-panorama · bokeh · anyplot.ai")
save(p)

# Inject body background CSS to prevent thin border artifact in headless-Chrome screenshot
html_content = html_path.read_text()
body_style = f"<style>body{{margin:0;padding:0;background:{PAGE_BG};}}</style>"
html_content = html_content.replace("</head>", f"{body_style}\n</head>", 1)
html_path.write_text(html_content)

# Screenshot via headless Chrome — use CDP to set exact viewport to match figure dimensions
opts = Options()
for arg in (
    "--headless=new",
    "--no-sandbox",
    "--disable-dev-shm-usage",
    "--disable-gpu",
    f"--window-size={W},{H}",
    "--hide-scrollbars",
):
    opts.add_argument(arg)
driver = webdriver.Chrome(options=opts)
driver.execute_cdp_cmd(
    "Emulation.setDeviceMetricsOverride", {"width": W, "height": H, "deviceScaleFactor": 1, "mobile": False}
)
driver.get(f"file://{html_path.resolve()}")
time.sleep(3)
driver.save_screenshot(f"plot-{THEME}.png")
driver.quit()
Runnable source as JSON, for any HTTP client: https://api.anyplot.ai/specs/area-mountain-panorama/bokeh/code. Any spec id and library id listed in llms-full.txt fit the same URL shape; every URL below is complete and callable.
{
  "spec_id": "area-mountain-panorama",
  "language": "python",
  "library": "bokeh",
  "page": "https://anyplot.ai/area-mountain-panorama/python/bokeh",
  "hub": "https://anyplot.ai/area-mountain-panorama",
  "code_json": "https://api.anyplot.ai/specs/area-mountain-panorama/bokeh/code",
  "spec_json": "https://api.anyplot.ai/specs/area-mountain-panorama",
  "render_light_png": "https://storage.googleapis.com/anyplot-images/plots/area-mountain-panorama/python/bokeh/plot-light.png",
  "render_dark_png": "https://storage.googleapis.com/anyplot-images/plots/area-mountain-panorama/python/bokeh/plot-dark.png",
  "interactive_light_html": "https://storage.googleapis.com/anyplot-images/plots/area-mountain-panorama/python/bokeh/plot-light.html",
  "interactive_dark_html": "https://storage.googleapis.com/anyplot-images/plots/area-mountain-panorama/python/bokeh/plot-dark.html",
  "quality_score": 87.0,
  "license": "MIT",
  "guide": "https://anyplot.ai/llms.txt"
}
Part of Mountain Panorama Profile with Labeled Peaks on anyplot.ai.