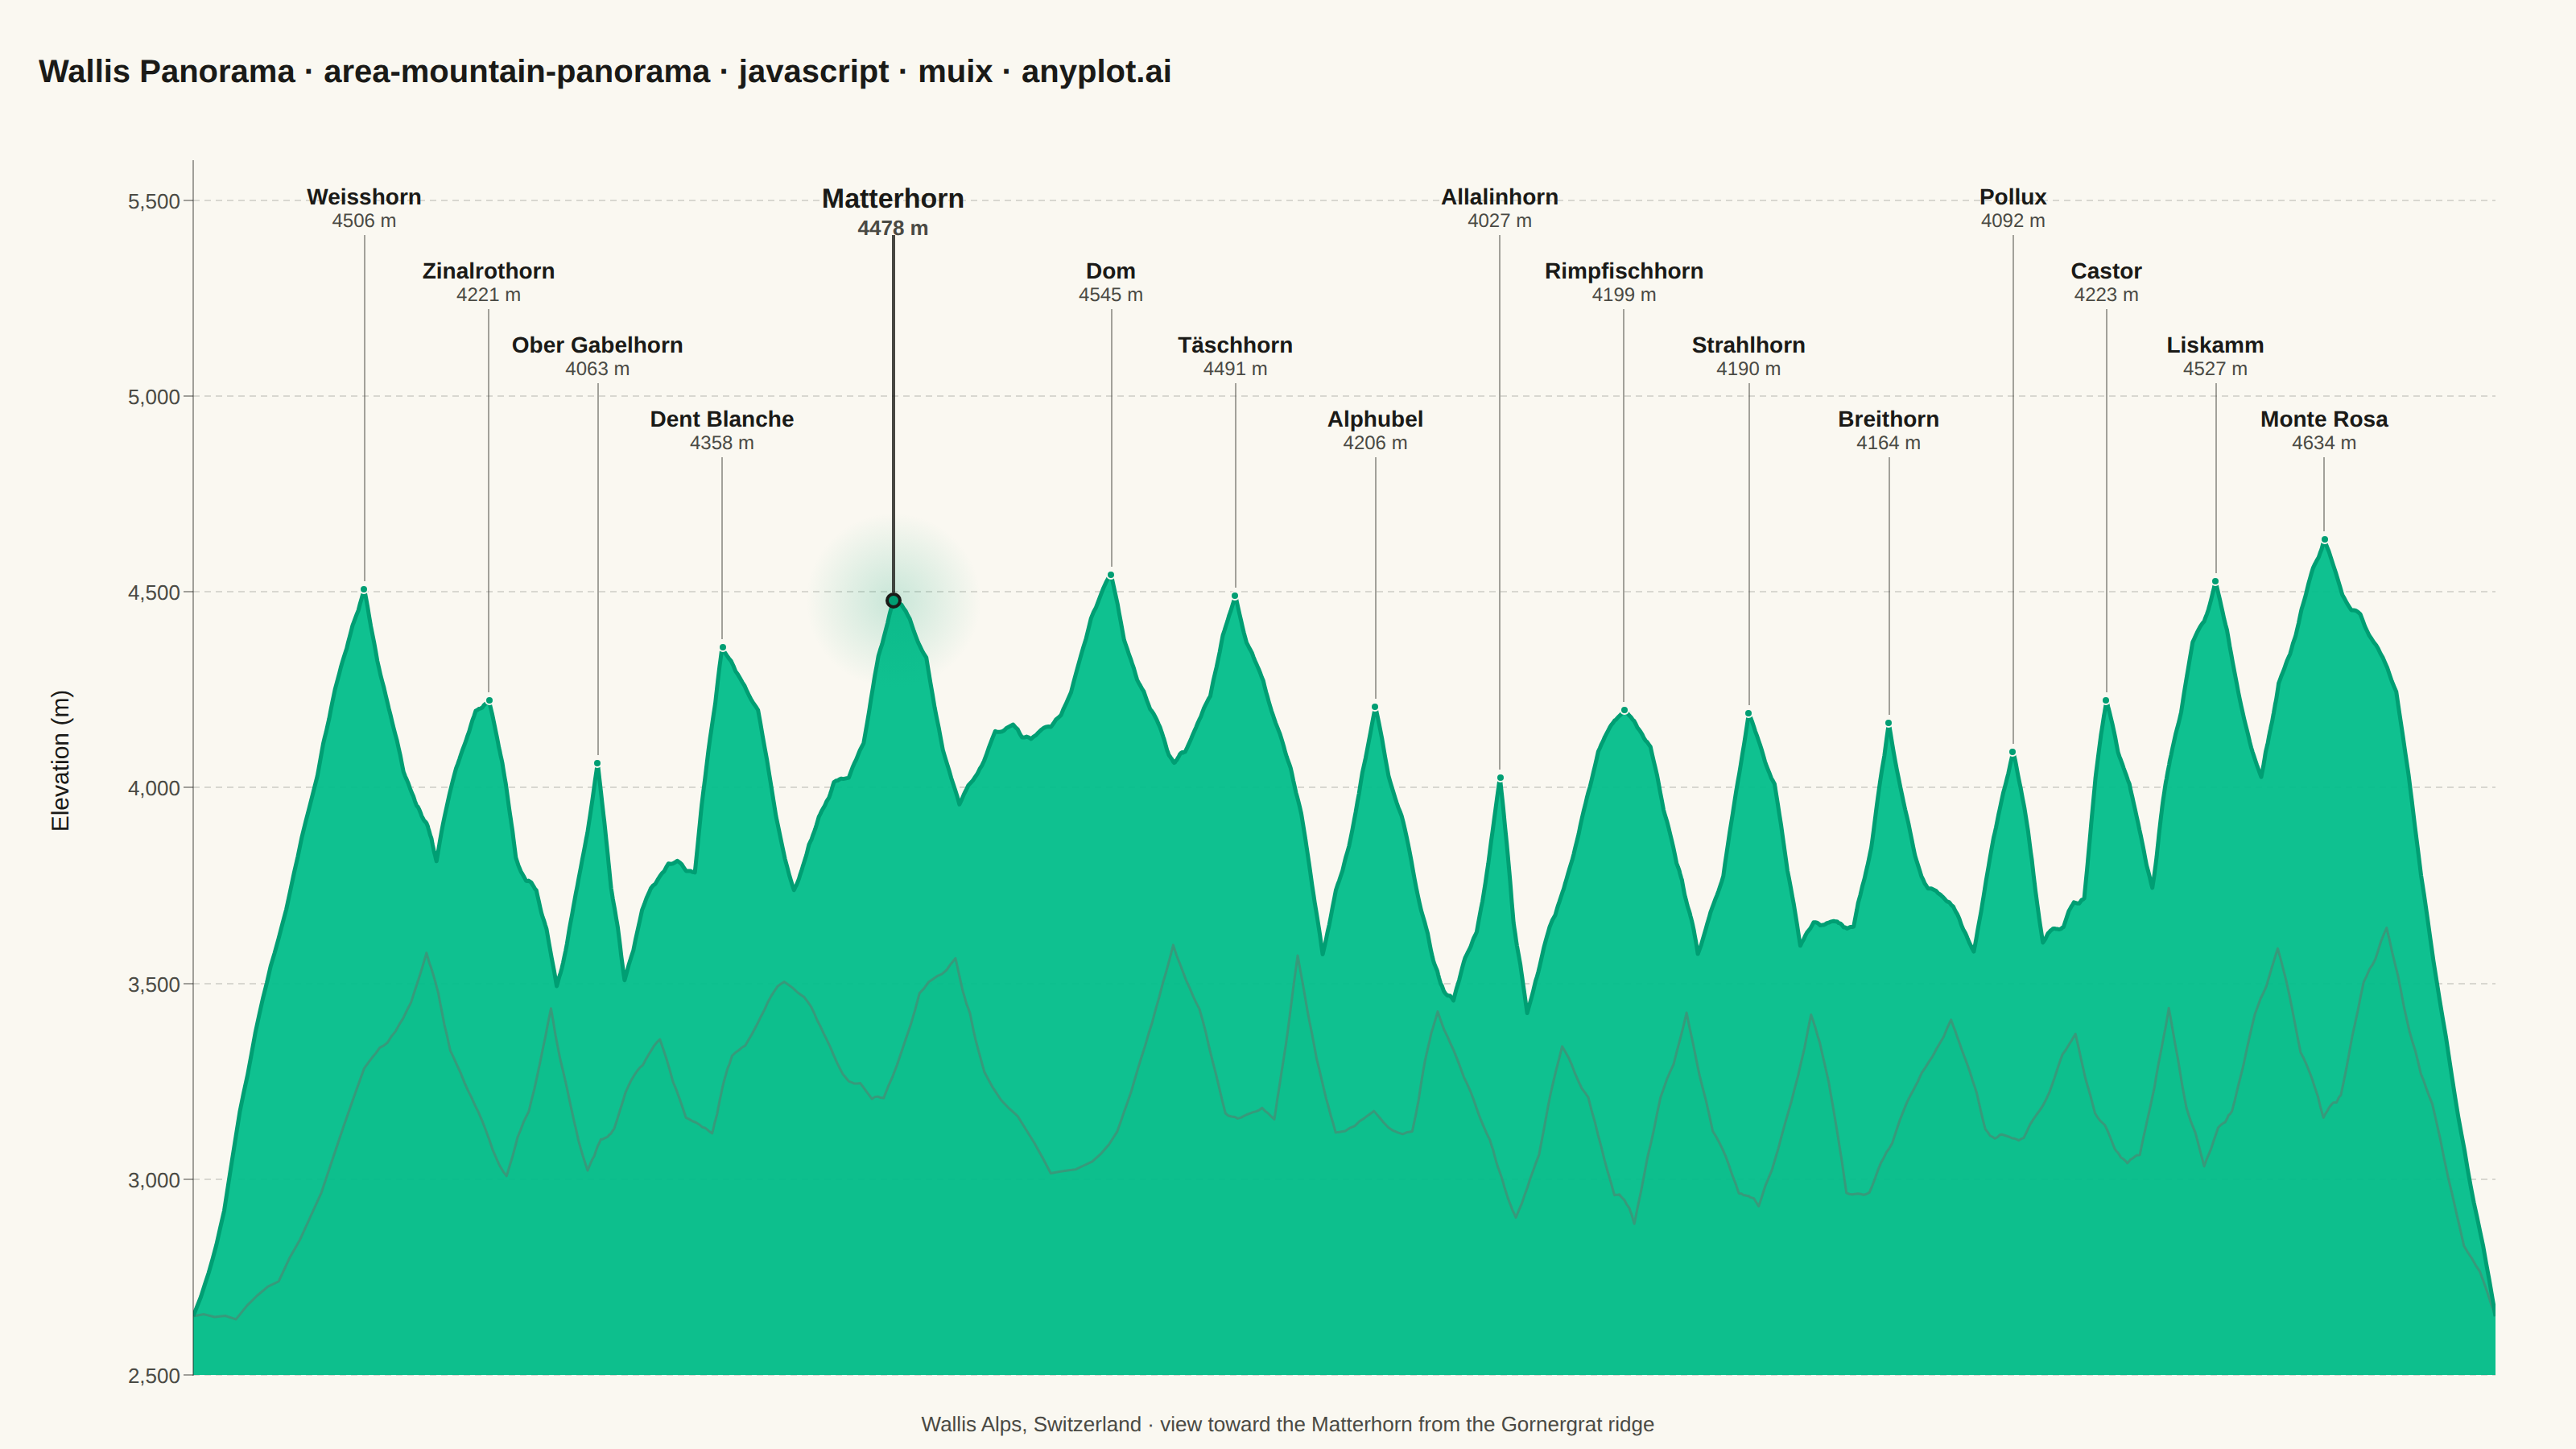
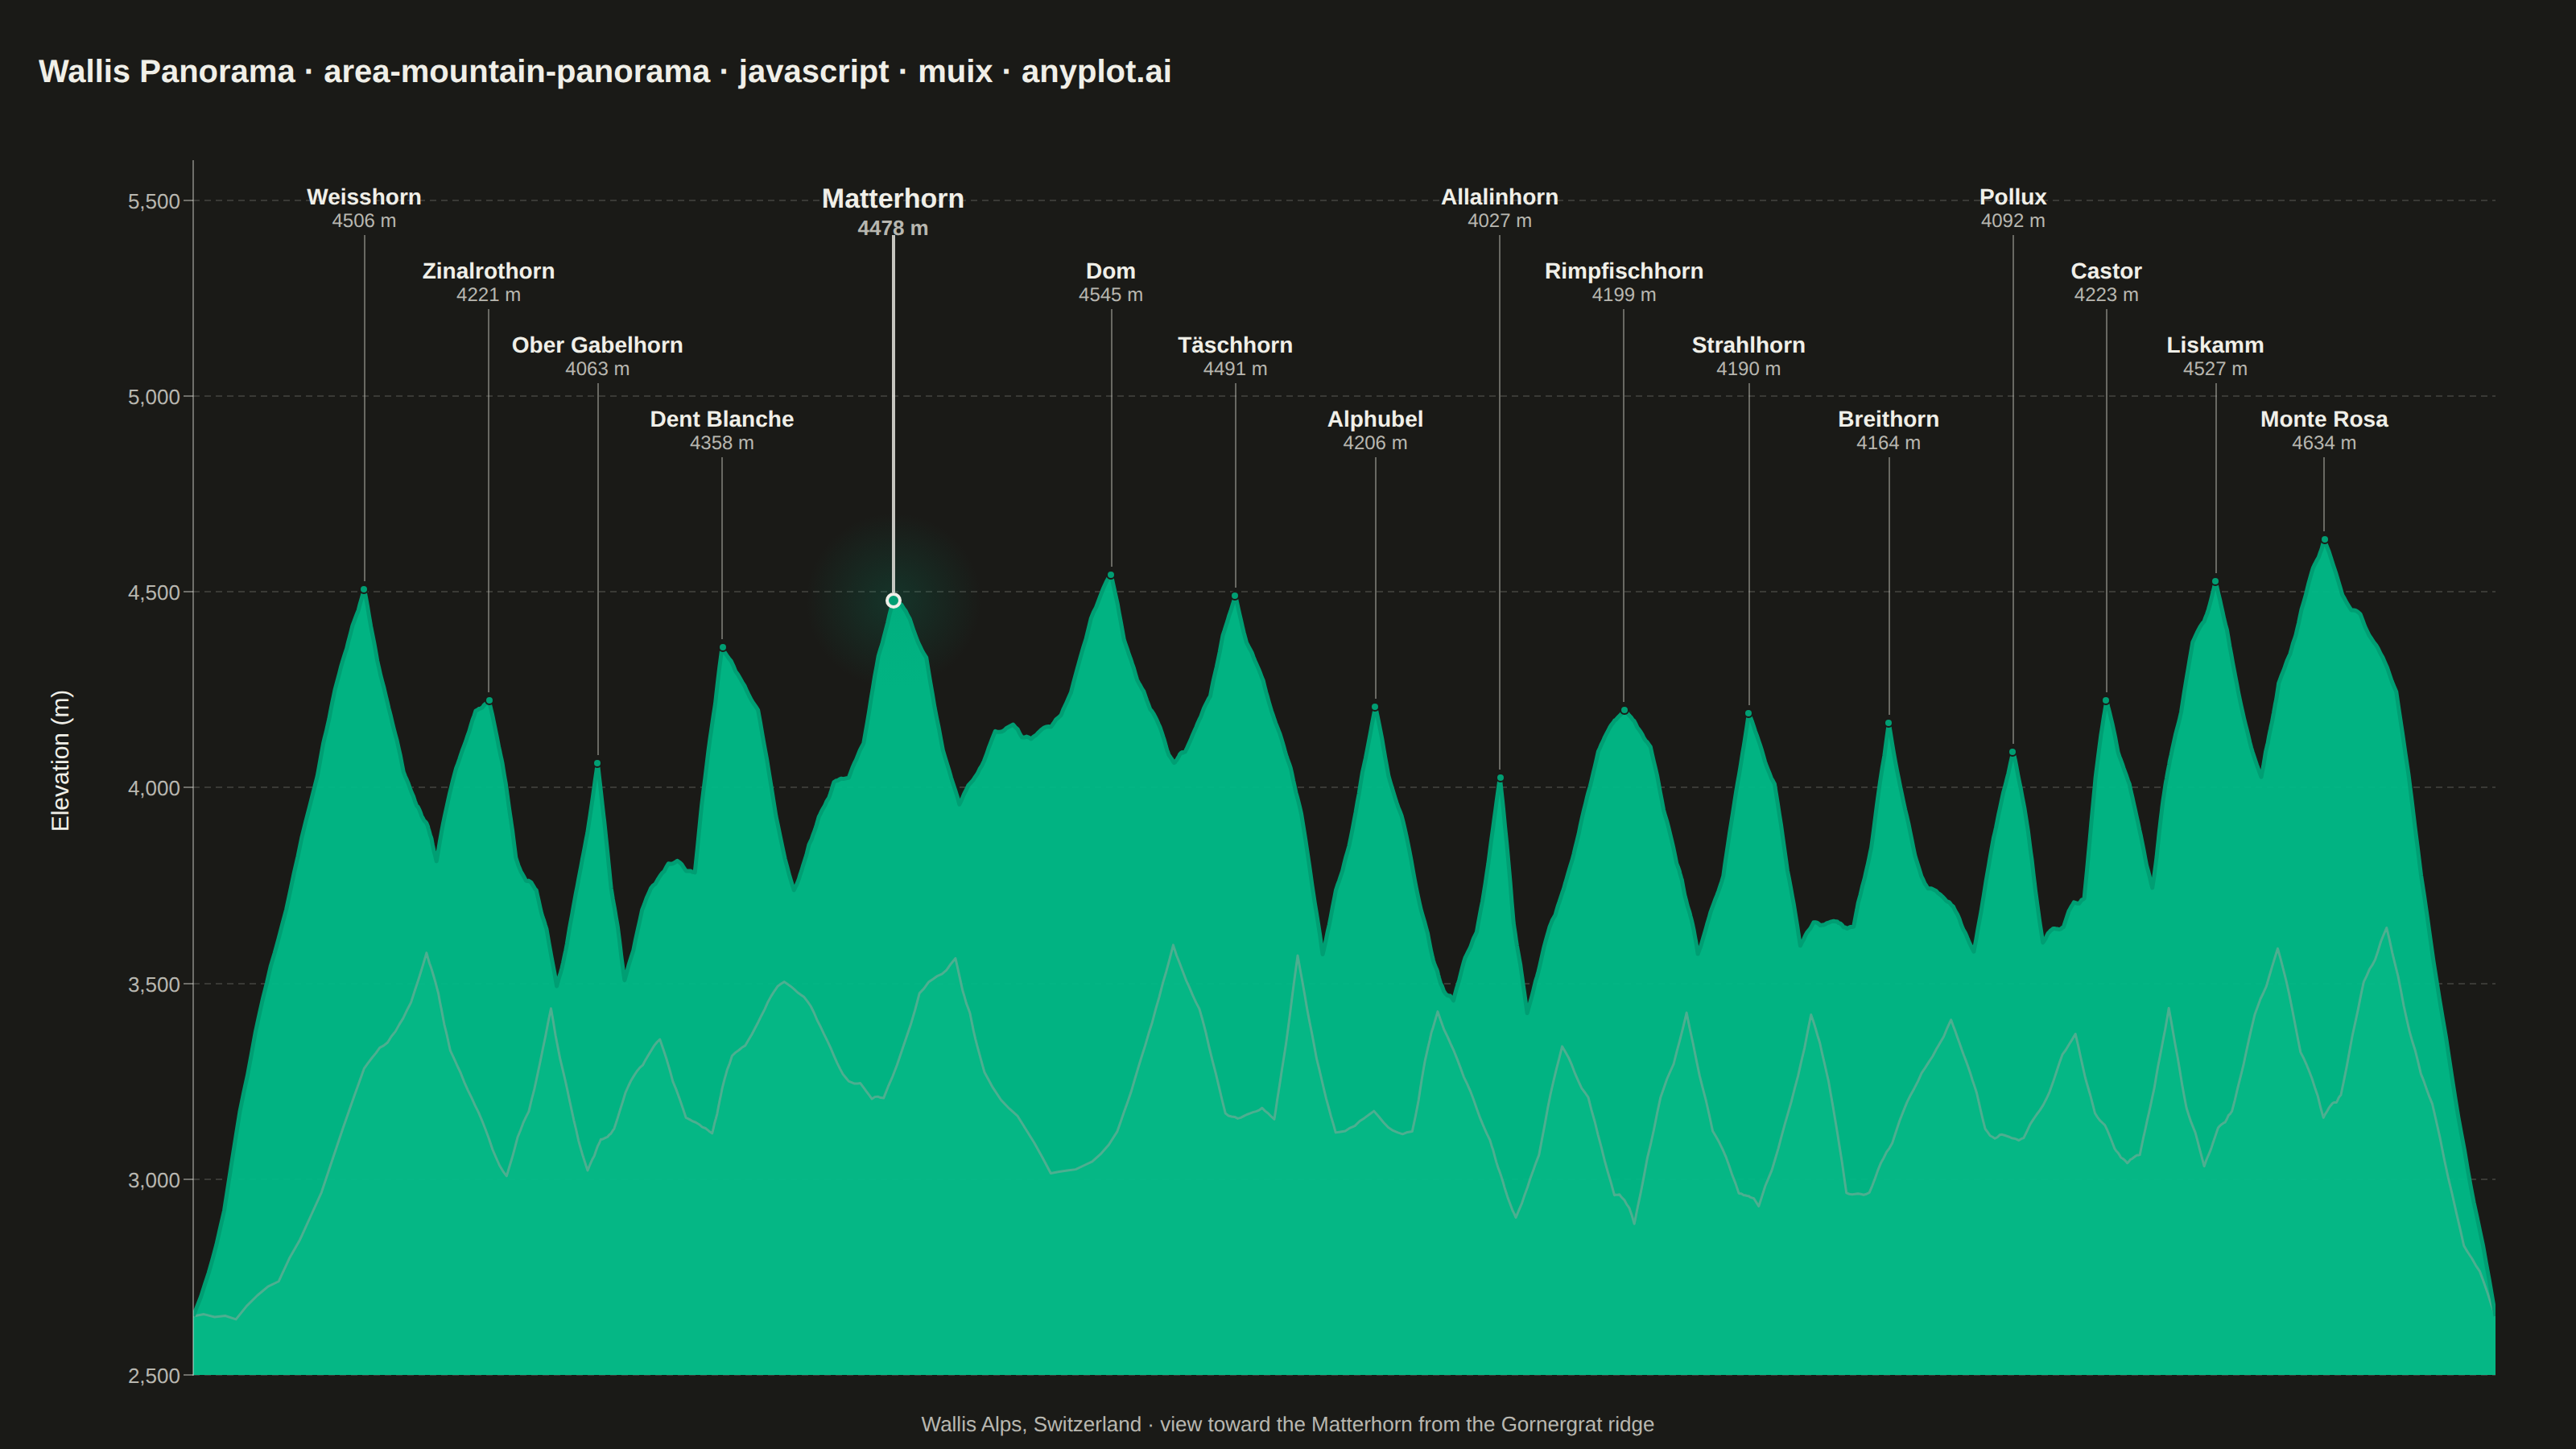
The same plot in 14 other libraries — JavaScript: Chart.js, D3.js, Apache ECharts, Highcharts; Python: Altair, Bokeh, lets-plot, Matplotlib, Plotly, plotnine, Pygal, Seaborn; R: ggplot2; Julia: Makie.jl. Compare all 15 side by side: Mountain Panorama Profile with Labeled Peaks in Python, R, Julia and JavaScript.
A panoramic mountain silhouette chart that renders the horizon as seen from a fixed vantage point, like a photograph of a ridgeline against the sky. A filled area under the skyline curve traces the ridgeline across a horizontal viewing range (in degrees of bearing or horizontal distance), and major summits are annotated with their name and elevation. The skyline is jagged and angular — sharp triangular peaks with steep, often asymmetric flanks meeting at pointed apexes, connected by rugged ridges with cols, sub-peaks and rocky notches — not a sequence of smooth bell-shaped bumps. Unlike an elevation-profile-along-a-trail, this plot is the angular view of the surrounding peaks from a single observer, making it ideal for summit-identification infographics, alpine panoramas, and travel guides.
// anyplot.ai
// area-mountain-panorama: Mountain Panorama Profile with Labeled Peaks
// Library: muix 7.29.1 | JavaScript 22.23.2
// Quality: 90/100 | Created: 2026-08-20
//# anyplot-orientation: landscape
// anyplot.ai
// area-mountain-panorama: Mountain Panorama Profile with Labeled Peaks
// Library: muix 7.29.1 | JavaScript 22
// License: @mui/x-charts — MIT (community). Pro/Premium are out of scope.
// Quality: pending | Created: 2026-08-20

import { LineChart } from "@mui/x-charts/LineChart";

const t = window.ANYPLOT_TOKENS;
// Tertiary/"muted" theme anchor (default-style-guide.md) — the harness's
// ANYPLOT_TOKENS doesn't carry it, so it's derived the same way as t.inkSoft.
const MUTED = t.theme === "dark" ? "#A8A79F" : "#6B6A63";

// --- Deterministic PRNG (mulberry32) — the browser has no seeded Math.random ---
function mulberry32(seed) {
  let a = seed;
  return function random() {
    a |= 0;
    a = (a + 0x6d2b79f5) | 0;
    let x = Math.imul(a ^ (a >>> 15), 1 | a);
    x = (x + Math.imul(x ^ (x >>> 7), 61 | x)) ^ x;
    return ((x ^ (x >>> 14)) >>> 0) / 4294967296;
  };
}

// --- Wallis (Valais, Switzerland) panorama anchored on the Matterhorn — the
// classic Zermatt / Gornergrat view across the 4000 m Wallis summits ---
const PEAKS = [
  { name: "Weisshorn", angle: -62, elev: 4506 },
  { name: "Zinalrothorn", angle: -54, elev: 4221 },
  { name: "Ober Gabelhorn", angle: -47, elev: 4063 },
  { name: "Dent Blanche", angle: -39, elev: 4358 },
  { name: "Matterhorn", angle: -28, elev: 4478 },
  { name: "Dom", angle: -14, elev: 4545 },
  { name: "Täschhorn", angle: -6, elev: 4491 },
  { name: "Alphubel", angle: 3, elev: 4206 },
  { name: "Allalinhorn", angle: 11, elev: 4027 },
  { name: "Rimpfischhorn", angle: 19, elev: 4199 },
  { name: "Strahlhorn", angle: 27, elev: 4190 },
  { name: "Breithorn", angle: 36, elev: 4164 },
  { name: "Pollux", angle: 44, elev: 4092 },
  { name: "Castor", angle: 50, elev: 4223 },
  { name: "Liskamm", angle: 57, elev: 4527 },
  { name: "Monte Rosa", angle: 64, elev: 4634 },
];

const BASELINE = 2650; // valley-floor elevation at the panorama's flat edges
const EDGE_PAD = 11;
const X_MIN = PEAKS[0].angle - EDGE_PAD;
const X_MAX = PEAKS[PEAKS.length - 1].angle + EDGE_PAD;
const Y_MIN = 2500; // sensible lower bound — keeps the ridge in the upper plot
const Y_MAX = 5600; // headroom above the tallest summit for staggered labels

// Coarse control-point skyline: baseline -> (col, apex, col) per summit -> baseline.
// Flank widths and saddle depths vary per peak (steep/gentle asymmetry) but are
// always clamped below the gap to the next summit, so shoulders never cross.
function buildControlPoints(peaks, rng, prominenceRange) {
  const pts = [{ angle: X_MIN, elev: BASELINE }];
  for (let i = 0; i < peaks.length; i++) {
    const p = peaks[i];
    const prevAngle = i === 0 ? X_MIN : peaks[i - 1].angle;
    const nextAngle = i === peaks.length - 1 ? X_MAX : peaks[i + 1].angle;
    const widthBefore = Math.min(1.4 + rng() * 3.8, (p.angle - prevAngle) * 0.42);
    const widthAfter = Math.min(1.4 + rng() * 3.8, (nextAngle - p.angle) * 0.42);
    const prominence = prominenceRange[0] + rng() * (prominenceRange[1] - prominenceRange[0]);
    const colElev = Math.max(BASELINE, p.elev - prominence);
    pts.push({ angle: p.angle - widthBefore, elev: colElev + (rng() - 0.5) * 90 });
    pts.push({ angle: p.angle, elev: p.elev });
    pts.push({ angle: p.angle + widthAfter, elev: colElev + (rng() - 0.5) * 90 });
  }
  pts.push({ angle: X_MAX, elev: BASELINE });
  return pts;
}

// Midpoint-displacement roughening (1-D terrain fractal). Jitter amplitude scales
// with each segment's own span, so the short flanks right next to a summit stay
// sharp while long saddle stretches pick up rugged sub-peaks and rocky notches.
// Original vertices (incl. every peak apex) are carried through untouched.
function roughen(points, rng, depth, ampPerDegree, persistence) {
  let pts = points;
  let amp = ampPerDegree;
  for (let d = 0; d < depth; d++) {
    const next = [pts[0]];
    for (let i = 0; i < pts.length - 1; i++) {
      const a = pts[i];
      const b = pts[i + 1];
      const span = b.angle - a.angle;
      const jitter = (rng() - 0.5) * 2 * amp * span;
      const midElev = Math.max(BASELINE - 40, (a.elev + b.elev) / 2 + jitter);
      next.push({ angle: (a.angle + b.angle) / 2, elev: midElev });
      next.push(b);
    }
    pts = next;
    amp *= persistence;
  }
  return pts;
}

const rngFg = mulberry32(20260820);
// Prominence capped so cols between neighboring 4000ers stay well above the
// valley floor (real Wallis cols sit ~3400-3900 m) — a connected ridge, not
// isolated witch's-hat spikes.
const fgControl = buildControlPoints(PEAKS, rngFg, [380, 620]);
const fgRidge = roughen(fgControl, rngFg, 5, 40, 0.58);
const fgAngles = fgRidge.map((p) => p.angle);
const fgElevs = fgRidge.map((p) => Math.round(p.elev));

// Background haze ridge: a lower, hazier receding row of sub-summits, shifted a
// few degrees east — same angular span, independent shape, no labels — for the
// "layered depth toward the sky" cue from a classic panorama photograph.
const HAZE_PEAKS = PEAKS.map((p) => ({ angle: p.angle + 4, elev: BASELINE + (p.elev - BASELINE) * 0.5 }));
const rngBg = mulberry32(777);
const bgControl = buildControlPoints(HAZE_PEAKS, rngBg, [200, 520]);
const bgRidge = roughen(bgControl, rngBg, 4, 26, 0.55);
const bgAngles = bgRidge.map((p) => p.angle);
const bgElevs = bgRidge.map((p) => Math.round(p.elev));

const TITLE = "Wallis Panorama · area-mountain-panorama · javascript · muix · anyplot.ai";
const TITLE_FS = Math.max(16, Math.round(22 * 67 / TITLE.length));

// Chart coordinate space constants — shared by LineChart's own scale and the
// hand-placed peak-label/leader-line overlay below.
const MARGIN = { top: 26, right: 26, bottom: 16, left: 96 };

function toPixel(angle, elev, chartW, chartH) {
  const pw = chartW - MARGIN.left - MARGIN.right;
  const ph = chartH - MARGIN.top - MARGIN.bottom;
  return {
    left: MARGIN.left + ((angle - X_MIN) / (X_MAX - X_MIN)) * pw,
    top: MARGIN.top + (1 - (elev - Y_MIN) / (Y_MAX - Y_MIN)) * ph,
  };
}

// Label staggering: round-robin through 4 fixed label "shelves" near the top
// of the chart, in angle order — leader lines run from each shelf down to the
// summit's own (varying) elevation, so shelf assignment is a pure horizontal
// problem. PEAKS are fairly evenly spaced (6-14 deg apart), so any two summits
// sharing a shelf are always 3 summits apart — far more horizontal room than
// a label ever needs — which keeps neighboring names from colliding.
const LABEL_ROWS = [0, 46, 92, 138];

function assignTiers(peaksPx) {
  return peaksPx.map((p, i) => ({ ...p, tier: i % LABEL_ROWS.length }));
}

export default function Chart() {
  const W = window.ANYPLOT_SIZE.width;
  const H = window.ANYPLOT_SIZE.height;

  const PAD_TOP = 16;
  const HEADER_H = 58;
  const FOOTER_H = 30;
  const PAD_SIDE = 24;
  const chartW = W - PAD_SIDE * 2;
  const chartH = H - PAD_TOP - HEADER_H - FOOTER_H;

  const peaksPx = assignTiers(
    PEAKS.map((p) => ({ ...p, ...toPixel(p.angle, p.elev, chartW, chartH) }))
  );

  return (
    <div
      style={{
        width: W,
        height: H,
        backgroundColor: t.pageBg,
        display: "flex",
        flexDirection: "column",
        padding: `${PAD_TOP}px ${PAD_SIDE}px 0`,
        boxSizing: "border-box",
        fontFamily: "sans-serif",
      }}
    >
      <div
        style={{
          color: t.ink,
          fontSize: TITLE_FS,
          fontWeight: 600,
          lineHeight: `${HEADER_H}px`,
          flexShrink: 0,
          whiteSpace: "nowrap",
          overflow: "hidden",
          textOverflow: "ellipsis",
        }}
      >
        {TITLE}
      </div>

      <div style={{ position: "relative", width: chartW, height: chartH, flexShrink: 0 }}>
        <LineChart
          width={chartW}
          height={chartH}
          margin={MARGIN}
          skipAnimation
          bottomAxis={null}
          grid={{ horizontal: true }}
          xAxis={[
            { id: "x", data: fgAngles, min: X_MIN, max: X_MAX, scaleType: "linear", domainLimit: "strict" },
            { id: "xBg", data: bgAngles, min: X_MIN, max: X_MAX, scaleType: "linear", domainLimit: "strict" },
          ]}
          yAxis={[
            {
              min: Y_MIN,
              max: Y_MAX,
              domainLimit: "strict",
              tickMinStep: 500,
              tickLabelStyle: { fontSize: 13, fill: t.inkSoft },
            },
          ]}
          series={[
            { id: "haze", xAxisId: "xBg", data: bgElevs, area: true, showMark: false, curve: "linear", color: MUTED },
            { id: "ridge", data: fgElevs, area: true, showMark: false, curve: "linear", color: t.palette[0] },
          ]}
          sx={{
            "& .MuiAreaElement-series-haze": { fillOpacity: 0.32 },
            "& .MuiLineElement-series-haze": { strokeWidth: 1.5, strokeOpacity: 0.45 },
            "& .MuiAreaElement-series-ridge": { fillOpacity: 0.94 },
            "& .MuiLineElement-series-ridge": { strokeWidth: 2.5 },
            "& .MuiChartsGrid-line": { stroke: t.grid, strokeDasharray: "4 3" },
            "& .MuiChartsAxis-line": { stroke: t.inkSoft, strokeOpacity: 0.4 },
            "& .MuiChartsAxis-tick": { stroke: t.inkSoft, strokeOpacity: 0.4 },
          }}
        />

        {/* Hand-placed y-axis title — MUI X's built-in axis label sits too close
            to wide tick text at this font size, so it's positioned manually. */}
        <div
          style={{
            position: "absolute",
            left: 0,
            top: 0,
            width: 28,
            height: chartH,
            display: "flex",
            alignItems: "center",
            justifyContent: "center",
            pointerEvents: "none",
          }}
        >
          <div style={{ transform: "rotate(-90deg)", whiteSpace: "nowrap", color: t.ink, fontSize: 15, fontWeight: 500 }}>
            Elevation (m)
          </div>
        </div>

        {peaksPx.map((p) => {
          // The Matterhorn is the panorama's stated anchor summit — give it a
          // distinct highlight (bigger ink-stroked apex, soft brand-green glow,
          // bolder label) so it reads as the composition's focal point, using
          // only the existing brand green + ink tokens (no new hue).
          const isFocal = p.name === "Matterhorn";
          const labelTop = MARGIN.top + 14 + LABEL_ROWS[p.tier];
          const lineTop = labelTop + 32;
          const lineHeight = Math.max(0, p.top - lineTop - 5);
          return (
            <div key={p.name}>
              {isFocal && (
                <div
                  style={{
                    position: "absolute",
                    left: p.left - 55,
                    top: p.top - 55,
                    width: 110,
                    height: 110,
                    borderRadius: "50%",
                    background: `radial-gradient(circle, ${t.palette[0]}33 0%, ${t.palette[0]}00 70%)`,
                    pointerEvents: "none",
                  }}
                />
              )}
              <div
                style={{
                  position: "absolute",
                  left: p.left - 0.5,
                  top: lineTop,
                  width: isFocal ? 2 : 1,
                  height: lineHeight,
                  backgroundColor: isFocal ? t.ink : t.inkSoft,
                  opacity: isFocal ? 0.8 : 0.5,
                  pointerEvents: "none",
                }}
              />
              <div
                style={{
                  position: "absolute",
                  left: p.left - (isFocal ? 5 : 3),
                  top: p.top - (isFocal ? 5 : 3),
                  width: isFocal ? 10 : 6,
                  height: isFocal ? 10 : 6,
                  borderRadius: "50%",
                  backgroundColor: t.palette[0],
                  border: `${isFocal ? 2 : 1.5}px solid ${isFocal ? t.ink : t.pageBg}`,
                  pointerEvents: "none",
                }}
              />
              <div
                style={{
                  position: "absolute",
                  left: p.left,
                  top: labelTop,
                  transform: "translateX(-50%)",
                  textAlign: "center",
                  whiteSpace: "nowrap",
                  pointerEvents: "none",
                }}
              >
                <div style={{ color: t.ink, fontSize: isFocal ? 17 : 14, fontWeight: isFocal ? 800 : 700 }}>
                  {p.name}
                </div>
                <div style={{ color: t.inkSoft, fontSize: isFocal ? 13 : 12, fontWeight: isFocal ? 700 : 400 }}>
                  {p.elev} m
                </div>
              </div>
            </div>
          );
        })}
      </div>

      <div
        style={{
          color: t.inkSoft,
          fontSize: 13,
          textAlign: "center",
          lineHeight: `${FOOTER_H}px`,
          flexShrink: 0,
        }}
      >
        Wallis Alps, Switzerland · view toward the Matterhorn from the Gornergrat ridge
      </div>
    </div>
  );
}
Runnable source as JSON, for any HTTP client: https://api.anyplot.ai/specs/area-mountain-panorama/muix/code. Any spec id and library id listed in llms-full.txt fit the same URL shape; every URL below is complete and callable.
{
  "spec_id": "area-mountain-panorama",
  "language": "javascript",
  "library": "muix",
  "page": "https://anyplot.ai/area-mountain-panorama/javascript/muix",
  "hub": "https://anyplot.ai/area-mountain-panorama",
  "code_json": "https://api.anyplot.ai/specs/area-mountain-panorama/muix/code",
  "spec_json": "https://api.anyplot.ai/specs/area-mountain-panorama",
  "render_light_png": "https://storage.googleapis.com/anyplot-images/plots/area-mountain-panorama/javascript/muix/plot-light.png",
  "render_dark_png": "https://storage.googleapis.com/anyplot-images/plots/area-mountain-panorama/javascript/muix/plot-dark.png",
  "interactive_light_html": "https://storage.googleapis.com/anyplot-images/plots/area-mountain-panorama/javascript/muix/plot-light.html",
  "interactive_dark_html": "https://storage.googleapis.com/anyplot-images/plots/area-mountain-panorama/javascript/muix/plot-dark.html",
  "quality_score": 90.0,
  "license": "MIT",
  "guide": "https://anyplot.ai/llms.txt"
}
Part of Mountain Panorama Profile with Labeled Peaks on anyplot.ai.