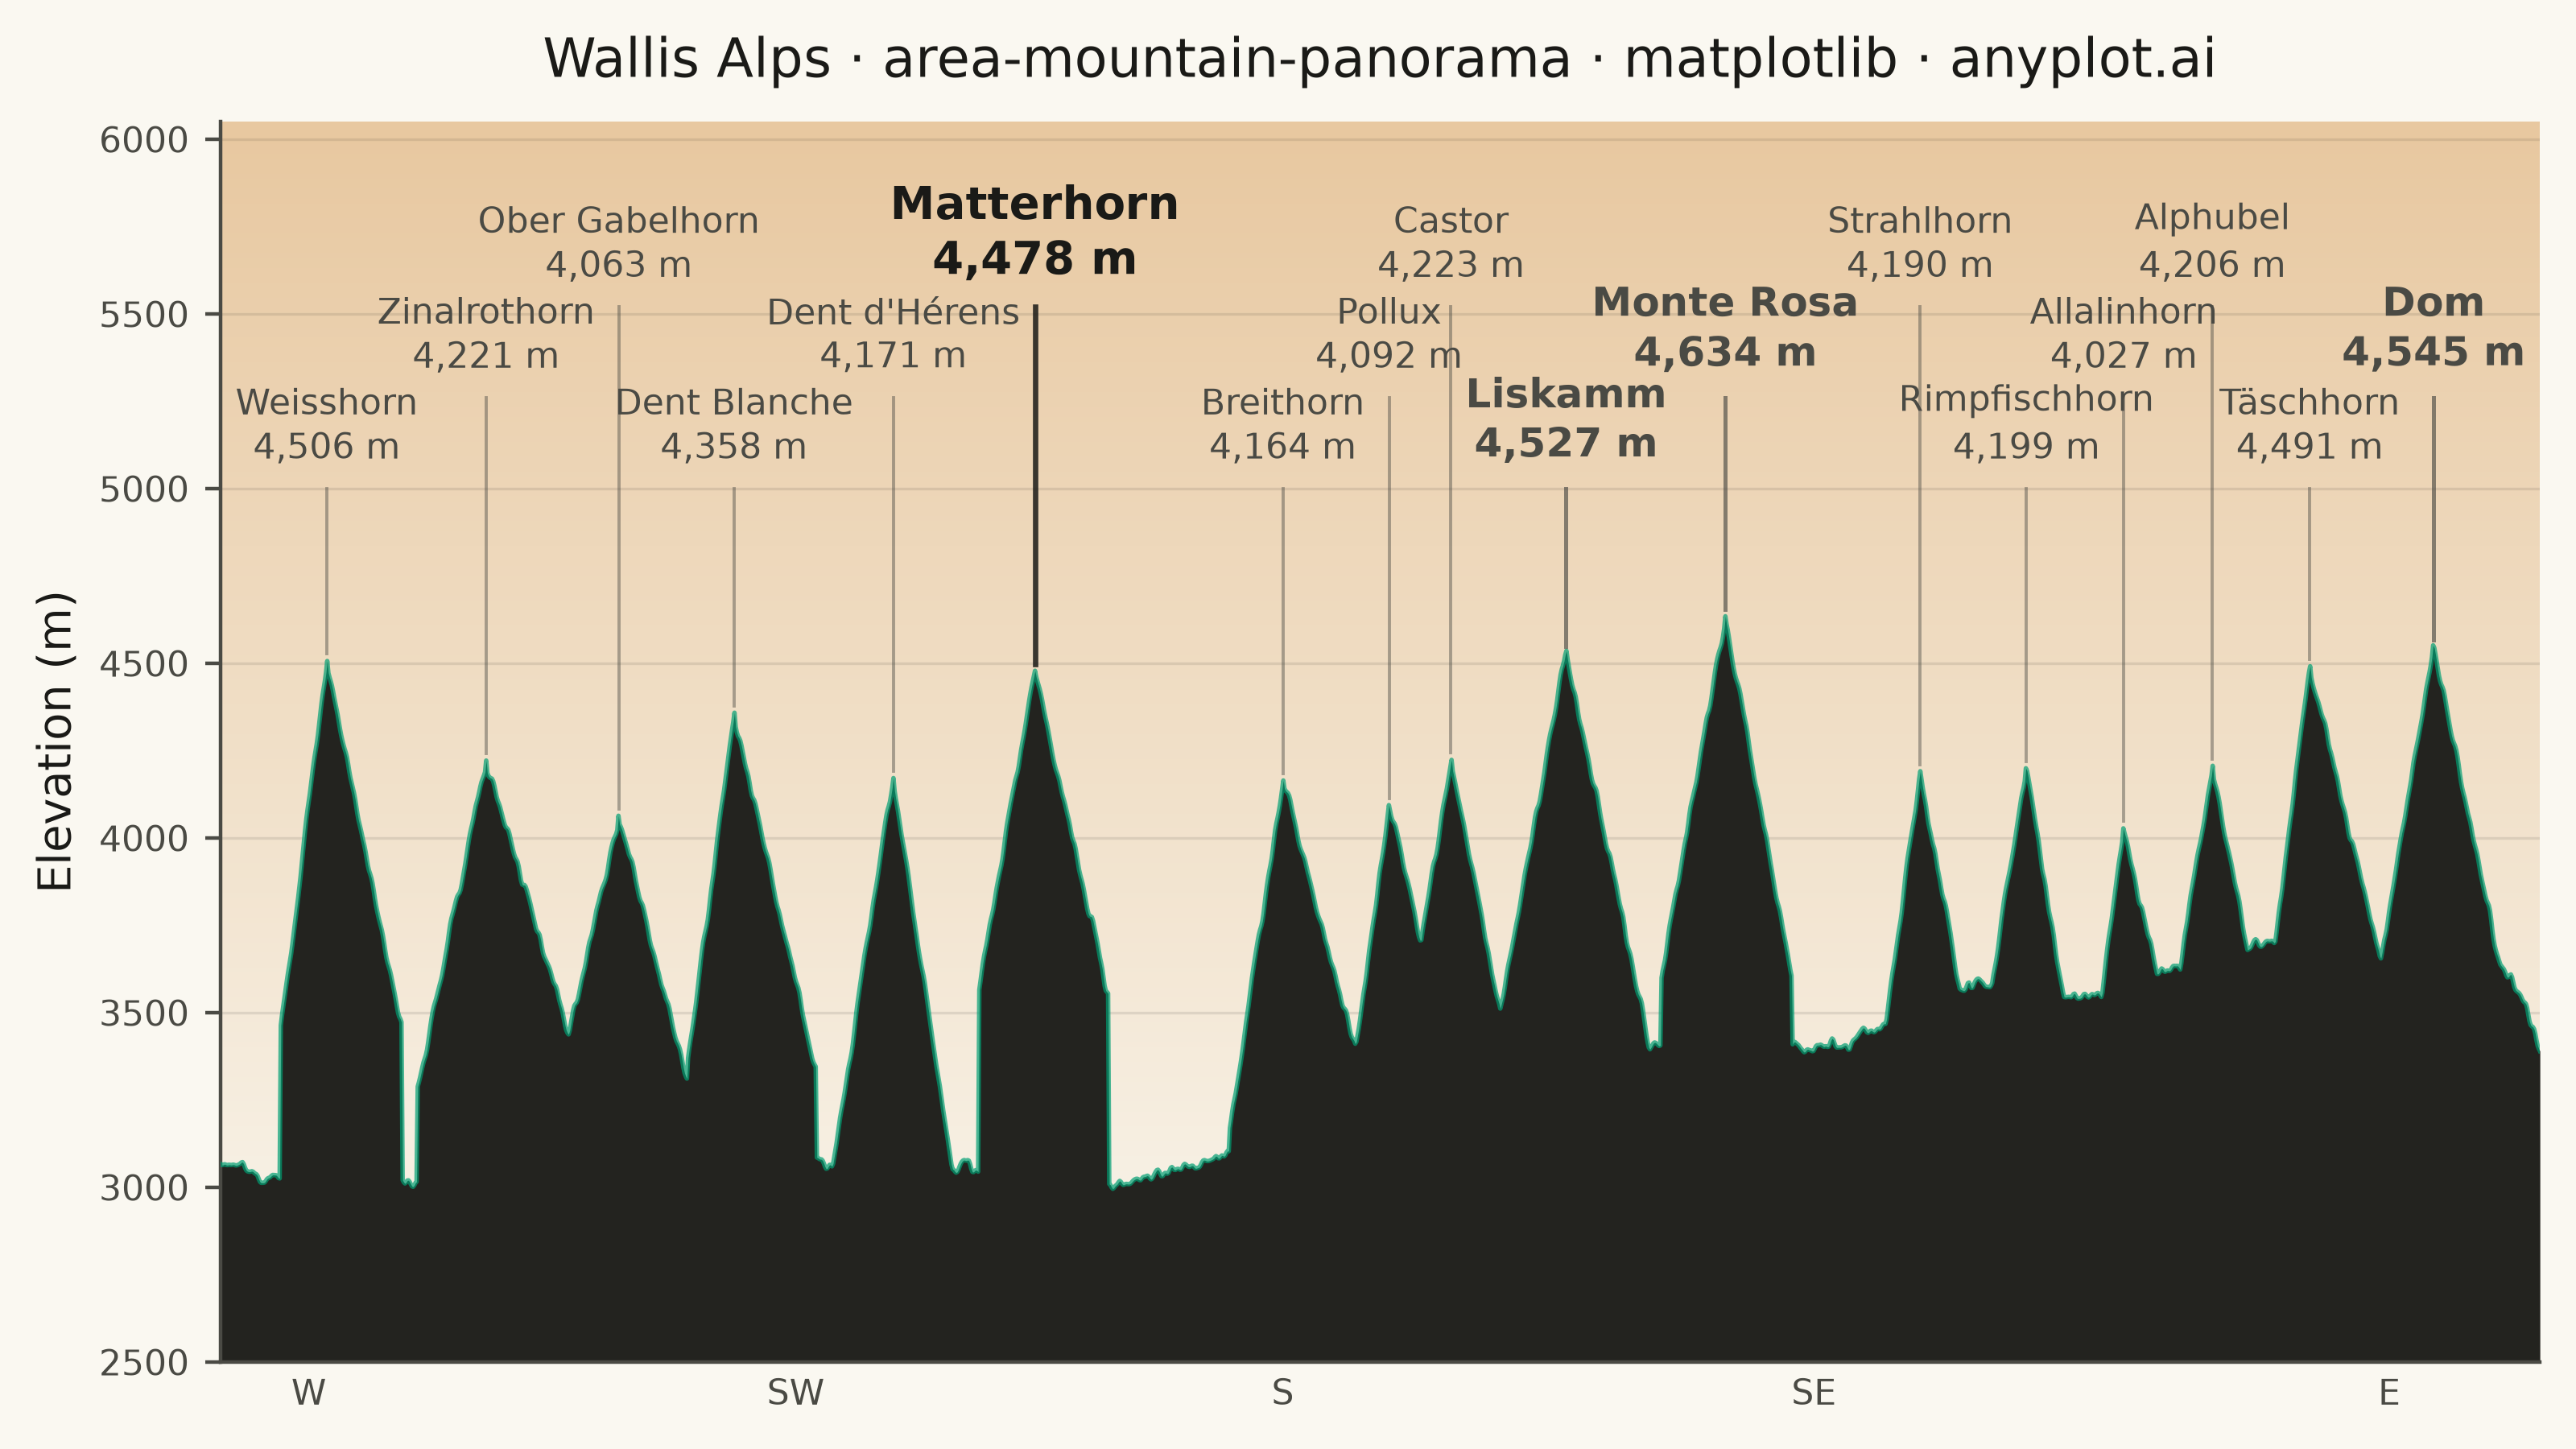
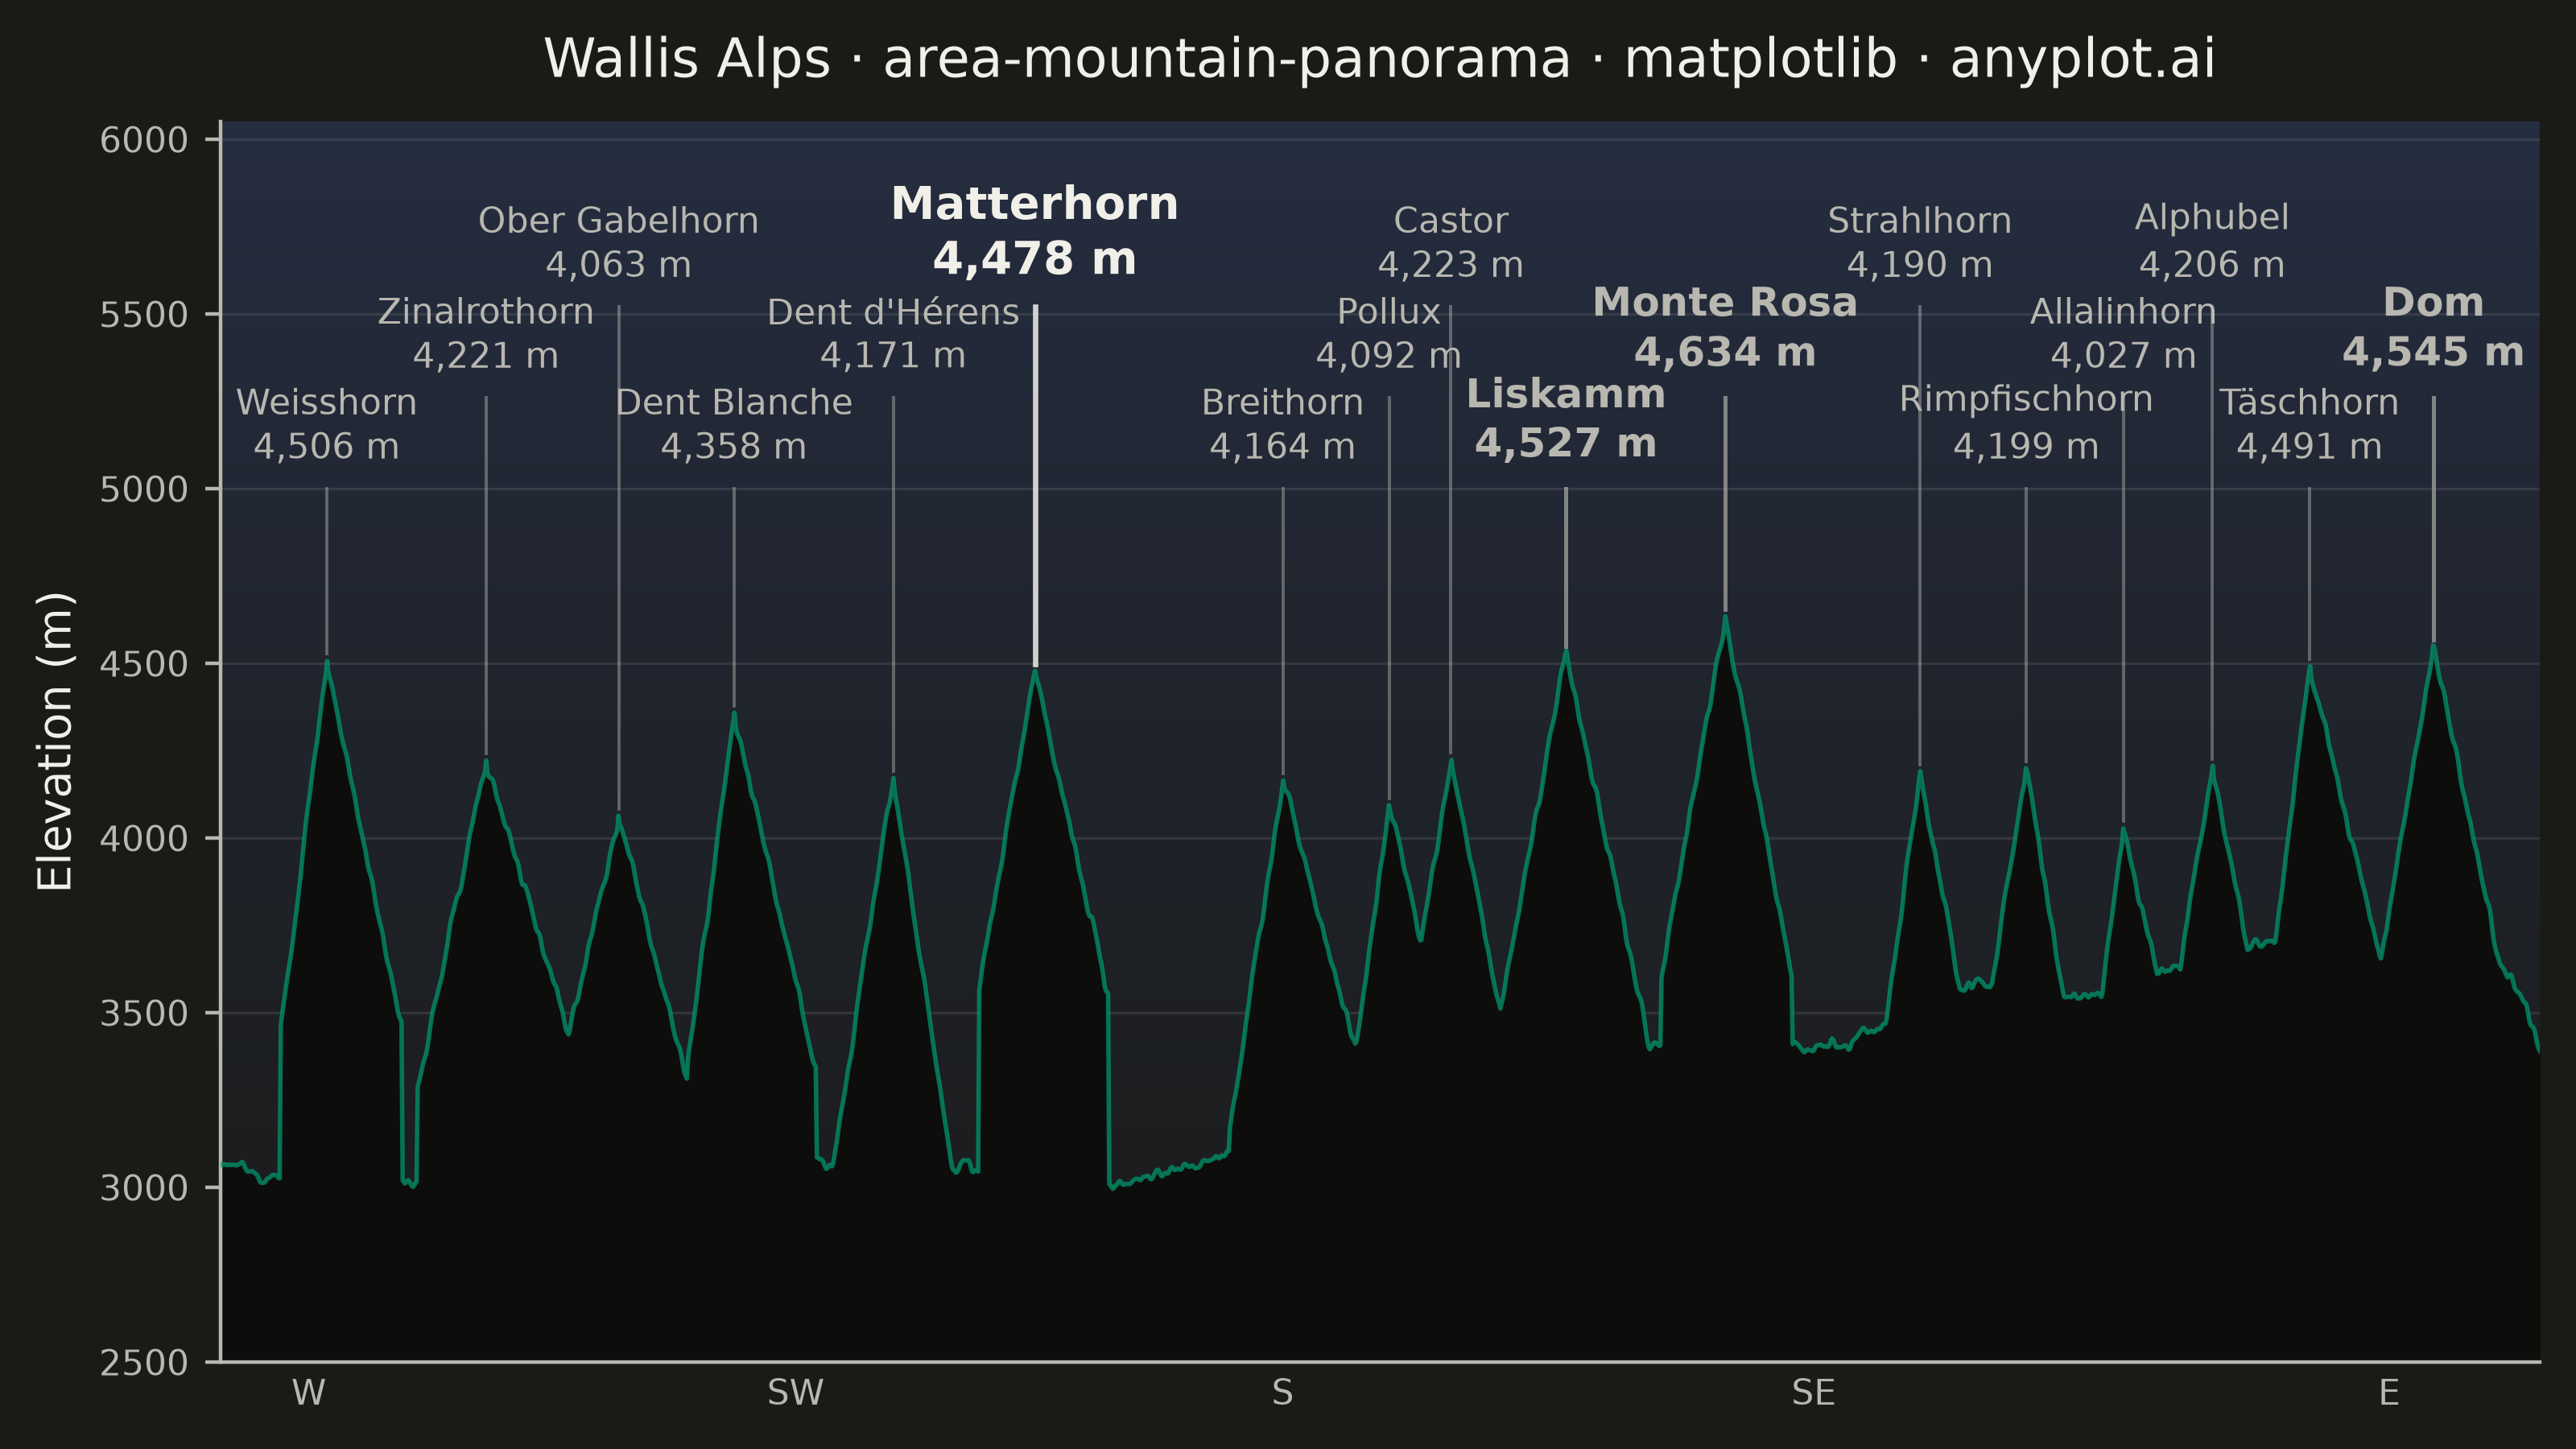
A panoramic mountain silhouette chart that renders the horizon as seen from a fixed vantage point, like a photograph of a ridgeline against the sky. A filled area under the skyline curve traces the ridgeline across a horizontal viewing range (in degrees of bearing or horizontal distance), and major summits are annotated with their name and elevation. The skyline is jagged and angular — sharp triangular peaks with steep, often asymmetric flanks meeting at pointed apexes, connected by rugged ridges with cols, sub-peaks and rocky notches — not a sequence of smooth bell-shaped bumps. Unlike an elevation-profile-along-a-trail, this plot is the angular view of the surrounding peaks from a single observer, making it ideal for summit-identification infographics, alpine panoramas, and travel guides.
""" anyplot.ai
area-mountain-panorama: Mountain Panorama Profile with Labeled Peaks
Library: matplotlib 3.11.0 | Python 3.13.14
Quality: 86/100 | Updated: 2026-06-30
"""

import os

import matplotlib.pyplot as plt
import numpy as np
from matplotlib.colors import LinearSegmentedColormap


# Theme-adaptive chrome tokens (Imprint palette)
THEME = os.getenv("ANYPLOT_THEME", "light")
PAGE_BG = "#FAF8F1" if THEME == "light" else "#1A1A17"
ELEVATED_BG = "#FFFDF6" if THEME == "light" else "#242420"
INK = "#1A1A17" if THEME == "light" else "#F0EFE8"
INK_SOFT = "#4A4A44" if THEME == "light" else "#B8B7B0"
INK_MUTED = "#6B6A63" if THEME == "light" else "#A8A79F"
BRAND = "#009E73"  # Imprint palette position 1
SKY_TOP = "#E8C8A0" if THEME == "light" else "#252D40"
# Dark silhouette fill: very dark near-black for photo-like alpine silhouette
MOUNTAIN_FILL = "#23231F" if THEME == "light" else "#0D0D0B"

# Data — Wallis (Valais) summit panorama, ordered W → E
peaks = [
    ("Weisshorn", 12, 4506),
    ("Zinalrothorn", 30, 4221),
    ("Ober Gabelhorn", 45, 4063),
    ("Dent Blanche", 58, 4358),
    ("Dent d'Hérens", 76, 4171),
    ("Matterhorn", 92, 4478),
    ("Breithorn", 120, 4164),
    ("Pollux", 132, 4092),
    ("Castor", 139, 4223),
    ("Liskamm", 152, 4527),
    ("Monte Rosa", 170, 4634),
    ("Strahlhorn", 192, 4190),
    ("Rimpfischhorn", 204, 4199),
    ("Allalinhorn", 215, 4027),
    ("Alphubel", 225, 4206),
    ("Täschhorn", 236, 4491),
    ("Dom", 250, 4545),
]

# Top 3 summits by elevation for additional visual emphasis
top_elevations = set(sorted([p[2] for p in peaks], reverse=True)[:3])  # 4634, 4545, 4527

# Skyline construction — piecewise-linear triangular tent peaks (NOT Gaussian)
np.random.seed(42)
n_pts = 2000
angle = np.linspace(0, 262, n_pts)

# Base ridge: smoothed random walk in the 3000–3700 m belt (foothills + minor cols)
walk = np.cumsum(np.random.randn(n_pts) * 1.5)
sigma_walk = 22
g = np.arange(-3 * sigma_walk, 3 * sigma_walk + 1)
kernel_walk = np.exp(-(g**2) / (2 * sigma_walk**2))
walk = np.convolve(walk, kernel_walk / kernel_walk.sum(), mode="same")
walk = (walk - walk.min()) / (walk.max() - walk.min())
ridge = 3000 + walk * 700

# Asymmetric triangular tent functions — steep linear flanks, sharp pointed apexes
for _, pos, elev in peaks:
    col_base = max(elev - np.random.uniform(900, 1300), 2900)
    left_w = np.random.uniform(5.0, 8.5)  # asymmetric half-widths in degrees
    right_w = np.random.uniform(7.0, 11.5)

    tent = np.zeros(n_pts)
    mask_l = (angle >= pos - left_w) & (angle < pos)
    if mask_l.any():
        t_l = (angle[mask_l] - (pos - left_w)) / left_w
        tent[mask_l] = col_base + t_l * (elev - col_base)
    mask_r = (angle > pos) & (angle <= pos + right_w)
    if mask_r.any():
        t_r = 1.0 - (angle[mask_r] - pos) / right_w
        tent[mask_r] = col_base + t_r * (elev - col_base)
    apex_idx = int(np.argmin(np.abs(angle - pos)))
    tent[apex_idx] = elev

    ridge = np.maximum(ridge, tent)

# Rocky jaggedness: lightly smoothed high-frequency noise for rugged alpine texture
rock_noise = np.random.randn(n_pts) * 22
sigma_r = 1.5
g2 = np.arange(-5, 6)
k2 = np.exp(-(g2**2) / (2 * sigma_r**2))
rock_noise = np.convolve(rock_noise, k2 / k2.sum(), mode="same")
ridge = ridge + rock_noise

# Re-pin apex elevations after noise (labeled summits show their true height)
for _, pos, elev in peaks:
    apex_idx = int(np.argmin(np.abs(angle - pos)))
    ridge[apex_idx] = max(ridge[apex_idx], elev)

# Canvas — landscape 3200×1800 px (figsize=(8, 4.5) × dpi=400)
fig, ax = plt.subplots(figsize=(8, 4.5), dpi=400, facecolor=PAGE_BG)
ax.set_facecolor(PAGE_BG)

# Sky gradient above ridgeline (dusk mood: warm peach for light, deep navy for dark)
sky_cmap = LinearSegmentedColormap.from_list("sky", [PAGE_BG, SKY_TOP])
sky_gradient = np.linspace(0, 1, 256).reshape(-1, 1)
ax.imshow(
    sky_gradient,
    extent=(0, 262, 2400, 6050),
    aspect="auto",
    cmap=sky_cmap,
    origin="lower",
    zorder=1,
    interpolation="bilinear",
)

# Mountain silhouette — dark solid fill (photo-like silhouette, evening/dusk feel)
ax.fill_between(angle, 2400, ridge, color=MOUNTAIN_FILL, linewidth=0, zorder=2)
# Brand-green ridge highlight line for identity against the dark mountain body
ax.plot(angle, ridge, color=BRAND, linewidth=1.0, alpha=0.7, zorder=3)

# Peak labels staggered across three vertical levels with thin leader lines
label_levels = [5050, 5310, 5570]
sorted_peaks = sorted(peaks, key=lambda p: p[1])
for i, (name, pos, elev) in enumerate(sorted_peaks):
    level = label_levels[i % 3]
    is_anchor = name == "Matterhorn"
    is_top = elev in top_elevations

    if is_anchor:
        text_color = INK
        text_weight = "bold"
        line_color = INK
        line_alpha = 0.85
        line_width = 1.2
        fsize = 10
    elif is_top:
        text_color = INK_SOFT
        text_weight = "semibold"
        line_color = INK_SOFT
        line_alpha = 0.65
        line_width = 0.9
        fsize = 9
    else:
        text_color = INK_SOFT
        text_weight = "regular"
        line_color = INK_SOFT
        line_alpha = 0.45
        line_width = 0.7
        fsize = 8

    ax.plot([pos, pos], [elev + 20, level - 50], color=line_color, linewidth=line_width, alpha=line_alpha, zorder=4)
    ax.text(
        pos,
        level,
        f"{name}\n{elev:,} m",
        ha="center",
        va="bottom",
        fontsize=fsize,
        fontweight=text_weight,
        color=text_color,
        linespacing=1.3,
        zorder=5,
    )

# Axes
ax.set_ylim(2500, 6050)
ax.set_xlim(0, 262)
ax.set_ylabel("Elevation (m)", fontsize=10, color=INK)

title = "Wallis Alps · area-mountain-panorama · matplotlib · anyplot.ai"
title_fontsize = max(8, round(12 * 67 / len(title))) if len(title) > 67 else 12
ax.set_title(title, fontsize=title_fontsize, fontweight="medium", color=INK, pad=10)

# Compass bearings on x-axis
compass_ticks = [10, 65, 120, 180, 245]
compass_labels = ["W", "SW", "S", "SE", "E"]
ax.set_xticks(compass_ticks)
ax.set_xticklabels(compass_labels, fontsize=8, color=INK_SOFT)
ax.tick_params(axis="x", colors=INK_SOFT, length=0)
ax.tick_params(axis="y", labelsize=8, colors=INK_SOFT, labelcolor=INK_SOFT)

ax.spines["top"].set_visible(False)
ax.spines["right"].set_visible(False)
for s in ("left", "bottom"):
    ax.spines[s].set_color(INK_SOFT)
ax.yaxis.grid(True, alpha=0.10, linewidth=0.6, color=INK)

plt.tight_layout(pad=0.8)
plt.savefig(f"plot-{THEME}.png", dpi=400, facecolor=PAGE_BG)
Runnable source as JSON, for any HTTP client: https://api.anyplot.ai/specs/area-mountain-panorama/matplotlib/code. Any spec id and library id listed in llms-full.txt fit the same URL shape; every URL below is complete and callable.
{
  "spec_id": "area-mountain-panorama",
  "language": "python",
  "library": "matplotlib",
  "page": "https://anyplot.ai/area-mountain-panorama/python/matplotlib",
  "hub": "https://anyplot.ai/area-mountain-panorama",
  "code_json": "https://api.anyplot.ai/specs/area-mountain-panorama/matplotlib/code",
  "spec_json": "https://api.anyplot.ai/specs/area-mountain-panorama",
  "render_light_png": "https://storage.googleapis.com/anyplot-images/plots/area-mountain-panorama/python/matplotlib/plot-light.png",
  "render_dark_png": "https://storage.googleapis.com/anyplot-images/plots/area-mountain-panorama/python/matplotlib/plot-dark.png",
  "quality_score": 86.0,
  "license": "MIT",
  "guide": "https://anyplot.ai/llms.txt"
}
Part of Mountain Panorama Profile with Labeled Peaks on anyplot.ai.