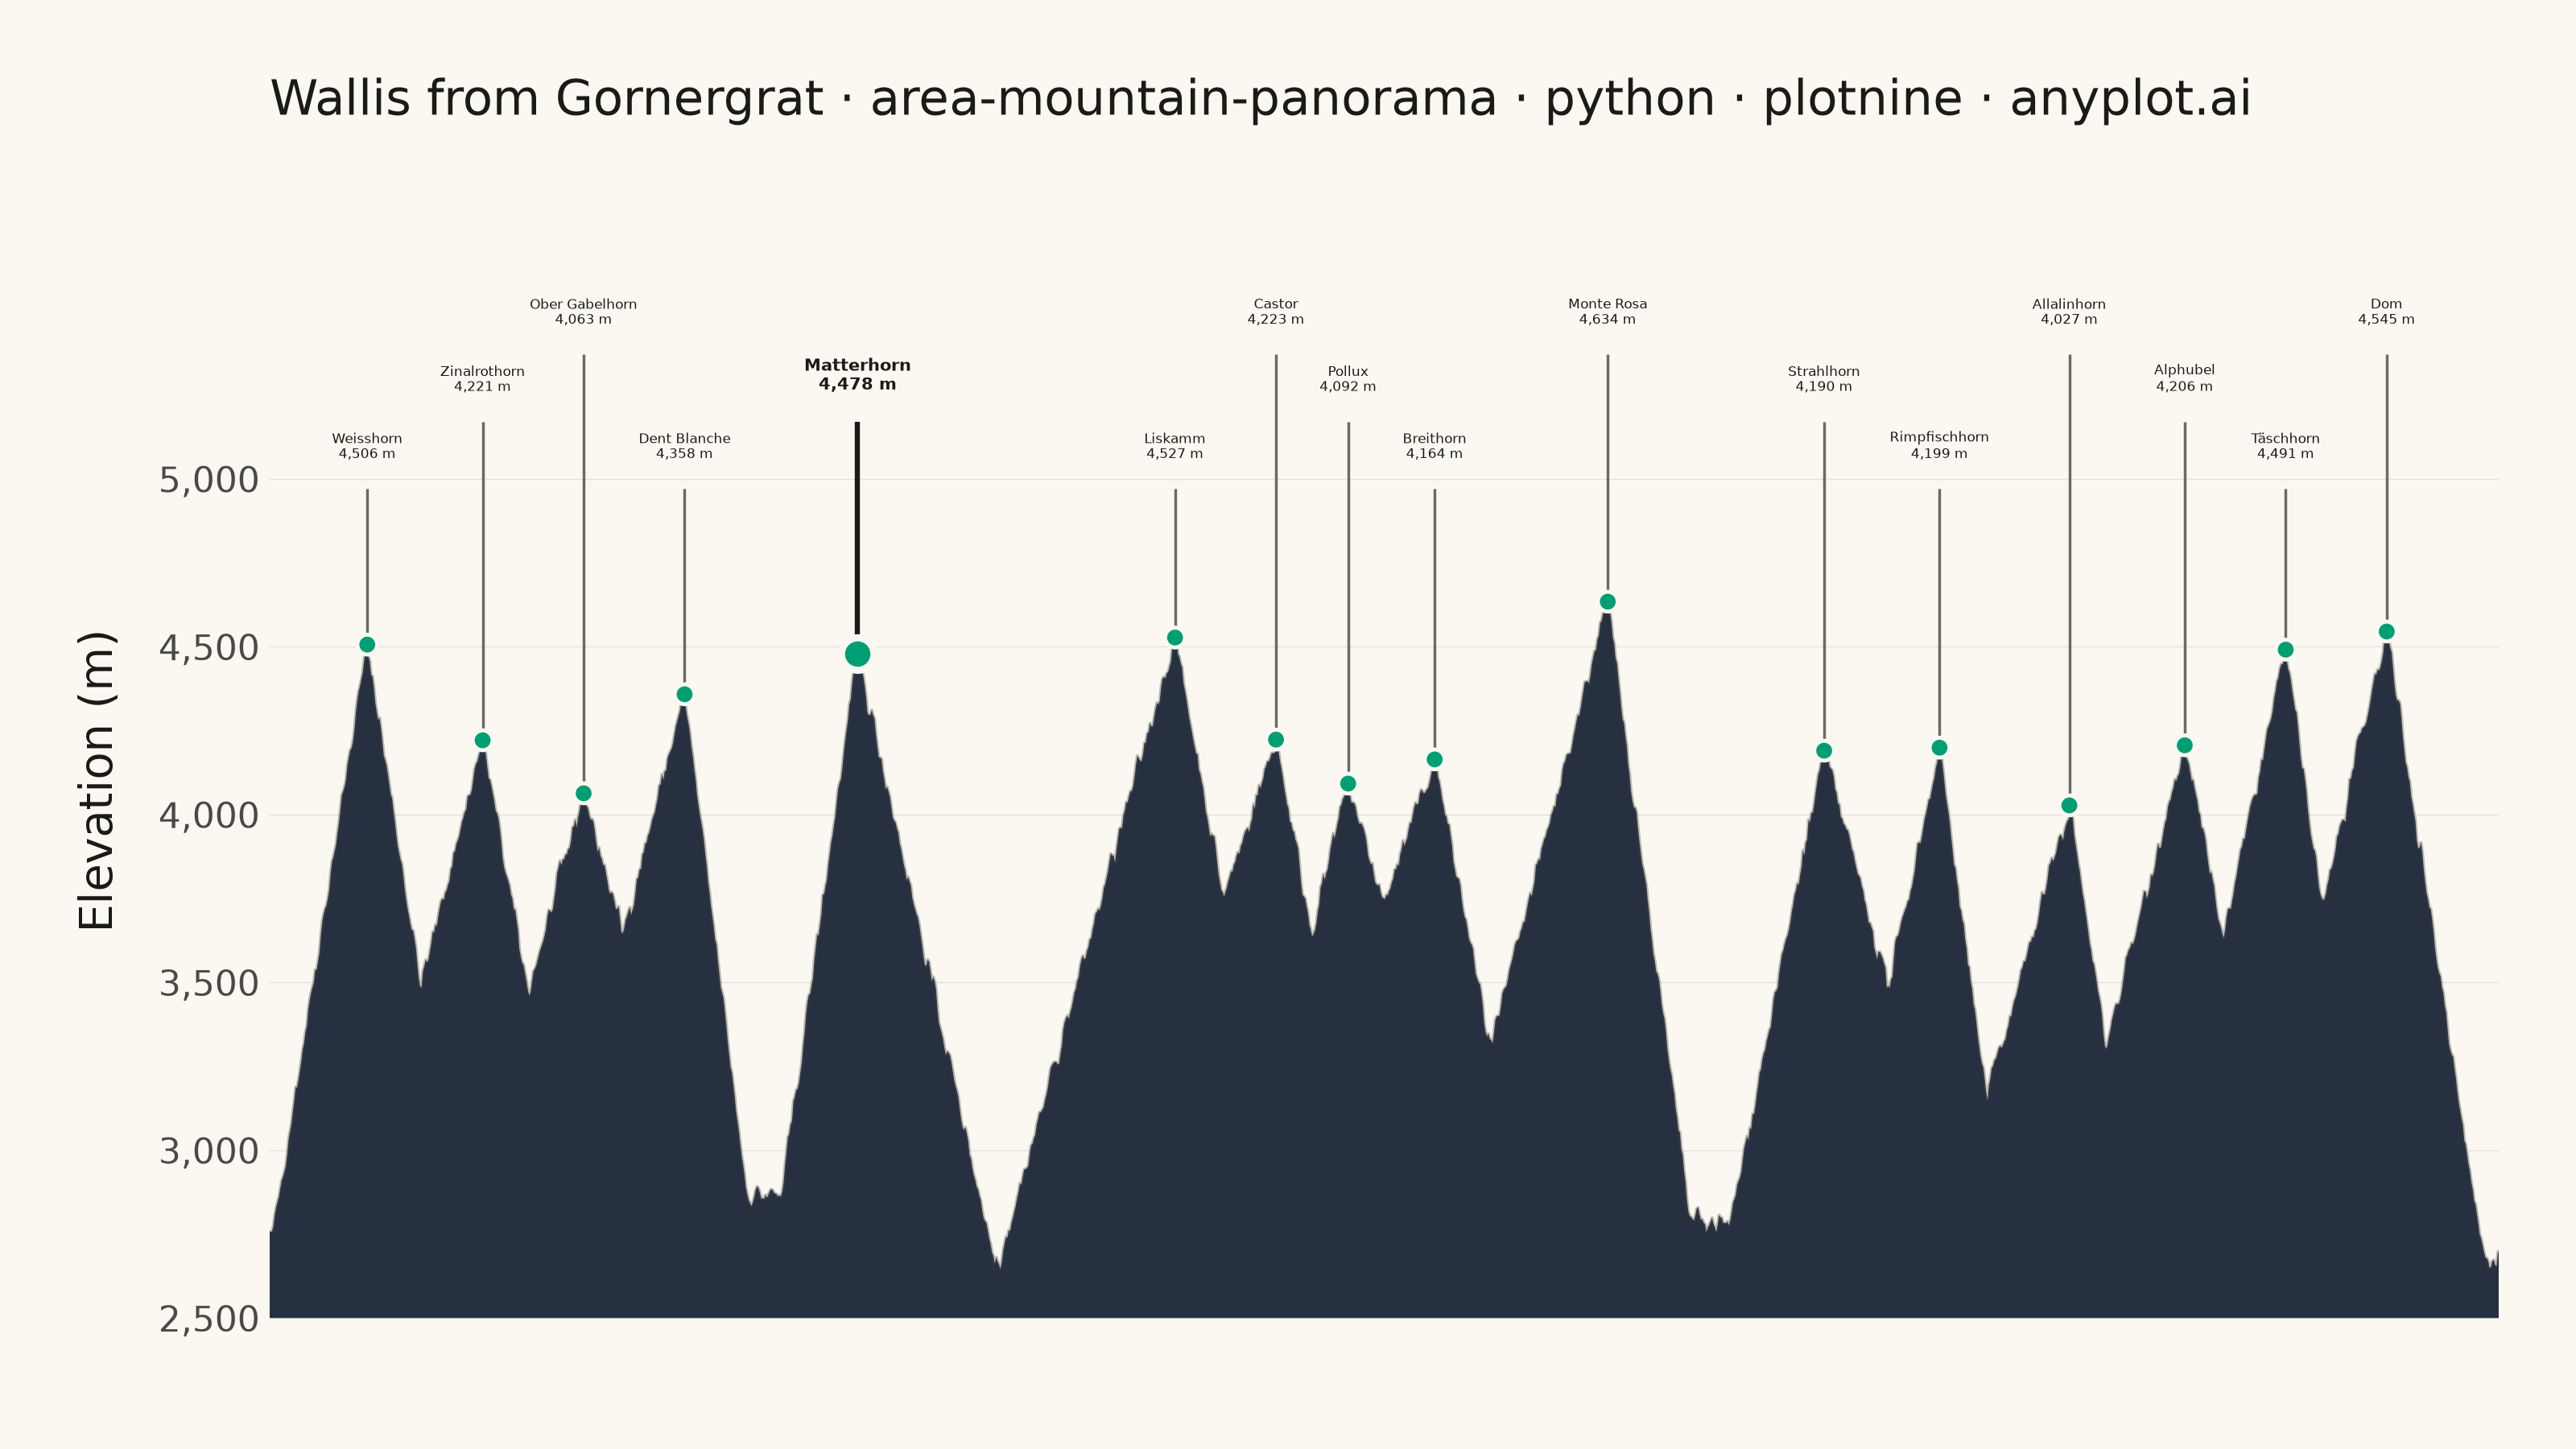
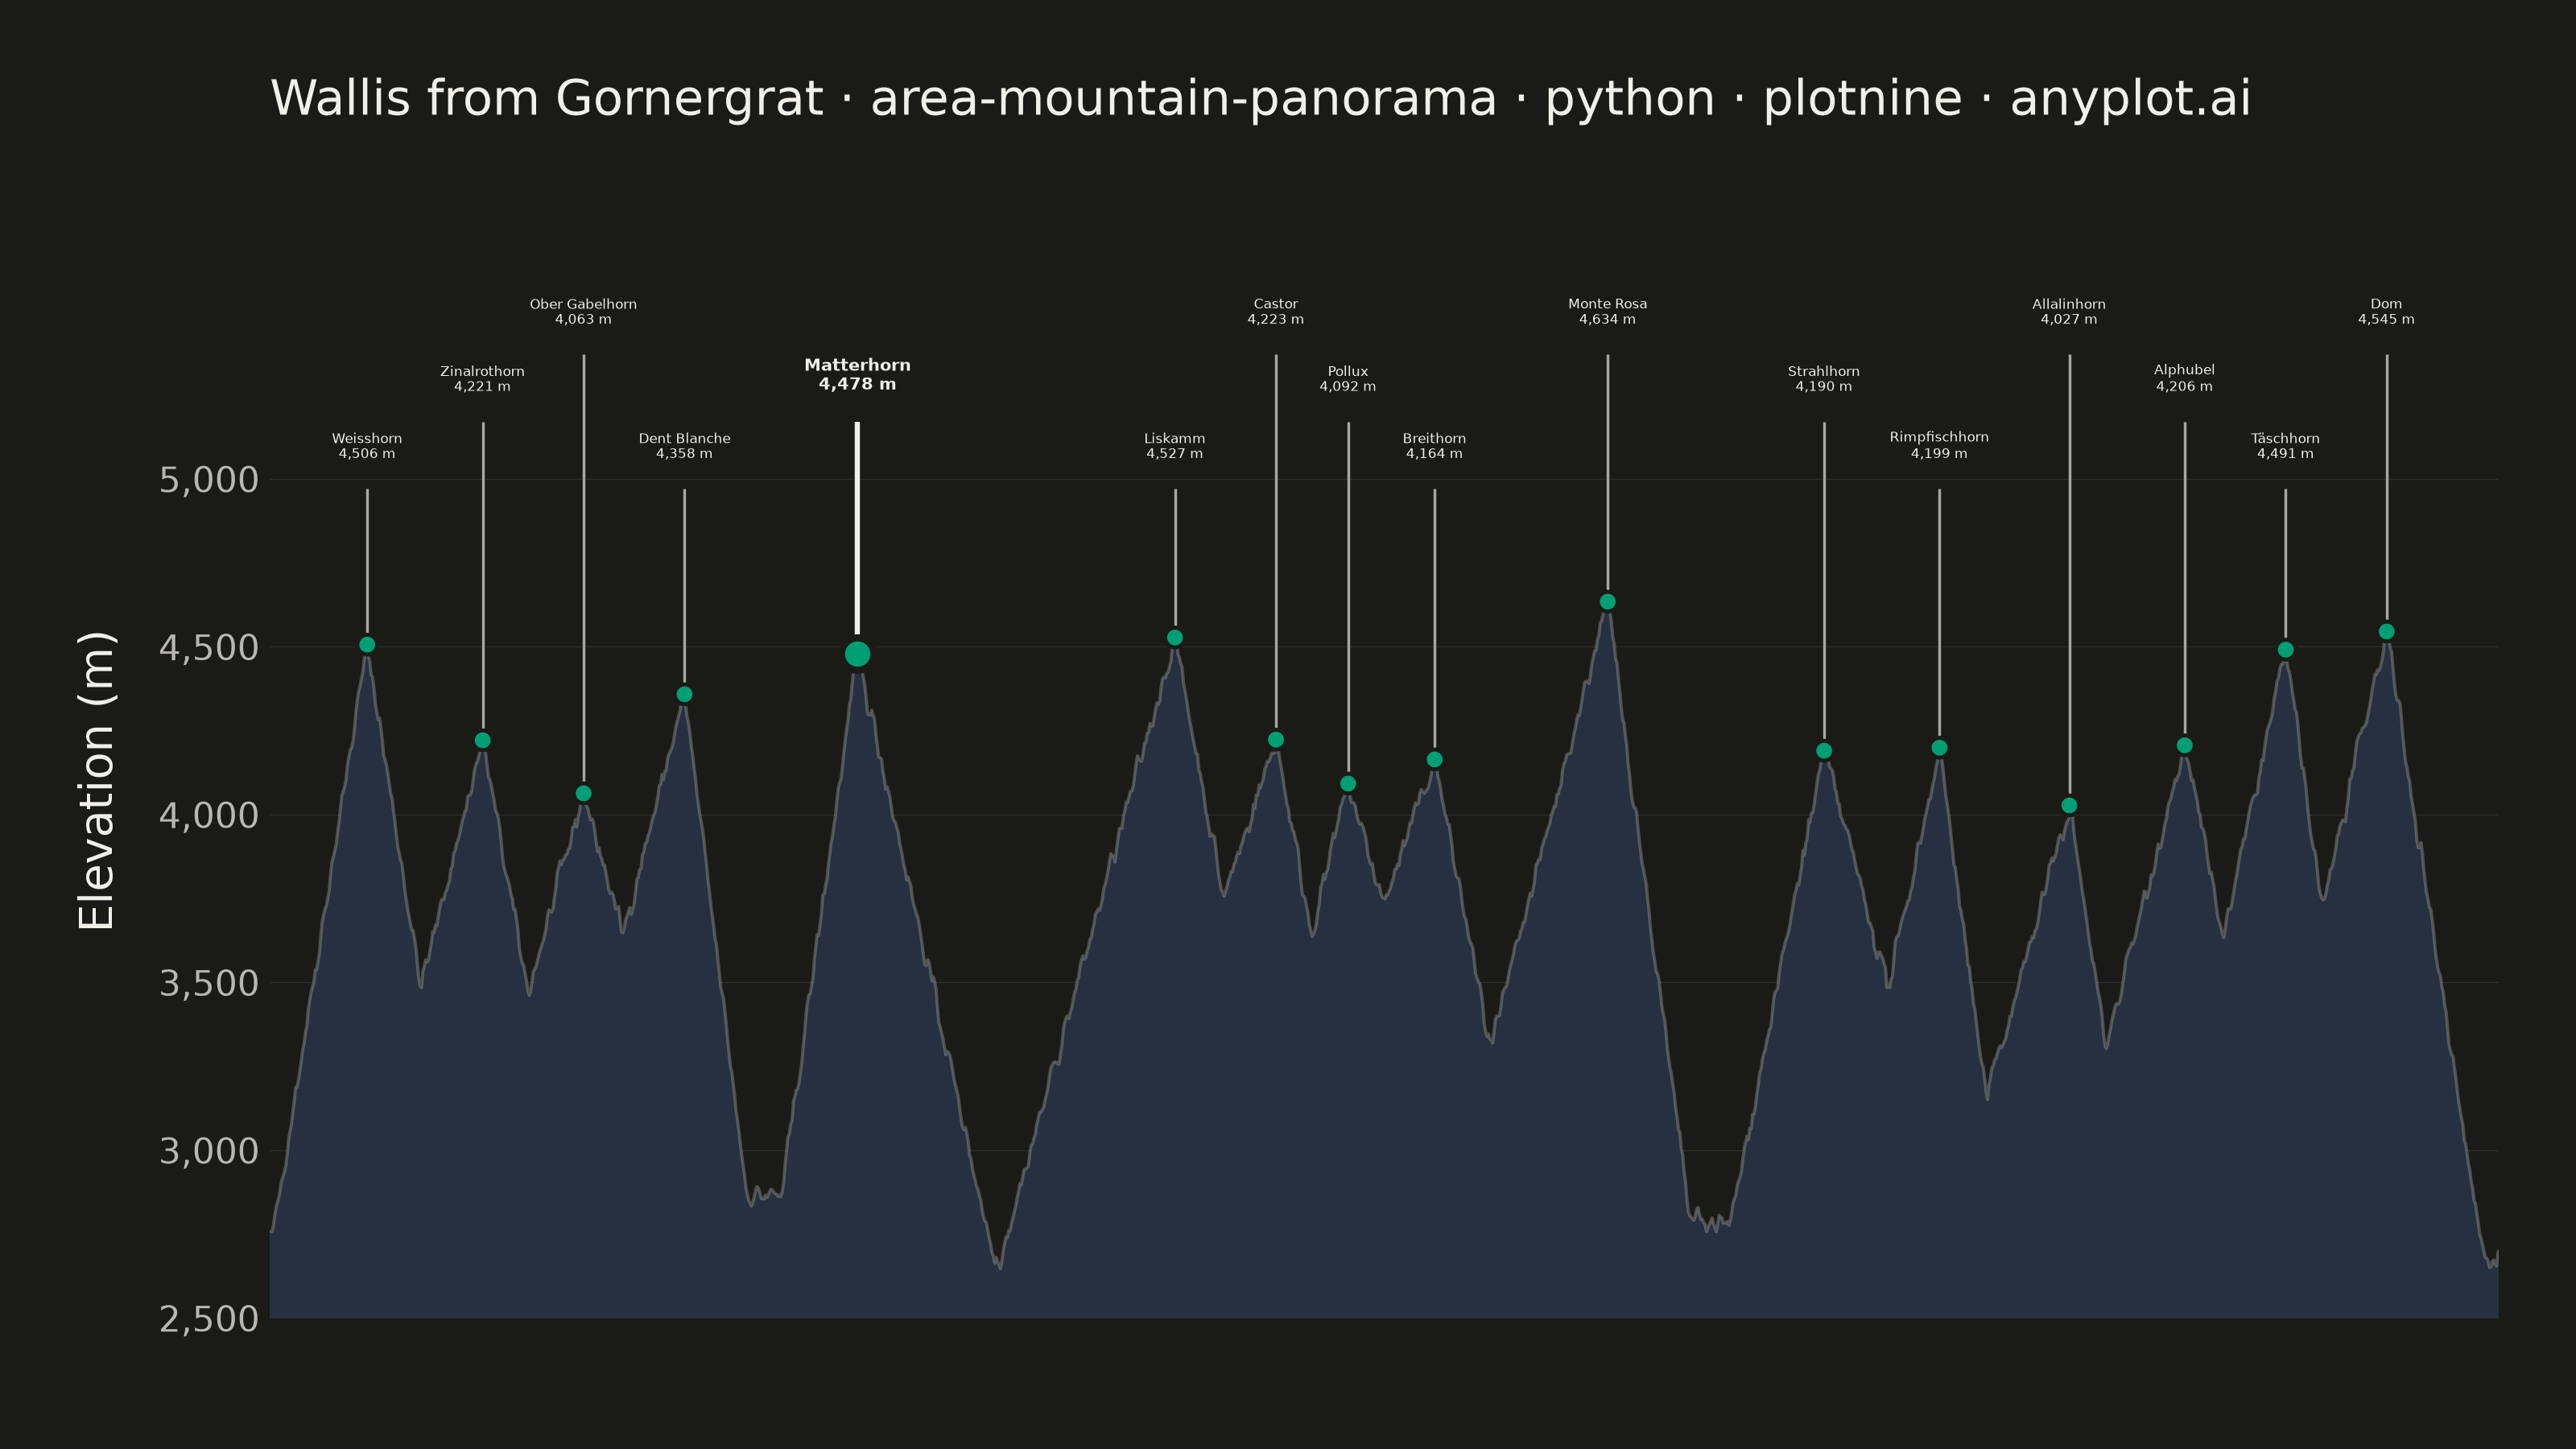
A panoramic mountain silhouette chart that renders the horizon as seen from a fixed vantage point, like a photograph of a ridgeline against the sky. A filled area under the skyline curve traces the ridgeline across a horizontal viewing range (in degrees of bearing or horizontal distance), and major summits are annotated with their name and elevation. The skyline is jagged and angular — sharp triangular peaks with steep, often asymmetric flanks meeting at pointed apexes, connected by rugged ridges with cols, sub-peaks and rocky notches — not a sequence of smooth bell-shaped bumps. Unlike an elevation-profile-along-a-trail, this plot is the angular view of the surrounding peaks from a single observer, making it ideal for summit-identification infographics, alpine panoramas, and travel guides.
""" anyplot.ai
area-mountain-panorama: Mountain Panorama Profile with Labeled Peaks
Library: plotnine 0.15.7 | Python 3.13.14
Quality: 87/100 | Updated: 2026-06-30
"""

import os

import numpy as np
import pandas as pd
from plotnine import (
    aes,
    coord_cartesian,
    element_blank,
    element_line,
    element_rect,
    element_text,
    geom_line,
    geom_point,
    geom_ribbon,
    geom_segment,
    geom_text,
    ggplot,
    labs,
    scale_x_continuous,
    scale_y_continuous,
    theme,
    theme_minimal,
)


# Imprint palette / theme-adaptive chrome tokens
THEME = os.getenv("ANYPLOT_THEME", "light")
PAGE_BG = "#FAF8F1" if THEME == "light" else "#1A1A17"
INK = "#1A1A17" if THEME == "light" else "#F0EFE8"
INK_SOFT = "#4A4A44" if THEME == "light" else "#B8B7B0"
INK_MUTED = "#6B6A63" if THEME == "light" else "#A8A79F"
BRAND = "#009E73"  # Imprint palette position 1 — peak markers (data elements)
MOUNTAIN = "#263040"  # Dark slate — spec requires dark solid fill for dusk/photo-like feel

# Wallis (Valais) panorama from Gornergrat vantage
peaks = (
    pd.DataFrame(
        {
            "name": [
                "Weisshorn",
                "Zinalrothorn",
                "Ober Gabelhorn",
                "Dent Blanche",
                "Matterhorn",
                "Liskamm",
                "Castor",
                "Pollux",
                "Breithorn",
                "Monte Rosa",
                "Strahlhorn",
                "Rimpfischhorn",
                "Allalinhorn",
                "Alphubel",
                "Täschhorn",
                "Dom",
            ],
            "angle_deg": [4, 12, 19, 26, 38, 60, 67, 72, 78, 90, 105, 113, 122, 130, 137, 144],
            "elevation_m": [
                4506,
                4221,
                4063,
                4358,
                4478,
                4527,
                4223,
                4092,
                4164,
                4634,
                4190,
                4199,
                4027,
                4206,
                4491,
                4545,
            ],
        }
    )
    .sort_values("angle_deg")
    .reset_index(drop=True)
)

FLOOR = 2500

# Piecewise-linear tent/triangle functions — spec forbids Gaussian bumps;
# each peak contributes a sharp triangular profile with asymmetric linear flanks
np.random.seed(42)
n_samples = 1600
angles = np.linspace(-3, 152, n_samples)

# Undulating base ridge (valley floors and connecting ridges between peaks)
base_ridge = 2750 + 80 * np.sin(angles / 14) + 55 * np.sin(angles / 4.5 + 0.7)
elevation = base_ridge.copy()

for _, p in peaks.iterrows():
    # Per-peak seed for reproducible asymmetric flank widths independent of iteration order
    rng = np.random.RandomState(int(p["angle_deg"] * 17 + 3))
    left_w = rng.uniform(6, 14)  # degrees from apex to left base
    right_w = rng.uniform(5, 11)  # degrees from apex to right base (asymmetric)
    peak_h = p["elevation_m"] - FLOOR

    dist = angles - p["angle_deg"]
    tent = np.where(
        dist < 0,
        np.maximum(0.0, 1.0 + dist / left_w),  # linear rise on left flank
        np.maximum(0.0, 1.0 - dist / right_w),  # linear fall on right flank
    )
    elevation = np.maximum(elevation, FLOOR + peak_h * tent)

# Window=3 only: preserves rocky jaggedness while removing single-point spikes
ridge_noise = np.random.normal(0, 28, n_samples)
elevation = elevation + ridge_noise
elevation = pd.Series(elevation).rolling(window=3, center=True, min_periods=1).mean().values
elevation = np.maximum(elevation, FLOOR)

skyline = pd.DataFrame({"angle_deg": angles, "elevation_m": elevation, "y_floor": FLOOR})

# 3-row stagger — 3 vertical tiers break up the dense 0–78° cluster
row_map = {
    "Weisshorn": 0,
    "Zinalrothorn": 1,
    "Ober Gabelhorn": 2,
    "Dent Blanche": 0,
    "Matterhorn": 1,
    "Liskamm": 0,
    "Castor": 2,
    "Pollux": 1,
    "Breithorn": 0,
    "Monte Rosa": 2,
    "Strahlhorn": 1,
    "Rimpfischhorn": 0,
    "Allalinhorn": 2,
    "Alphubel": 1,
    "Täschhorn": 0,
    "Dom": 2,
}
row_y = {0: 5050, 1: 5250, 2: 5450}
peaks["row"] = peaks["name"].map(row_map)
peaks["label_y"] = peaks["row"].map(row_y)
peaks["leader_top"] = peaks["label_y"] - 80
peaks["label"] = peaks.apply(lambda r: f"{r['name']}\n{int(r['elevation_m']):,} m", axis=1)
peaks["is_anchor"] = peaks["name"] == "Matterhorn"

others = peaks[~peaks["is_anchor"]]
anchor = peaks[peaks["is_anchor"]]

plot = (
    ggplot()
    # Dark silhouette fill — photo-like, evening/dusk alpine feel
    + geom_ribbon(aes(x="angle_deg", ymin="y_floor", ymax="elevation_m"), data=skyline, fill=MOUNTAIN, alpha=1.0)
    # Ridgeline outline for crispness at the sky-mountain boundary
    + geom_line(aes(x="angle_deg", y="elevation_m"), data=skyline, color=INK_SOFT, size=0.4, alpha=0.35)
    # Leader lines from summit up to label tier
    + geom_segment(
        aes(x="angle_deg", xend="angle_deg", y="elevation_m", yend="leader_top"),
        data=others,
        color=INK_MUTED,
        size=0.35,
    )
    + geom_segment(
        aes(x="angle_deg", xend="angle_deg", y="elevation_m", yend="leader_top"), data=anchor, color=INK, size=0.65
    )
    # Summit markers — brand green data elements marking each labeled peak
    + geom_point(
        aes(x="angle_deg", y="elevation_m"), data=others, size=2.0, color=PAGE_BG, fill=BRAND, stroke=0.5, shape="o"
    )
    + geom_point(
        aes(x="angle_deg", y="elevation_m"), data=anchor, size=3.2, color=PAGE_BG, fill=BRAND, stroke=0.9, shape="o"
    )
    # Peak labels — Matterhorn bold as focal summit
    + geom_text(
        aes(x="angle_deg", y="label_y", label="label"), data=others, size=3.0, color=INK, ha="center", va="bottom"
    )
    + geom_text(
        aes(x="angle_deg", y="label_y", label="label"),
        data=anchor,
        size=3.8,
        color=INK,
        ha="center",
        va="bottom",
        fontweight="bold",
    )
    + scale_x_continuous(expand=(0.005, 0))
    + scale_y_continuous(
        breaks=[2500, 3000, 3500, 4000, 4500, 5000], labels=["2,500", "3,000", "3,500", "4,000", "4,500", "5,000"]
    )
    + coord_cartesian(xlim=(-2, 151), ylim=(2500, 5700))
    + labs(
        x="",
        y="Elevation (m)",
        title="Wallis from Gornergrat · area-mountain-panorama · python · plotnine · anyplot.ai",
    )
    + theme_minimal()
    + theme(
        figure_size=(8, 4.5),
        text=element_text(size=7, color=INK_SOFT),
        plot_title=element_text(size=11, color=INK, ha="left", margin={"b": 8}),
        axis_title_y=element_text(size=10, color=INK, margin={"r": 8}),
        axis_text_y=element_text(size=8, color=INK_SOFT),
        axis_text_x=element_blank(),
        axis_ticks=element_blank(),
        axis_line=element_blank(),
        panel_grid_major_x=element_blank(),
        panel_grid_major_y=element_line(color=INK_SOFT, size=0.25, alpha=0.12),
        panel_grid_minor=element_blank(),
        panel_border=element_blank(),
        plot_background=element_rect(fill=PAGE_BG, color=PAGE_BG),
        panel_background=element_rect(fill=PAGE_BG, color=PAGE_BG),
        plot_margin=0.03,
    )
)

plot.save(f"plot-{THEME}.png", dpi=400, width=8, height=4.5, units="in", verbose=False)
Runnable source as JSON, for any HTTP client: https://api.anyplot.ai/specs/area-mountain-panorama/plotnine/code. Any spec id and library id listed in llms-full.txt fit the same URL shape; every URL below is complete and callable.
{
  "spec_id": "area-mountain-panorama",
  "language": "python",
  "library": "plotnine",
  "page": "https://anyplot.ai/area-mountain-panorama/python/plotnine",
  "hub": "https://anyplot.ai/area-mountain-panorama",
  "code_json": "https://api.anyplot.ai/specs/area-mountain-panorama/plotnine/code",
  "spec_json": "https://api.anyplot.ai/specs/area-mountain-panorama",
  "render_light_png": "https://storage.googleapis.com/anyplot-images/plots/area-mountain-panorama/python/plotnine/plot-light.png",
  "render_dark_png": "https://storage.googleapis.com/anyplot-images/plots/area-mountain-panorama/python/plotnine/plot-dark.png",
  "quality_score": 87.0,
  "license": "MIT",
  "guide": "https://anyplot.ai/llms.txt"
}
Part of Mountain Panorama Profile with Labeled Peaks on anyplot.ai.