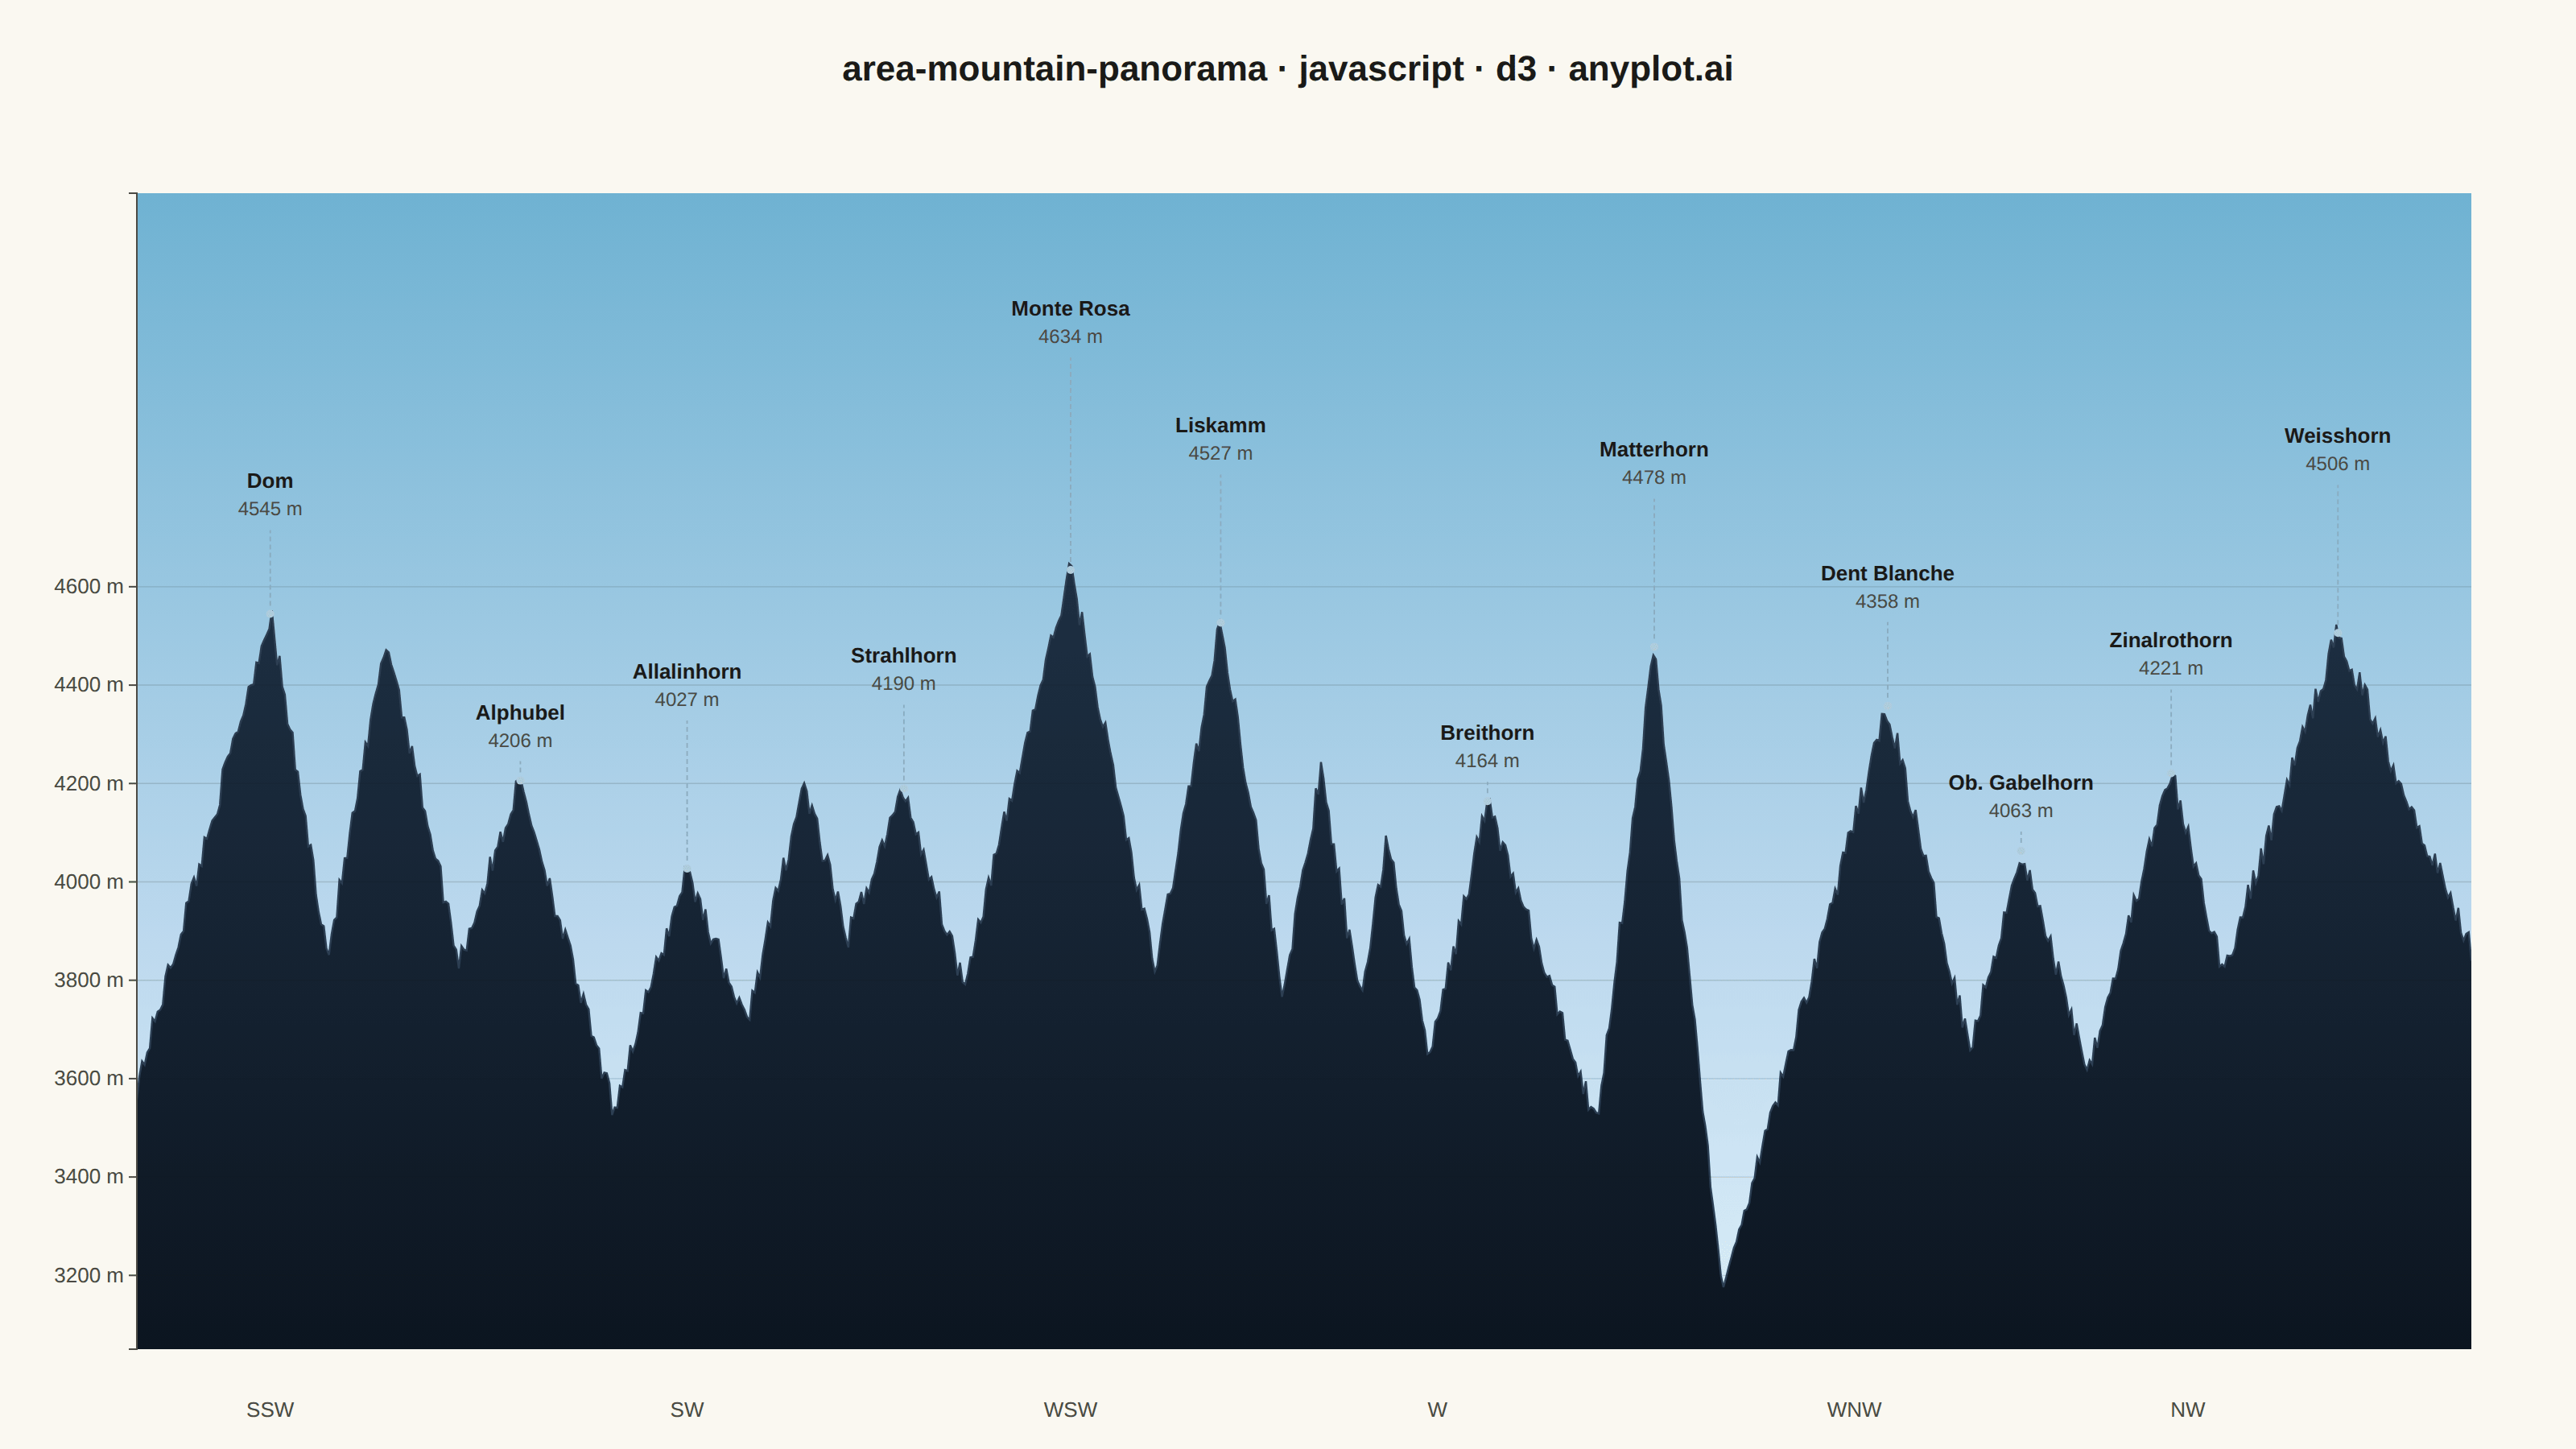
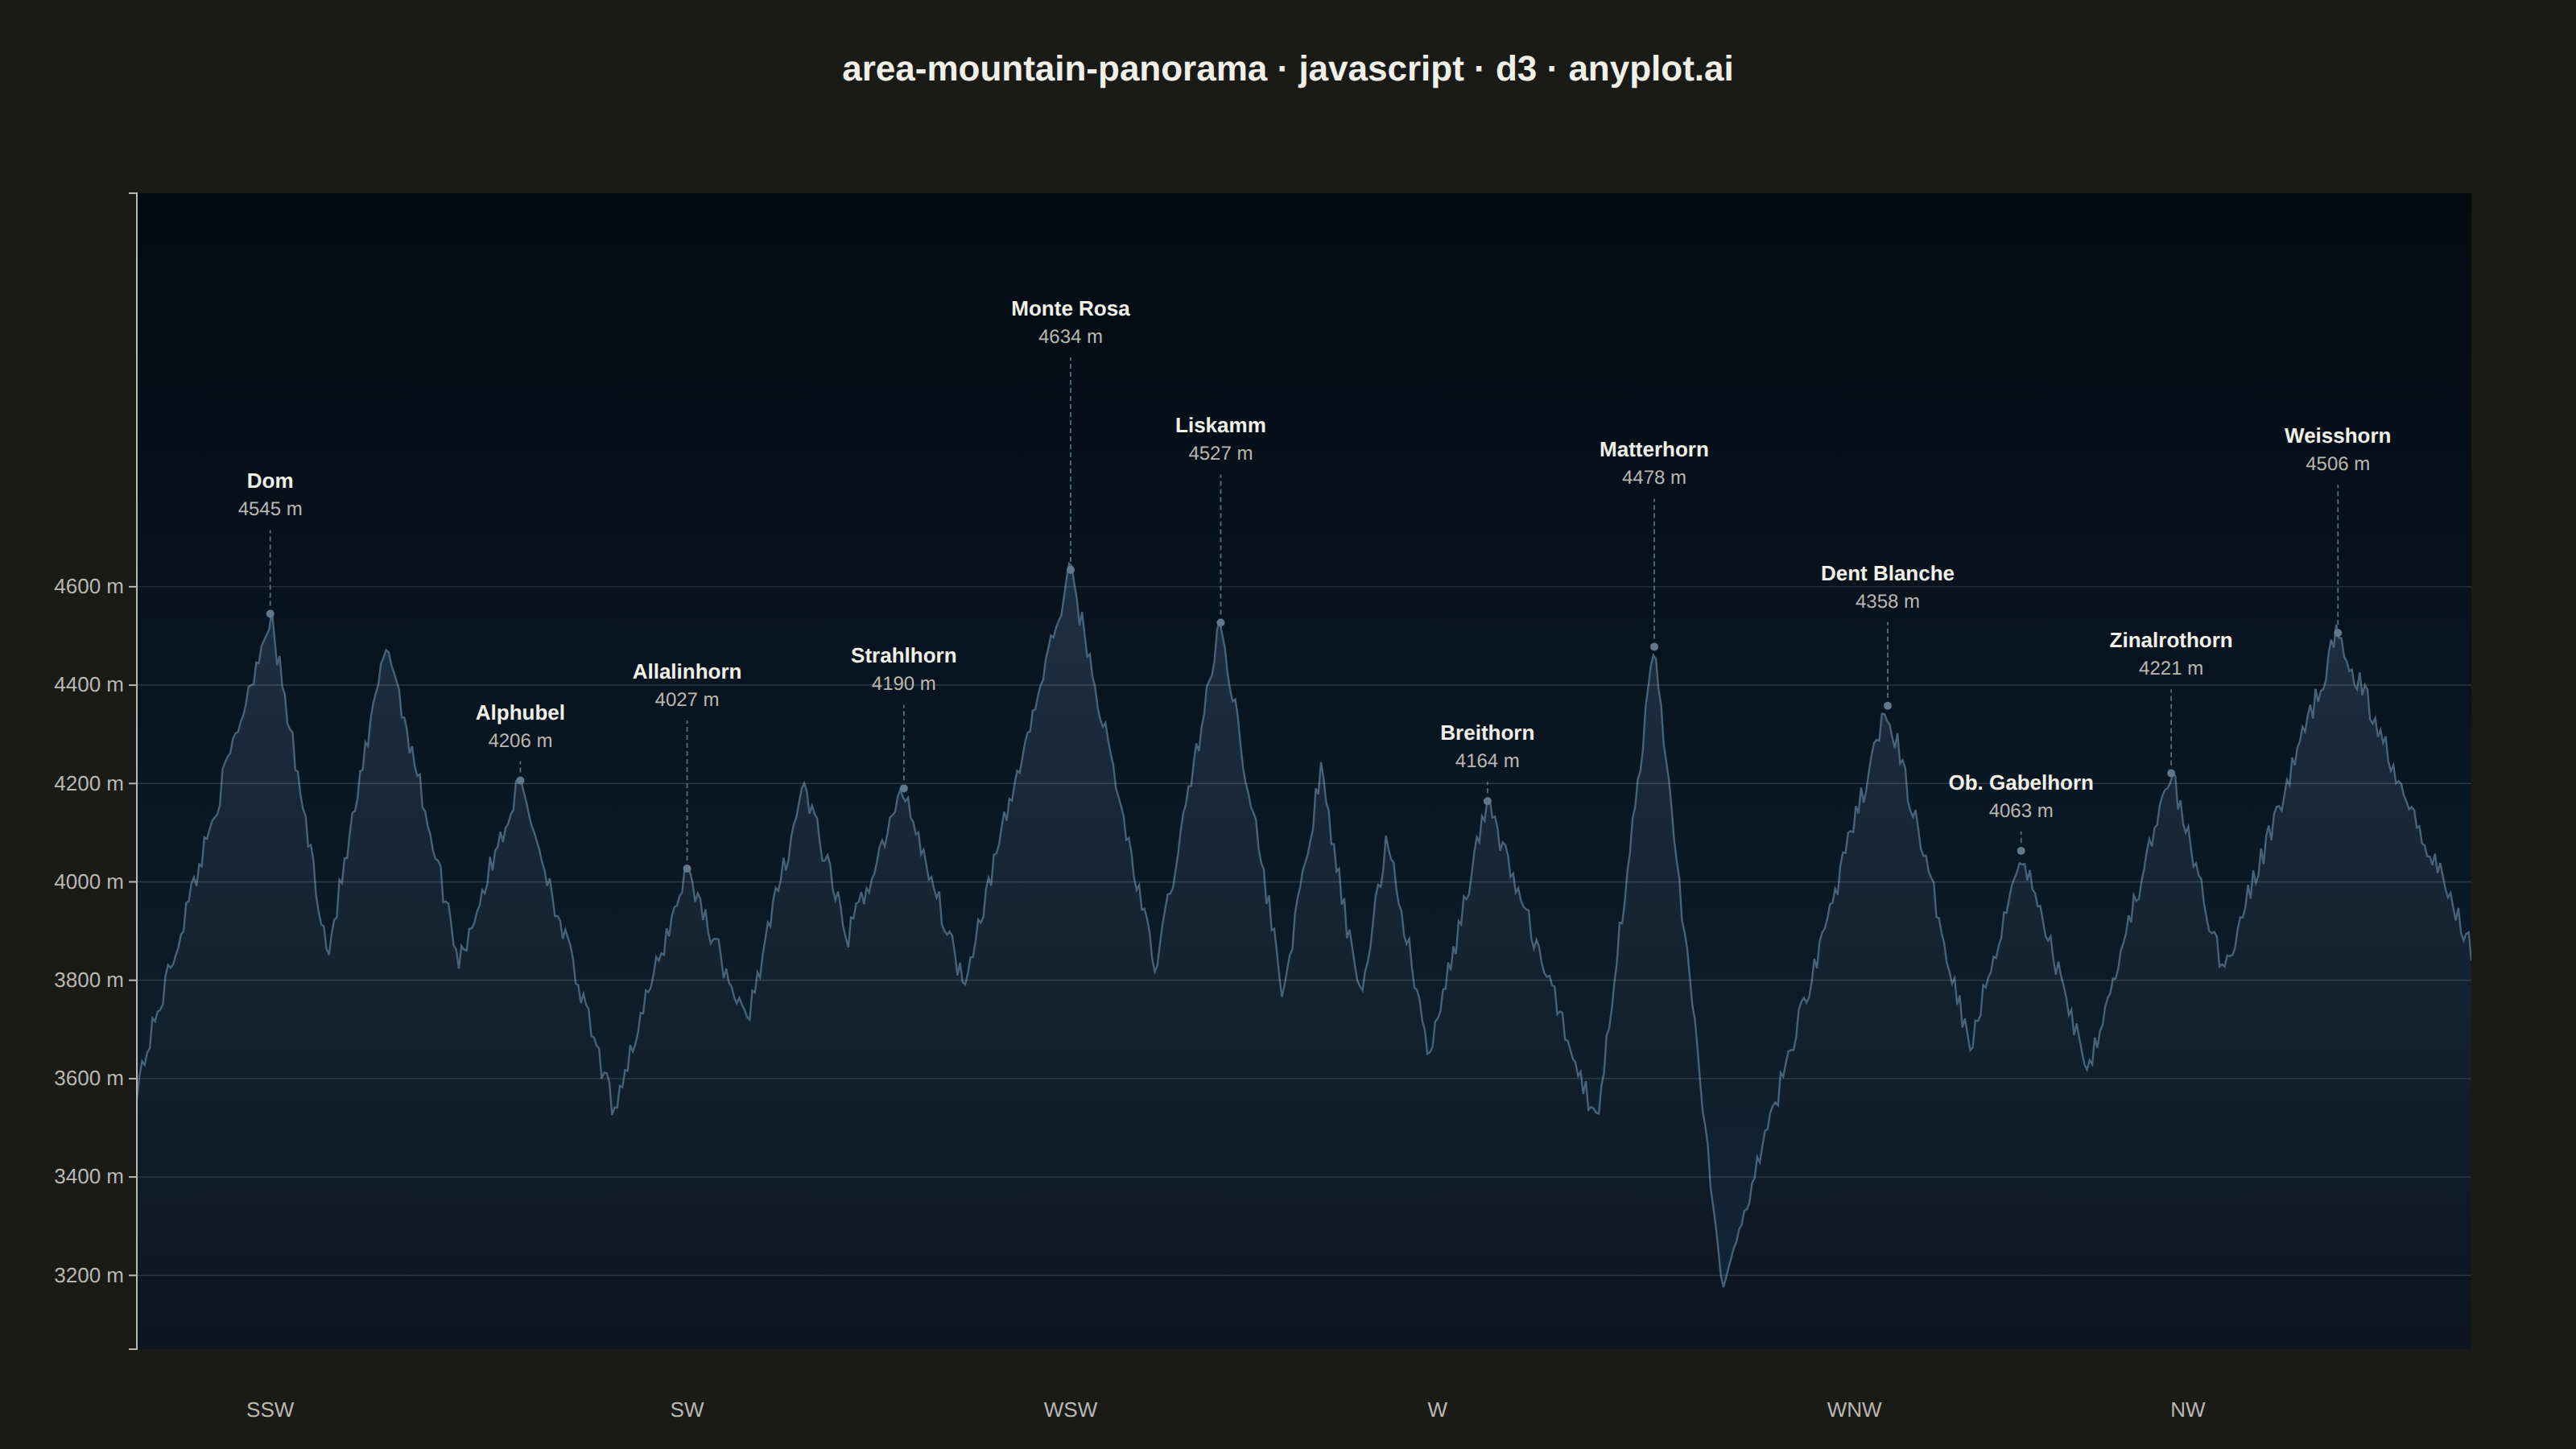
The same plot in 14 other libraries — JavaScript: Chart.js, Apache ECharts, Highcharts, MUI X Charts; Python: Altair, Bokeh, lets-plot, Matplotlib, Plotly, plotnine, Pygal, Seaborn; R: ggplot2; Julia: Makie.jl. Compare all 15 side by side: Mountain Panorama Profile with Labeled Peaks in Python, R, Julia and JavaScript.
A panoramic mountain silhouette chart that renders the horizon as seen from a fixed vantage point, like a photograph of a ridgeline against the sky. A filled area under the skyline curve traces the ridgeline across a horizontal viewing range (in degrees of bearing or horizontal distance), and major summits are annotated with their name and elevation. The skyline is jagged and angular — sharp triangular peaks with steep, often asymmetric flanks meeting at pointed apexes, connected by rugged ridges with cols, sub-peaks and rocky notches — not a sequence of smooth bell-shaped bumps. Unlike an elevation-profile-along-a-trail, this plot is the angular view of the surrounding peaks from a single observer, making it ideal for summit-identification infographics, alpine panoramas, and travel guides.
// anyplot.ai
// area-mountain-panorama: Mountain Panorama Profile with Labeled Peaks
// Library: d3 7.9.0 | JavaScript 22.23.0
// Quality: 91/100 | Created: 2026-06-30

const t = window.ANYPLOT_TOKENS;
const { width, height } = window.ANYPLOT_SIZE;
const margin = { top: 120, right: 65, bottom: 62, left: 85 };
const iw = width - margin.left - margin.right;
const ih = height - margin.top - margin.bottom;
const theme = window.ANYPLOT_THEME;

// Deterministic Park-Miller LCG (works within JS double precision)
let rngSeed = 42;
const rand = () => { rngSeed = (rngSeed * 16807) % 2147483647; return rngSeed / 2147483647; };

// 16 Wallis 4000-m peaks — ls/rs: left/right slope (m/°), lv: label level, ann: annotate
const peakDefs = [
  { name: "Dom",           angle: 200, elev: 4545, ls: 120, rs: 200, lv: 1, ann: true  },
  { name: "Täschhorn",     angle: 207, elev: 4491, ls: 180, rs: 150, lv: 0, ann: false },
  { name: "Alphubel",      angle: 215, elev: 4206, ls: 100, rs: 120, lv: 0, ann: true  },
  { name: "Allalinhorn",   angle: 225, elev: 4027, ls: 110, rs:  90, lv: 2, ann: true  },
  { name: "Rimpfischhorn", angle: 232, elev: 4199, ls: 140, rs: 120, lv: 0, ann: false },
  { name: "Strahlhorn",    angle: 238, elev: 4190, ls:  90, rs: 110, lv: 1, ann: true  },
  { name: "Monte Rosa",    angle: 248, elev: 4634, ls: 130, rs: 160, lv: 3, ann: true  },
  { name: "Liskamm",       angle: 257, elev: 4527, ls: 180, rs: 200, lv: 2, ann: true  },
  { name: "Castor",        angle: 263, elev: 4223, ls: 200, rs: 200, lv: 0, ann: false },
  { name: "Pollux",        angle: 267, elev: 4092, ls: 200, rs: 180, lv: 0, ann: false },
  { name: "Breithorn",     angle: 273, elev: 4164, ls: 150, rs: 100, lv: 0, ann: true  },
  { name: "Matterhorn",    angle: 283, elev: 4478, ls: 280, rs: 320, lv: 2, ann: true  },
  { name: "Dent Blanche",  angle: 297, elev: 4358, ls: 120, rs: 140, lv: 1, ann: true  },
  { name: "Ob. Gabelhorn", angle: 305, elev: 4063, ls: 130, rs: 110, lv: 0, ann: true  },
  { name: "Zinalrothorn",  angle: 314, elev: 4221, ls: 120, rs: 130, lv: 1, ann: true  },
  { name: "Weisshorn",     angle: 324, elev: 4506, ls: 100, rs:  80, lv: 2, ann: true  },
];

// Skyline: piecewise-linear tent functions (asymmetric slopes) + rocky jitter
const FLOOR = 3100, ANGLE_MIN = 192, ANGLE_MAX = 332, N_SAMPLES = 900;
const skyline = Array.from({ length: N_SAMPLES }, (_, i) => {
  const angle = ANGLE_MIN + (i / (N_SAMPLES - 1)) * (ANGLE_MAX - ANGLE_MIN);
  let elev = FLOOR;
  for (const p of peakDefs) {
    const da = angle - p.angle;
    const contrib = da < 0 ? p.elev + da * p.ls : p.elev - da * p.rs;
    if (contrib > elev) elev = contrib;
  }
  // Blend in rocky noise only well above valley floor
  const noise = (rand() - 0.5) * 55;
  const blend = Math.max(0, Math.min(1, (elev - FLOOR - 80) / 300));
  return { angle, elev: elev + noise * blend };
});

// SVG root
const svg = d3.select("#container").append("svg")
  .attr("width", width).attr("height", height);

const defs = svg.append("defs");

// Clip to inner area
defs.append("clipPath").attr("id", "clip-inner")
  .append("rect").attr("width", iw).attr("height", ih);

// Sky gradient (vertical, top → horizon)
const skyGrad = defs.append("linearGradient")
  .attr("id", "grad-sky").attr("x1", "0").attr("y1", "0").attr("x2", "0").attr("y2", "1");
const skyStops = theme === "light"
  ? [["0%", "#6FB2D2"], ["65%", "#BDD9EE"], ["100%", "#DCEEF8"]]
  : [["0%", "#030A12"], ["65%", "#0B1A28"], ["100%", "#15283A"]];
skyStops.forEach(([offset, color]) =>
  skyGrad.append("stop").attr("offset", offset).attr("stop-color", color)
);

// Silhouette gradient (rock face: lighter at ridge crest, darker at base)
const silGrad = defs.append("linearGradient")
  .attr("id", "grad-sil").attr("x1", "0").attr("y1", "0").attr("x2", "0").attr("y2", "1");
silGrad.append("stop").attr("offset", "0%").attr("stop-color", "#1E3044");
silGrad.append("stop").attr("offset", "100%").attr("stop-color", "#0C1520");

const g = svg.append("g").attr("transform", `translate(${margin.left},${margin.top})`);

// Sky fill
g.append("rect").attr("clip-path", "url(#clip-inner)")
  .attr("width", iw).attr("height", ih).attr("fill", "url(#grad-sky)");

// Scales
const ELEV_MIN = 3050, ELEV_MAX = 5400;
const xScale = d3.scaleLinear().domain([ANGLE_MIN, ANGLE_MAX]).range([0, iw]);
const yScale = d3.scaleLinear().domain([ELEV_MIN, ELEV_MAX]).range([ih, 0]);

// Silhouette area (fills from bottom up to ridgeline)
g.append("path").datum(skyline)
  .attr("clip-path", "url(#clip-inner)")
  .attr("d", d3.area()
    .x(d => xScale(d.angle)).y0(ih).y1(d => yScale(d.elev))
    .curve(d3.curveLinear))
  .attr("fill", "url(#grad-sil)");

// Ridgeline outline stroke
g.append("path").datum(skyline)
  .attr("clip-path", "url(#clip-inner)")
  .attr("d", d3.line()
    .x(d => xScale(d.angle)).y(d => yScale(d.elev))
    .curve(d3.curveLinear))
  .attr("fill", "none")
  .attr("stroke", theme === "light" ? "#2C3E52" : "#476278")
  .attr("stroke-width", 1.2);

// Horizontal gridlines
[3200, 3400, 3600, 3800, 4000, 4200, 4400, 4600].forEach(v => {
  g.append("line")
    .attr("x1", 0).attr("x2", iw)
    .attr("y1", yScale(v)).attr("y2", yScale(v))
    .attr("stroke", t.grid).attr("stroke-width", 0.7);
});

// Y axis (elevation in metres)
const yAxisG = g.append("g").call(
  d3.axisLeft(yScale)
    .tickValues([3200, 3400, 3600, 3800, 4000, 4200, 4400, 4600])
    .tickFormat(d => `${d} m`)
    .tickSize(5)
);
yAxisG.selectAll("text").attr("fill", t.inkSoft).style("font-size", "13px");
yAxisG.selectAll(".tick line").attr("stroke", t.inkSoft);
yAxisG.select(".domain").attr("stroke", t.inkSoft);

// Compass bearing labels along bottom
[
  { angle: 200, label: "SSW" }, { angle: 225, label: "SW" },
  { angle: 248, label: "WSW" }, { angle: 270, label: "W" },
  { angle: 295, label: "WNW" }, { angle: 315, label: "NW" },
].forEach(({ angle, label }) => {
  g.append("text")
    .attr("x", xScale(angle)).attr("y", ih + 42)
    .attr("text-anchor", "middle")
    .attr("fill", t.inkSoft).style("font-size", "13px")
    .text(label);
});

// Peak annotations: leader line + name + elevation
// 4 stagger levels (px above peak apex): 0→38, 1→78, 2→118, 3→158
const LEVELS = [38, 78, 118, 158];
const lineColor = theme === "light" ? "#8AABBF" : "#557080";
const dotColor  = theme === "light" ? "#B0CCDA" : "#607888";

peakDefs.filter(p => p.ann).forEach(peak => {
  const px = xScale(peak.angle);
  const py = yScale(peak.elev);
  const lyOff = LEVELS[peak.lv];
  const labelY = py - lyOff;

  // Dot at summit
  g.append("circle").attr("cx", px).attr("cy", py).attr("r", 2.5).attr("fill", dotColor);

  // Dashed leader line from dot up to label baseline
  g.append("line")
    .attr("x1", px).attr("y1", py - 5)
    .attr("x2", px).attr("y2", labelY + 26)
    .attr("stroke", lineColor).attr("stroke-width", 0.9)
    .attr("stroke-dasharray", "3,2");

  // Peak name
  g.append("text")
    .attr("x", px).attr("y", labelY)
    .attr("text-anchor", "middle")
    .attr("fill", t.ink).style("font-size", "13px").style("font-weight", "600")
    .text(peak.name);

  // Elevation
  g.append("text")
    .attr("x", px).attr("y", labelY + 17)
    .attr("text-anchor", "middle")
    .attr("fill", t.inkSoft).style("font-size", "12px")
    .text(`${peak.elev} m`);
});

// Title
svg.append("text")
  .attr("x", width / 2).attr("y", 50)
  .attr("text-anchor", "middle")
  .attr("fill", t.ink).style("font-size", "22px").style("font-weight", "600")
  .text("area-mountain-panorama · javascript · d3 · anyplot.ai");
Runnable source as JSON, for any HTTP client: https://api.anyplot.ai/specs/area-mountain-panorama/d3/code. Any spec id and library id listed in llms-full.txt fit the same URL shape; every URL below is complete and callable.
{
  "spec_id": "area-mountain-panorama",
  "language": "javascript",
  "library": "d3",
  "page": "https://anyplot.ai/area-mountain-panorama/javascript/d3",
  "hub": "https://anyplot.ai/area-mountain-panorama",
  "code_json": "https://api.anyplot.ai/specs/area-mountain-panorama/d3/code",
  "spec_json": "https://api.anyplot.ai/specs/area-mountain-panorama",
  "render_light_png": "https://storage.googleapis.com/anyplot-images/plots/area-mountain-panorama/javascript/d3/plot-light.png",
  "render_dark_png": "https://storage.googleapis.com/anyplot-images/plots/area-mountain-panorama/javascript/d3/plot-dark.png",
  "interactive_light_html": "https://storage.googleapis.com/anyplot-images/plots/area-mountain-panorama/javascript/d3/plot-light.html",
  "interactive_dark_html": "https://storage.googleapis.com/anyplot-images/plots/area-mountain-panorama/javascript/d3/plot-dark.html",
  "quality_score": 91.0,
  "license": "MIT",
  "guide": "https://anyplot.ai/llms.txt"
}
Part of Mountain Panorama Profile with Labeled Peaks on anyplot.ai.