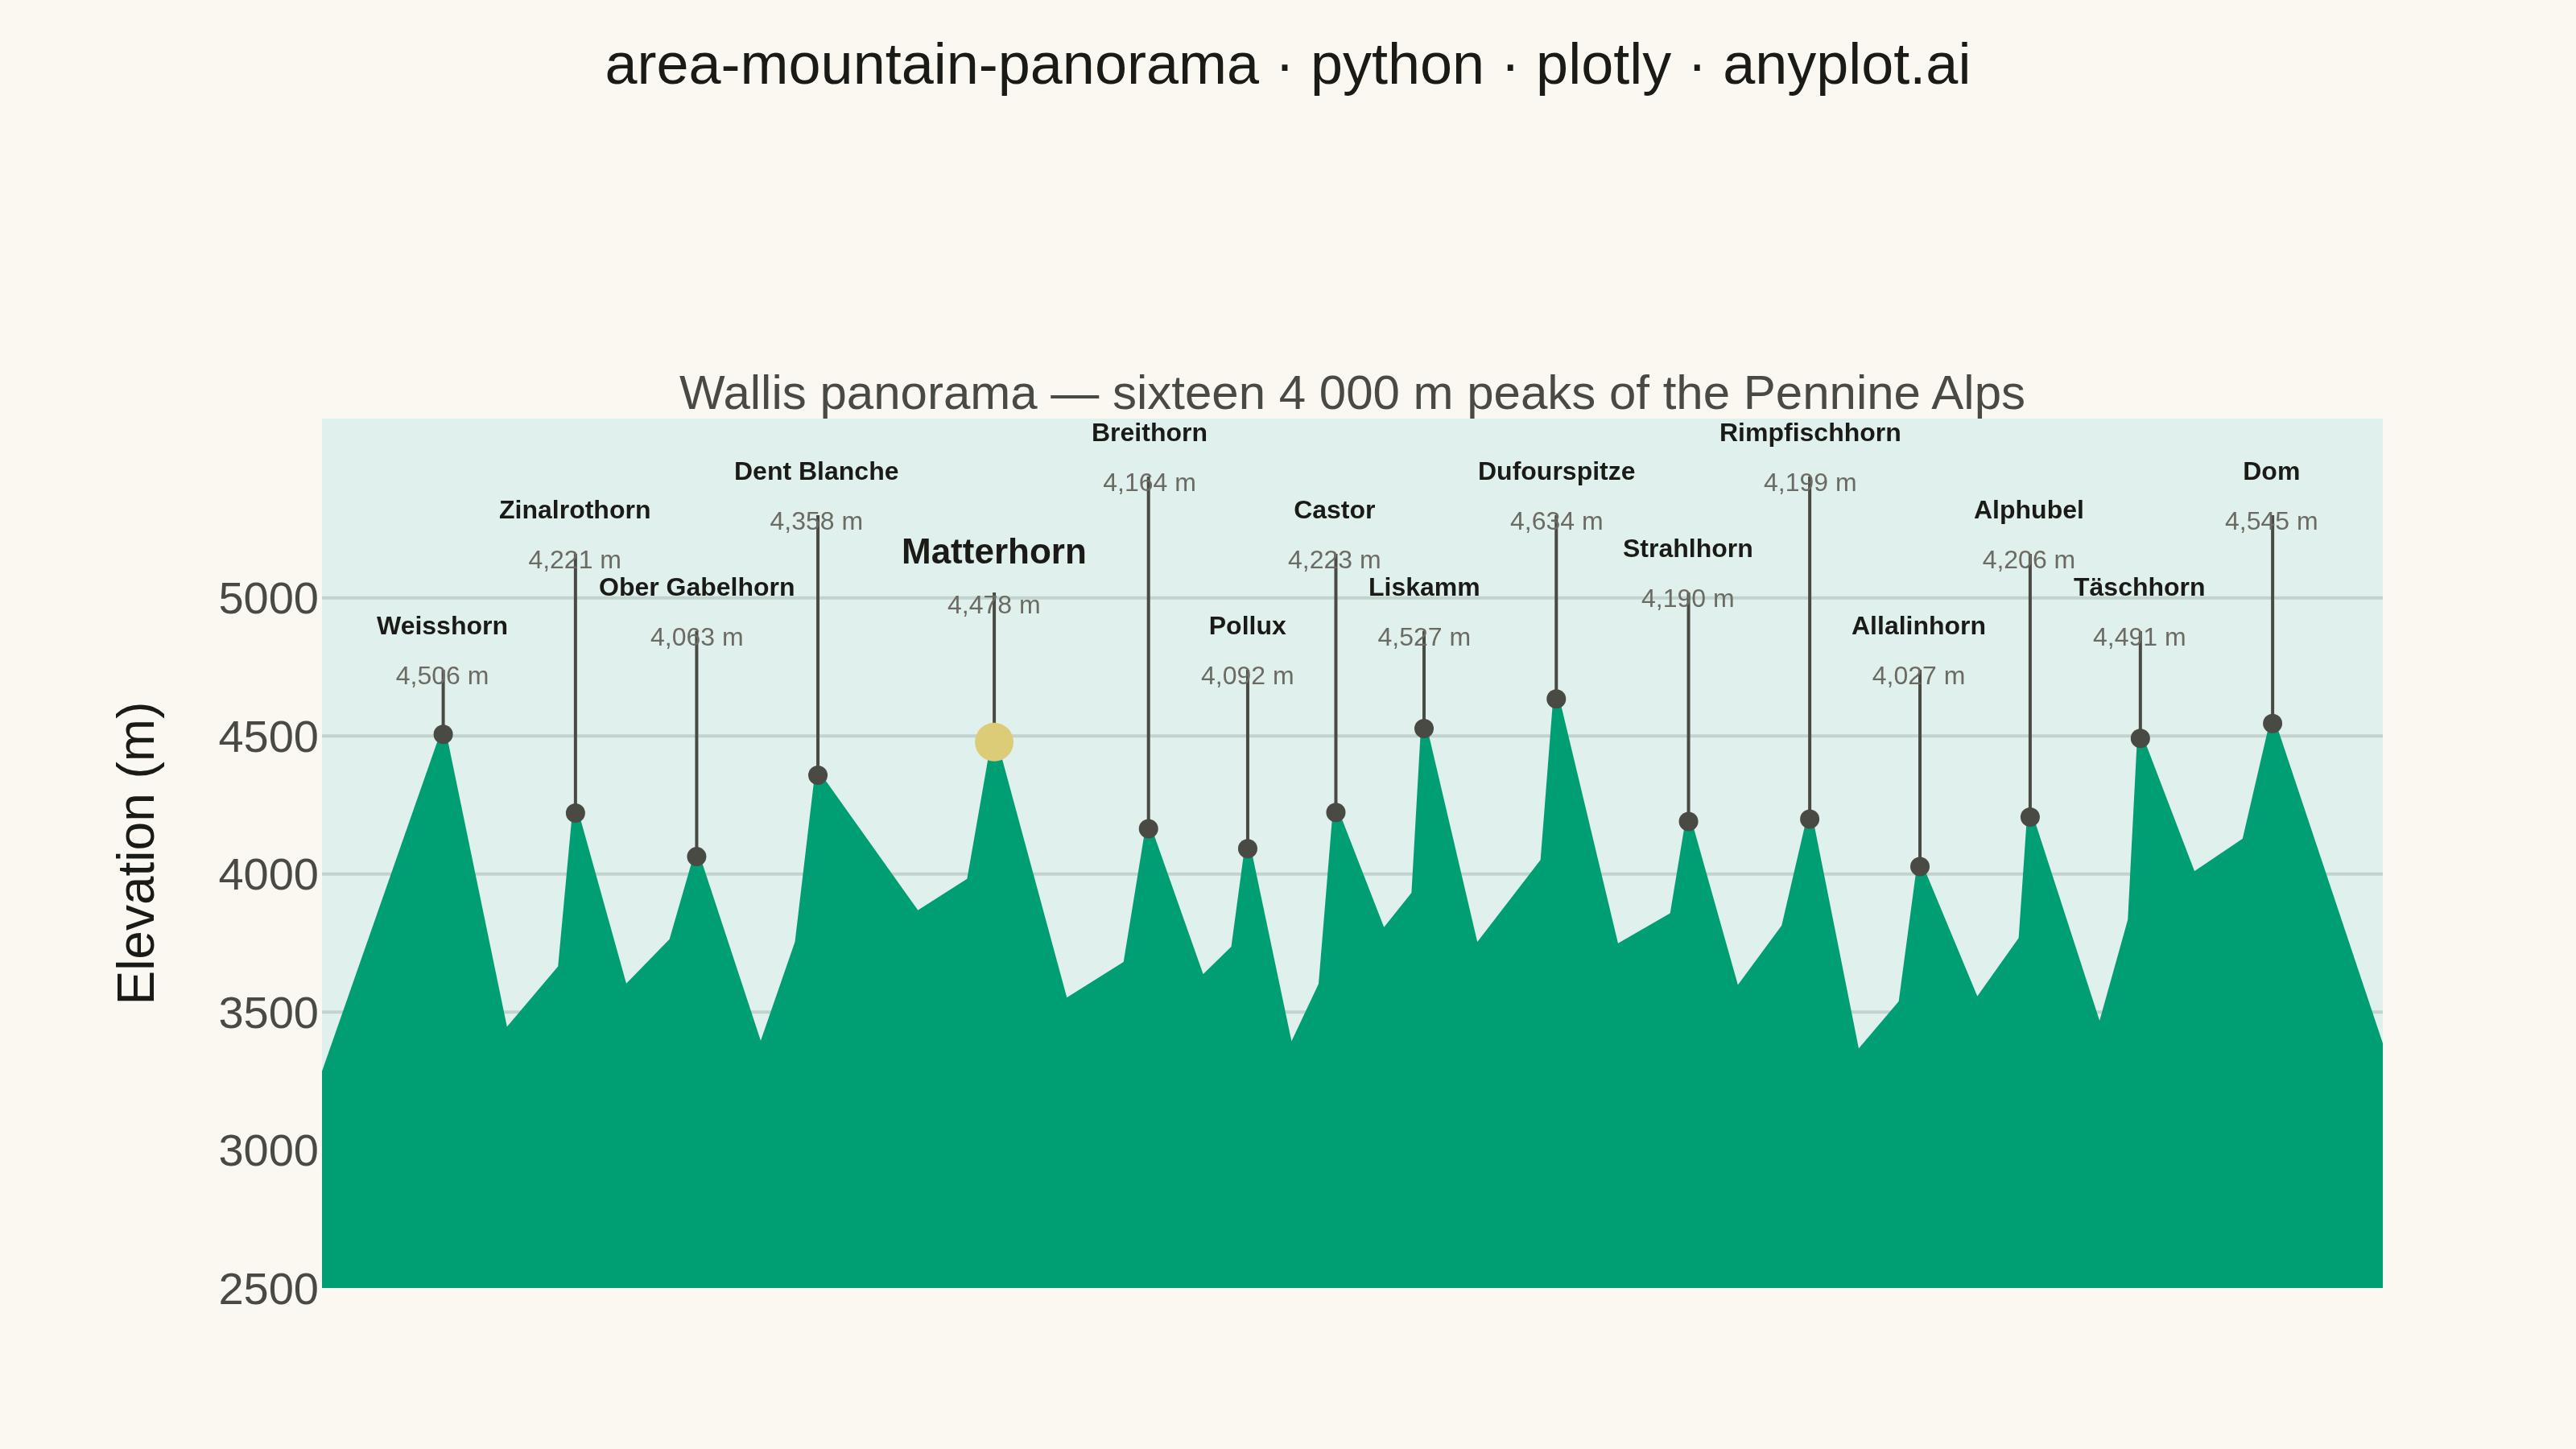
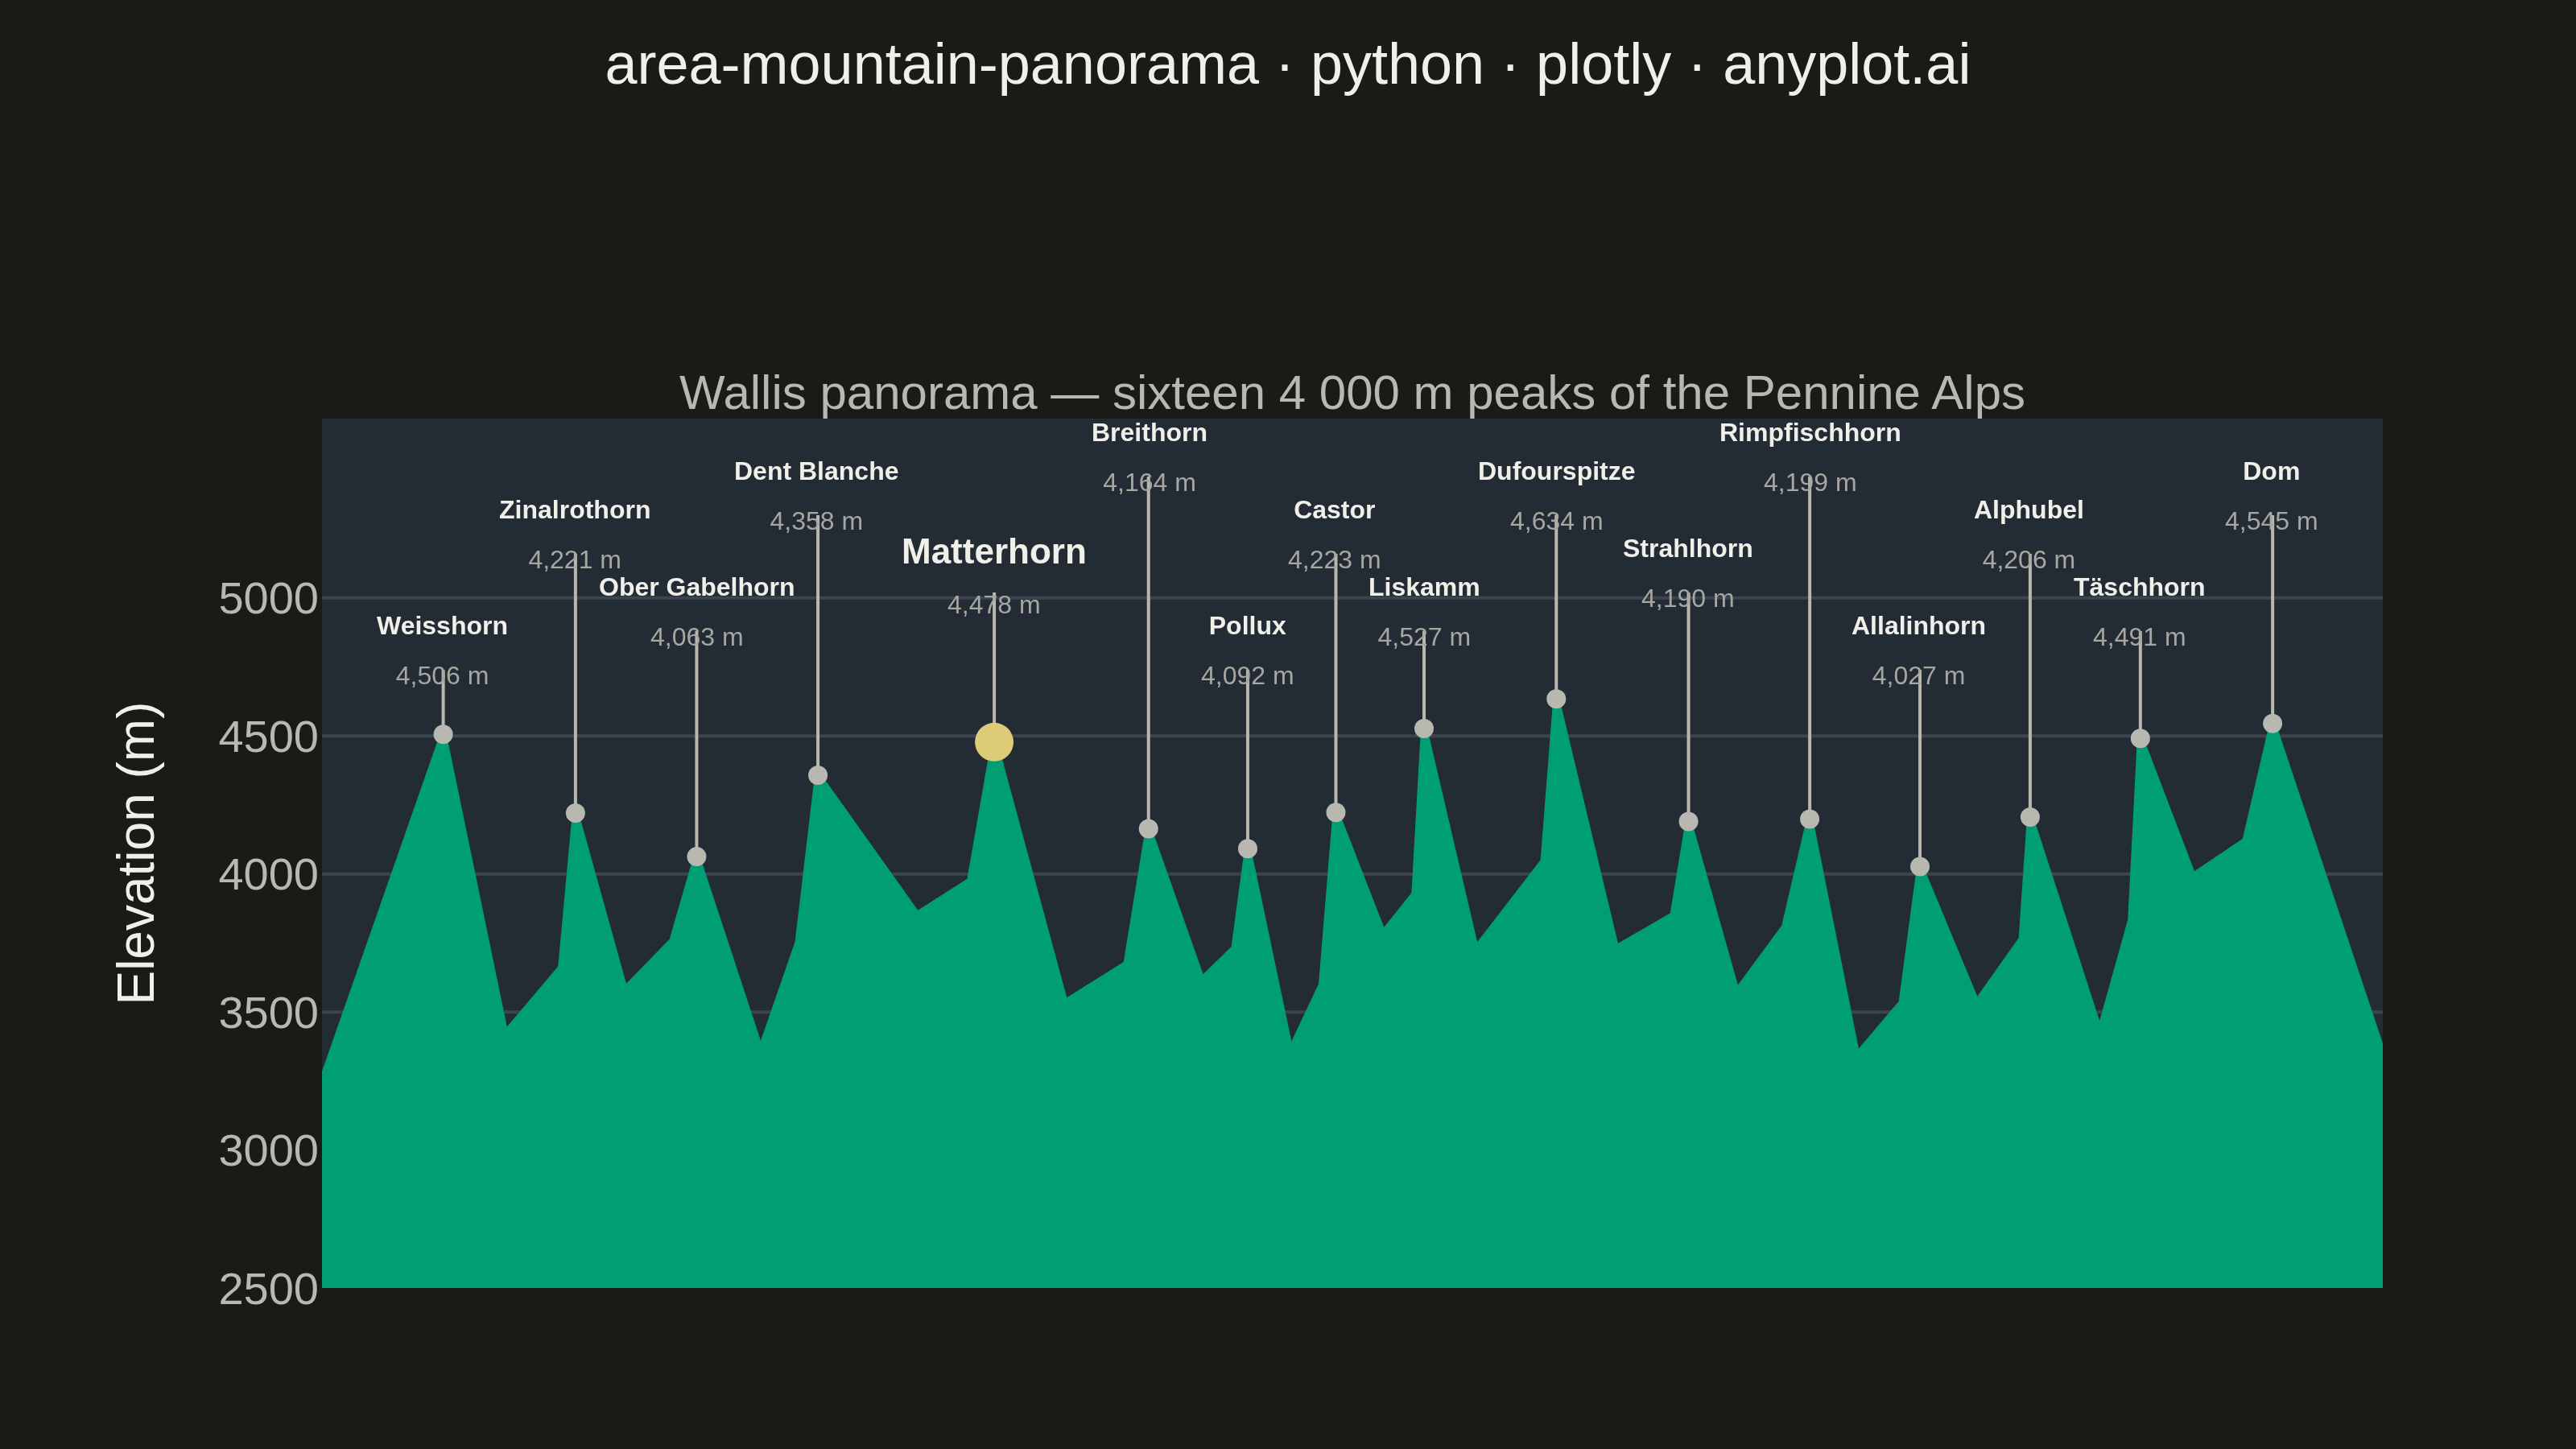
A panoramic mountain silhouette chart that renders the horizon as seen from a fixed vantage point, like a photograph of a ridgeline against the sky. A filled area under the skyline curve traces the ridgeline across a horizontal viewing range (in degrees of bearing or horizontal distance), and major summits are annotated with their name and elevation. The skyline is jagged and angular — sharp triangular peaks with steep, often asymmetric flanks meeting at pointed apexes, connected by rugged ridges with cols, sub-peaks and rocky notches — not a sequence of smooth bell-shaped bumps. Unlike an elevation-profile-along-a-trail, this plot is the angular view of the surrounding peaks from a single observer, making it ideal for summit-identification infographics, alpine panoramas, and travel guides.
""" anyplot.ai
area-mountain-panorama: Mountain Panorama Profile with Labeled Peaks
Library: plotly 6.8.0 | Python 3.13.14
Quality: 88/100 | Updated: 2026-06-30
"""

import os

import numpy as np
import plotly.graph_objects as go


# Theme tokens
THEME = os.getenv("ANYPLOT_THEME", "light")
PAGE_BG = "#FAF8F1" if THEME == "light" else "#1A1A17"
ELEVATED_BG = "#FFFDF6" if THEME == "light" else "#242420"
INK = "#1A1A17" if THEME == "light" else "#F0EFE8"
INK_SOFT = "#4A4A44" if THEME == "light" else "#B8B7B0"
INK_MUTED = "#6B6A63" if THEME == "light" else "#A8A79F"
GRID = "rgba(26,26,23,0.15)" if THEME == "light" else "rgba(240,239,232,0.15)"
BRAND = "#009E73"  # Imprint palette position 1 — mountain silhouette
AMBER = "#DDCC77"  # semantic anchor — focal peak (Matterhorn) spotlight

# Sky fill — Imprint cyan (light) / Imprint blue (dark) for atmospheric mood per spec
SKY_FILL = "rgba(42,188,205,0.12)" if THEME == "light" else "rgba(68,103,163,0.22)"

# Data — Wallis (Valais) panorama: peaks ordered along a 0–180° angular sweep
peaks = [
    ("Weisshorn", 8, 4506),
    ("Zinalrothorn", 20, 4221),
    ("Ober Gabelhorn", 31, 4063),
    ("Dent Blanche", 42, 4358),
    ("Matterhorn", 58, 4478),
    ("Breithorn", 72, 4164),
    ("Pollux", 81, 4092),
    ("Castor", 89, 4223),
    ("Liskamm", 97, 4527),
    ("Dufourspitze", 109, 4634),
    ("Strahlhorn", 121, 4190),
    ("Rimpfischhorn", 132, 4199),
    ("Allalinhorn", 142, 4027),
    ("Alphubel", 152, 4206),
    ("Täschhorn", 162, 4491),
    ("Dom", 174, 4545),
]

# Build piecewise-linear ridgeline: peaks connected by angular V-shaped saddles
# No smoothing — each segment is straight to produce the alpine angular silhouette
np.random.seed(42)

# Accumulate (x, y) control points for the full ridgeline
ridge_x = [-3.0]
ridge_y = [3250.0]

for i, (_, ang, el) in enumerate(peaks):
    # Approach flank: one intermediate point on the way up to the summit
    if len(ridge_x) > 1:
        prev_x = ridge_x[-1]
        prev_y = ridge_y[-1]
        # Steep asymmetric approach — put the inflection point close to the summit
        frac = np.random.uniform(0.65, 0.85)
        mid_x = prev_x + (ang - prev_x) * frac
        mid_y = prev_y + (el - prev_y) * np.random.uniform(0.15, 0.40)
        ridge_x.append(float(mid_x))
        ridge_y.append(float(mid_y))

    # Summit apex
    ridge_x.append(float(ang))
    ridge_y.append(float(el))

    if i < len(peaks) - 1:
        next_ang = peaks[i + 1][1]
        next_el = peaks[i + 1][2]
        # Saddle (col) between this peak and the next — sharp V bottom
        col_ang = (ang + next_ang) / 2 + np.random.uniform(-1.5, 1.5)
        col_drop = np.random.uniform(420, 820)
        col_el = min(el, next_el) - col_drop
        # Descent: straight to col
        ridge_x.append(float(col_ang))
        ridge_y.append(float(col_el))

ridge_x.append(184.0)
ridge_y.append(3350.0)

ridge_x = np.array(ridge_x)
ridge_y = np.array(ridge_y)

Y_FLOOR = 2500
Y_TOP = 5650

# Anchor the silhouette polygon at the lower edge of the visible y-range
poly_x = np.concatenate([[ridge_x[0]], ridge_x, [ridge_x[-1]]])
poly_y = np.concatenate([[Y_FLOOR], ridge_y, [Y_FLOOR]])

# Sky polygon above the ridgeline (fills from ridgeline to Y_TOP)
sky_x = np.concatenate([[ridge_x[0]], ridge_x, [ridge_x[-1]]])
sky_y = np.concatenate([[Y_TOP], ridge_y, [Y_TOP]])

# Assign label tiers — 6 tiers with interleaved (0,3,1,4,2,5) pattern so that
# consecutive peaks always land 280-420 m apart vertically, avoiding overlap
# even when peaks are only 8-10° apart horizontally.
LABEL_TIERS = [4800, 4940, 5080, 5220, 5360, 5500]
TIER_ORDER = [0, 3, 1, 4, 2, 5]  # interleave low/high for max vertical spread

label_tiers = [LABEL_TIERS[TIER_ORDER[i % len(TIER_ORDER)]] for i in range(len(peaks))]

# Plot
fig = go.Figure()

# Sky fill behind silhouette — Imprint palette atmospheric tint per spec
fig.add_trace(
    go.Scatter(
        x=sky_x,
        y=sky_y,
        mode="lines",
        line={"color": "rgba(0,0,0,0)", "width": 0},
        fill="toself",
        fillcolor=SKY_FILL,
        hoverinfo="skip",
        showlegend=False,
    )
)

# Mountain silhouette (first categorical series — Imprint brand green)
fig.add_trace(
    go.Scatter(
        x=poly_x,
        y=poly_y,
        mode="lines",
        line={"color": BRAND, "width": 2},
        fill="toself",
        fillcolor=BRAND,
        hoverinfo="skip",
        showlegend=False,
    )
)

# Leader lines + peak markers + labels
annotations = []
for i, (name, ang, el) in enumerate(peaks):
    label_y = label_tiers[i]
    is_focal = name == "Matterhorn"

    # Leader line (thin, theme-adaptive)
    fig.add_trace(
        go.Scatter(
            x=[ang, ang],
            y=[el + 25, label_y - 60],
            mode="lines",
            line={"color": INK_SOFT, "width": 1},
            hoverinfo="skip",
            showlegend=False,
        )
    )

    # Summit dot — Matterhorn gets amber focal treatment for visual distinction
    dot_color = AMBER if is_focal else INK_SOFT
    dot_size = 12 if is_focal else 6
    fig.add_trace(
        go.Scatter(
            x=[ang],
            y=[el],
            mode="markers",
            marker={"size": dot_size, "color": dot_color, "line": {"width": 0}},
            hoverinfo="skip",
            showlegend=False,
        )
    )

    # Label: name on top, elevation below — compact fonts to prevent truncation
    name_size = 11 if is_focal else 8
    weight = "700" if is_focal else "600"
    annotations.append(
        {
            "x": ang,
            "y": label_y,
            "text": (
                f"<span style='font-size:{name_size}px;font-weight:{weight};color:{INK}'>{name}</span><br>"
                f"<span style='font-size:8px;color:{INK_MUTED}'>{el:,} m</span>"
            ),
            "showarrow": False,
            "align": "center",
            "xanchor": "center",
            "yanchor": "middle",
        }
    )

# Subtitle annotation
annotations.append(
    {
        "x": 0.5,
        "y": 1.07,
        "xref": "paper",
        "yref": "paper",
        "text": f"<span style='color:{INK_SOFT}'>Wallis panorama — sixteen 4 000 m peaks of the Pennine Alps</span>",
        "showarrow": False,
        "font": {"size": 15},
        "xanchor": "center",
    }
)

fig.update_layout(
    autosize=False,
    title={
        "text": "area-mountain-panorama · python · plotly · anyplot.ai",
        "font": {"size": 18, "color": INK},
        "x": 0.5,
        "xanchor": "center",
        "y": 0.97,
    },
    annotations=annotations,
    paper_bgcolor=PAGE_BG,
    plot_bgcolor=PAGE_BG,
    font={"color": INK},
    xaxis={
        "range": [-3, 184],
        "showgrid": False,
        "showticklabels": False,
        "ticks": "",
        "zeroline": False,
        "showline": False,
        "fixedrange": True,
    },
    yaxis={
        "title": {"text": "Elevation (m)", "font": {"size": 16, "color": INK}},
        "tickfont": {"size": 14, "color": INK_SOFT},
        "tickvals": [2500, 3000, 3500, 4000, 4500, 5000],
        "ticksuffix": "  ",
        "gridcolor": GRID,
        "linecolor": INK_SOFT,
        "showgrid": True,
        "zeroline": False,
        "showline": False,
        "ticks": "",
        "range": [Y_FLOOR, Y_TOP],
    },
    margin={"l": 100, "r": 60, "t": 130, "b": 50},
)

fig.write_image(f"plot-{THEME}.png", width=800, height=450, scale=4)
fig.write_html(f"plot-{THEME}.html", include_plotlyjs="cdn")
Runnable source as JSON, for any HTTP client: https://api.anyplot.ai/specs/area-mountain-panorama/plotly/code. Any spec id and library id listed in llms-full.txt fit the same URL shape; every URL below is complete and callable.
{
  "spec_id": "area-mountain-panorama",
  "language": "python",
  "library": "plotly",
  "page": "https://anyplot.ai/area-mountain-panorama/python/plotly",
  "hub": "https://anyplot.ai/area-mountain-panorama",
  "code_json": "https://api.anyplot.ai/specs/area-mountain-panorama/plotly/code",
  "spec_json": "https://api.anyplot.ai/specs/area-mountain-panorama",
  "render_light_png": "https://storage.googleapis.com/anyplot-images/plots/area-mountain-panorama/python/plotly/plot-light.png",
  "render_dark_png": "https://storage.googleapis.com/anyplot-images/plots/area-mountain-panorama/python/plotly/plot-dark.png",
  "interactive_light_html": "https://storage.googleapis.com/anyplot-images/plots/area-mountain-panorama/python/plotly/plot-light.html",
  "interactive_dark_html": "https://storage.googleapis.com/anyplot-images/plots/area-mountain-panorama/python/plotly/plot-dark.html",
  "quality_score": 88.0,
  "license": "MIT",
  "guide": "https://anyplot.ai/llms.txt"
}
Part of Mountain Panorama Profile with Labeled Peaks on anyplot.ai.