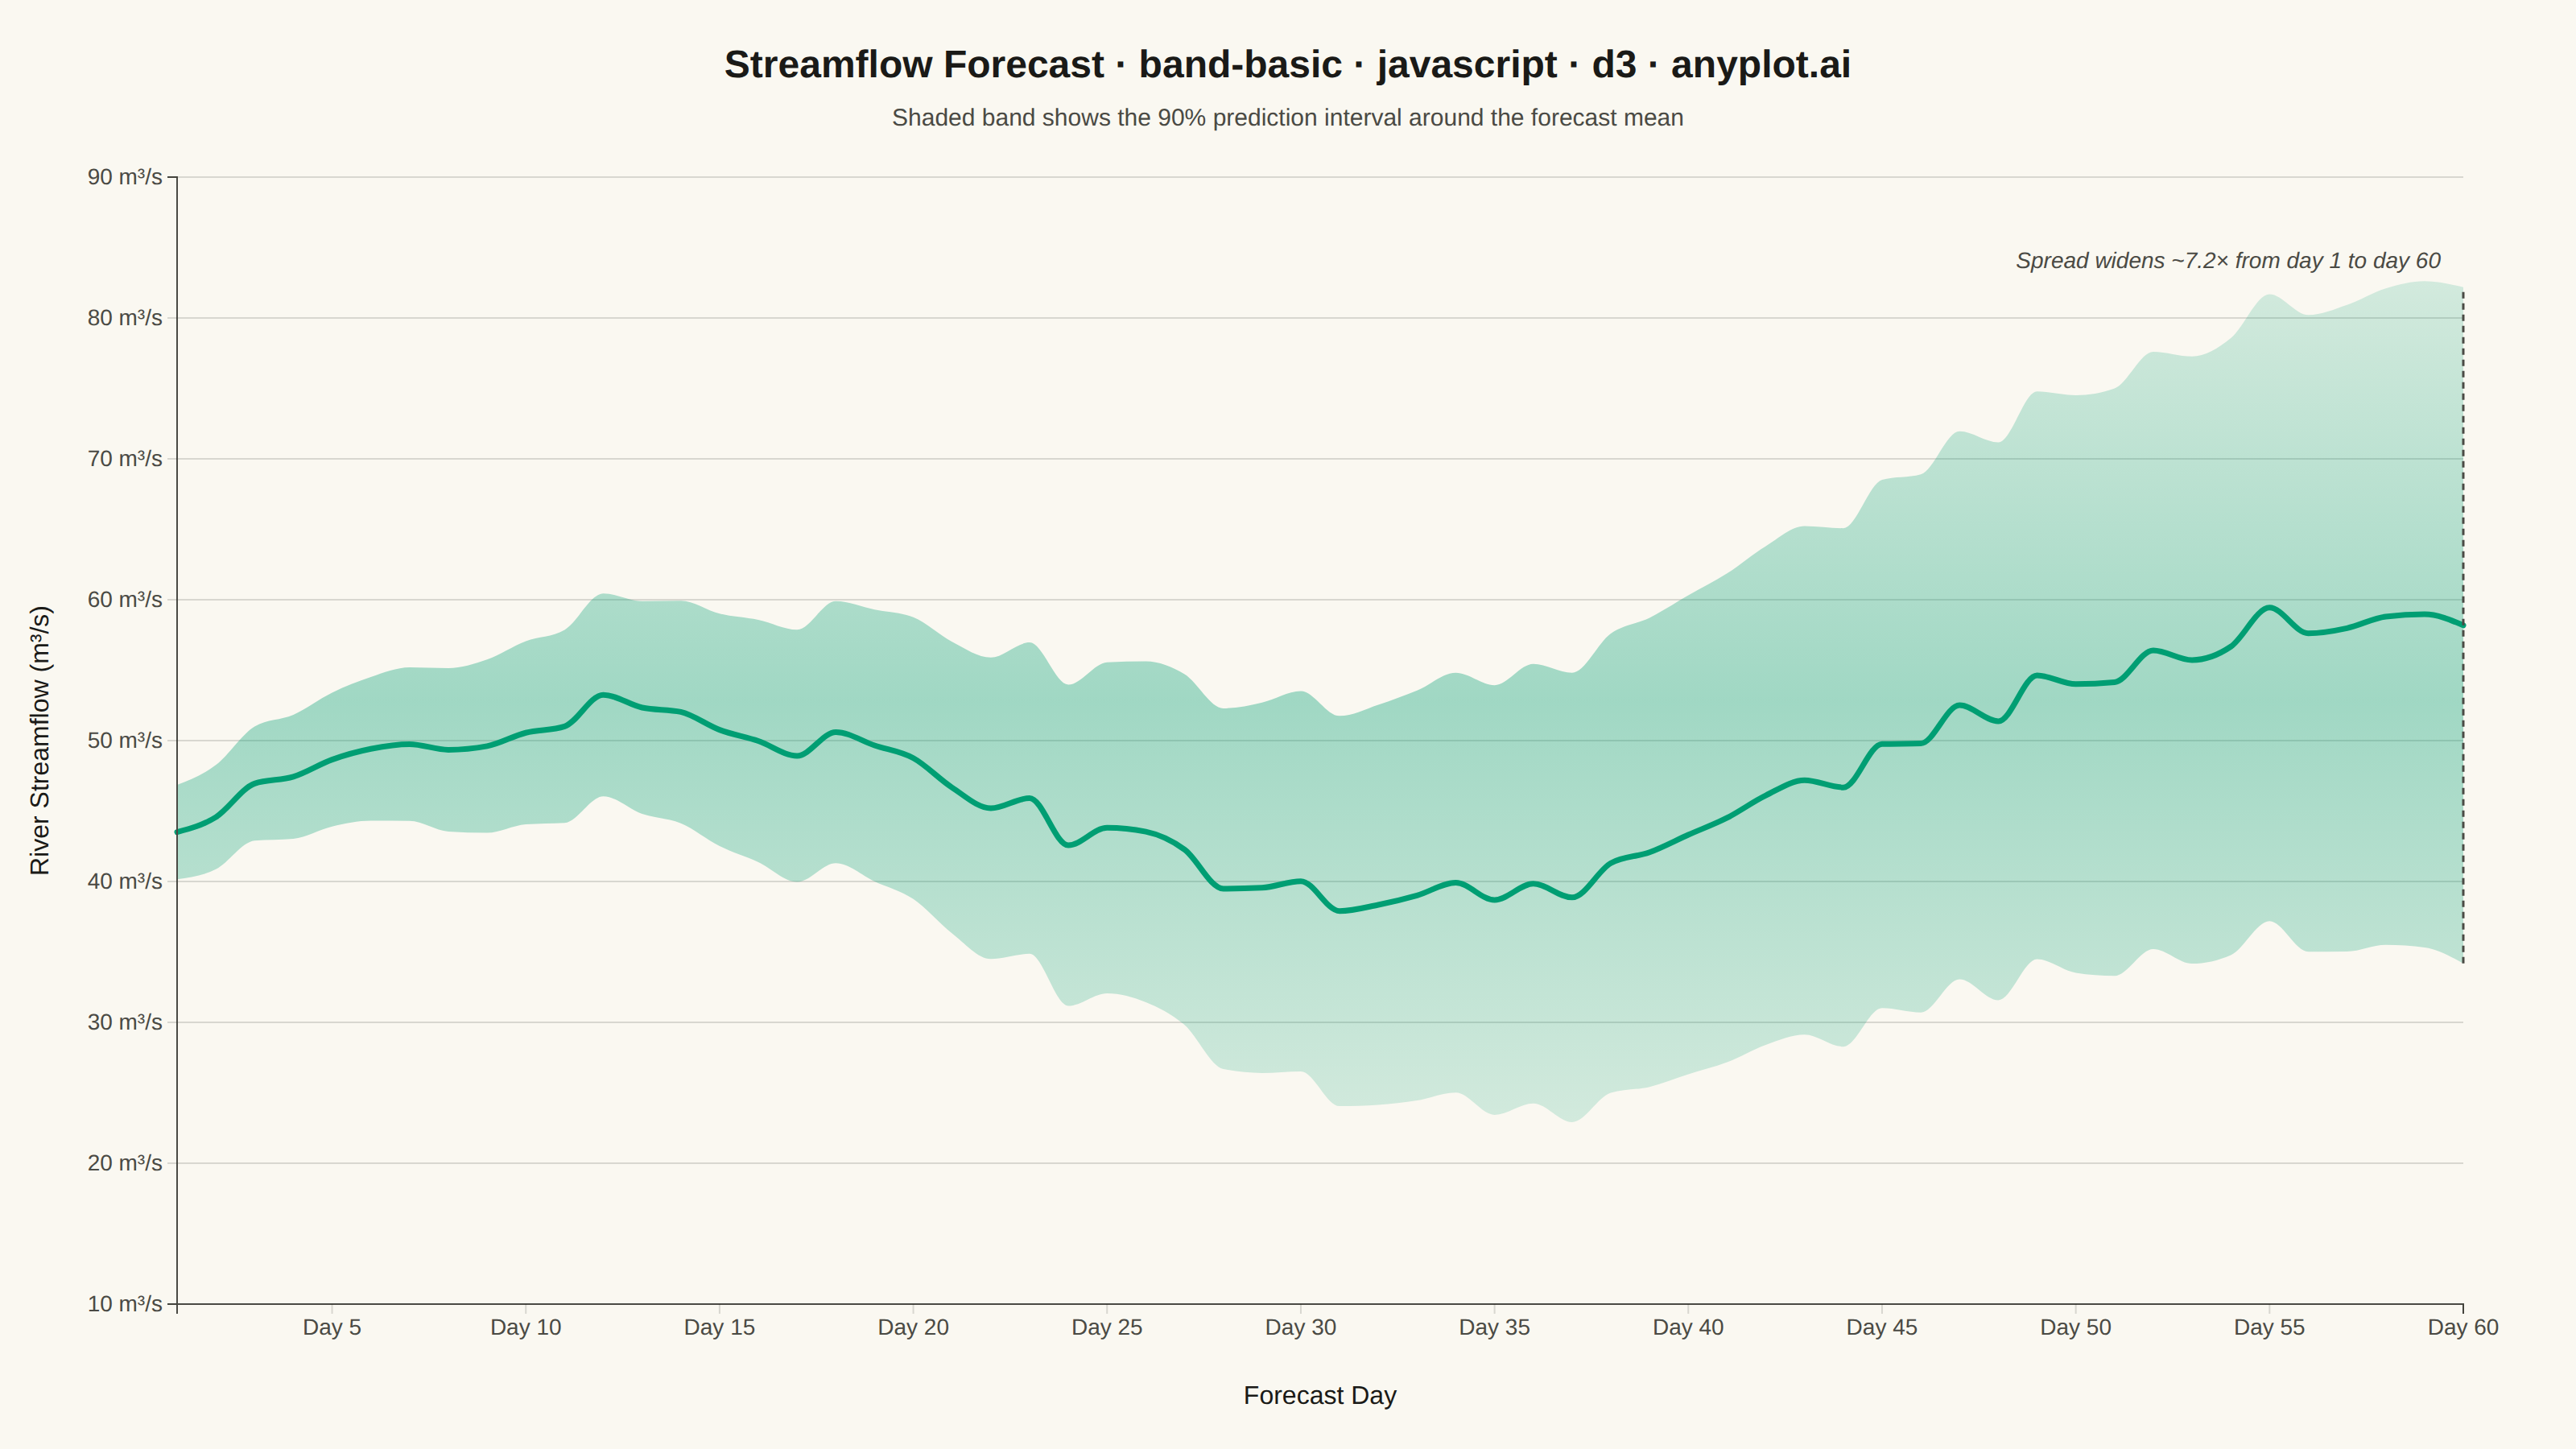
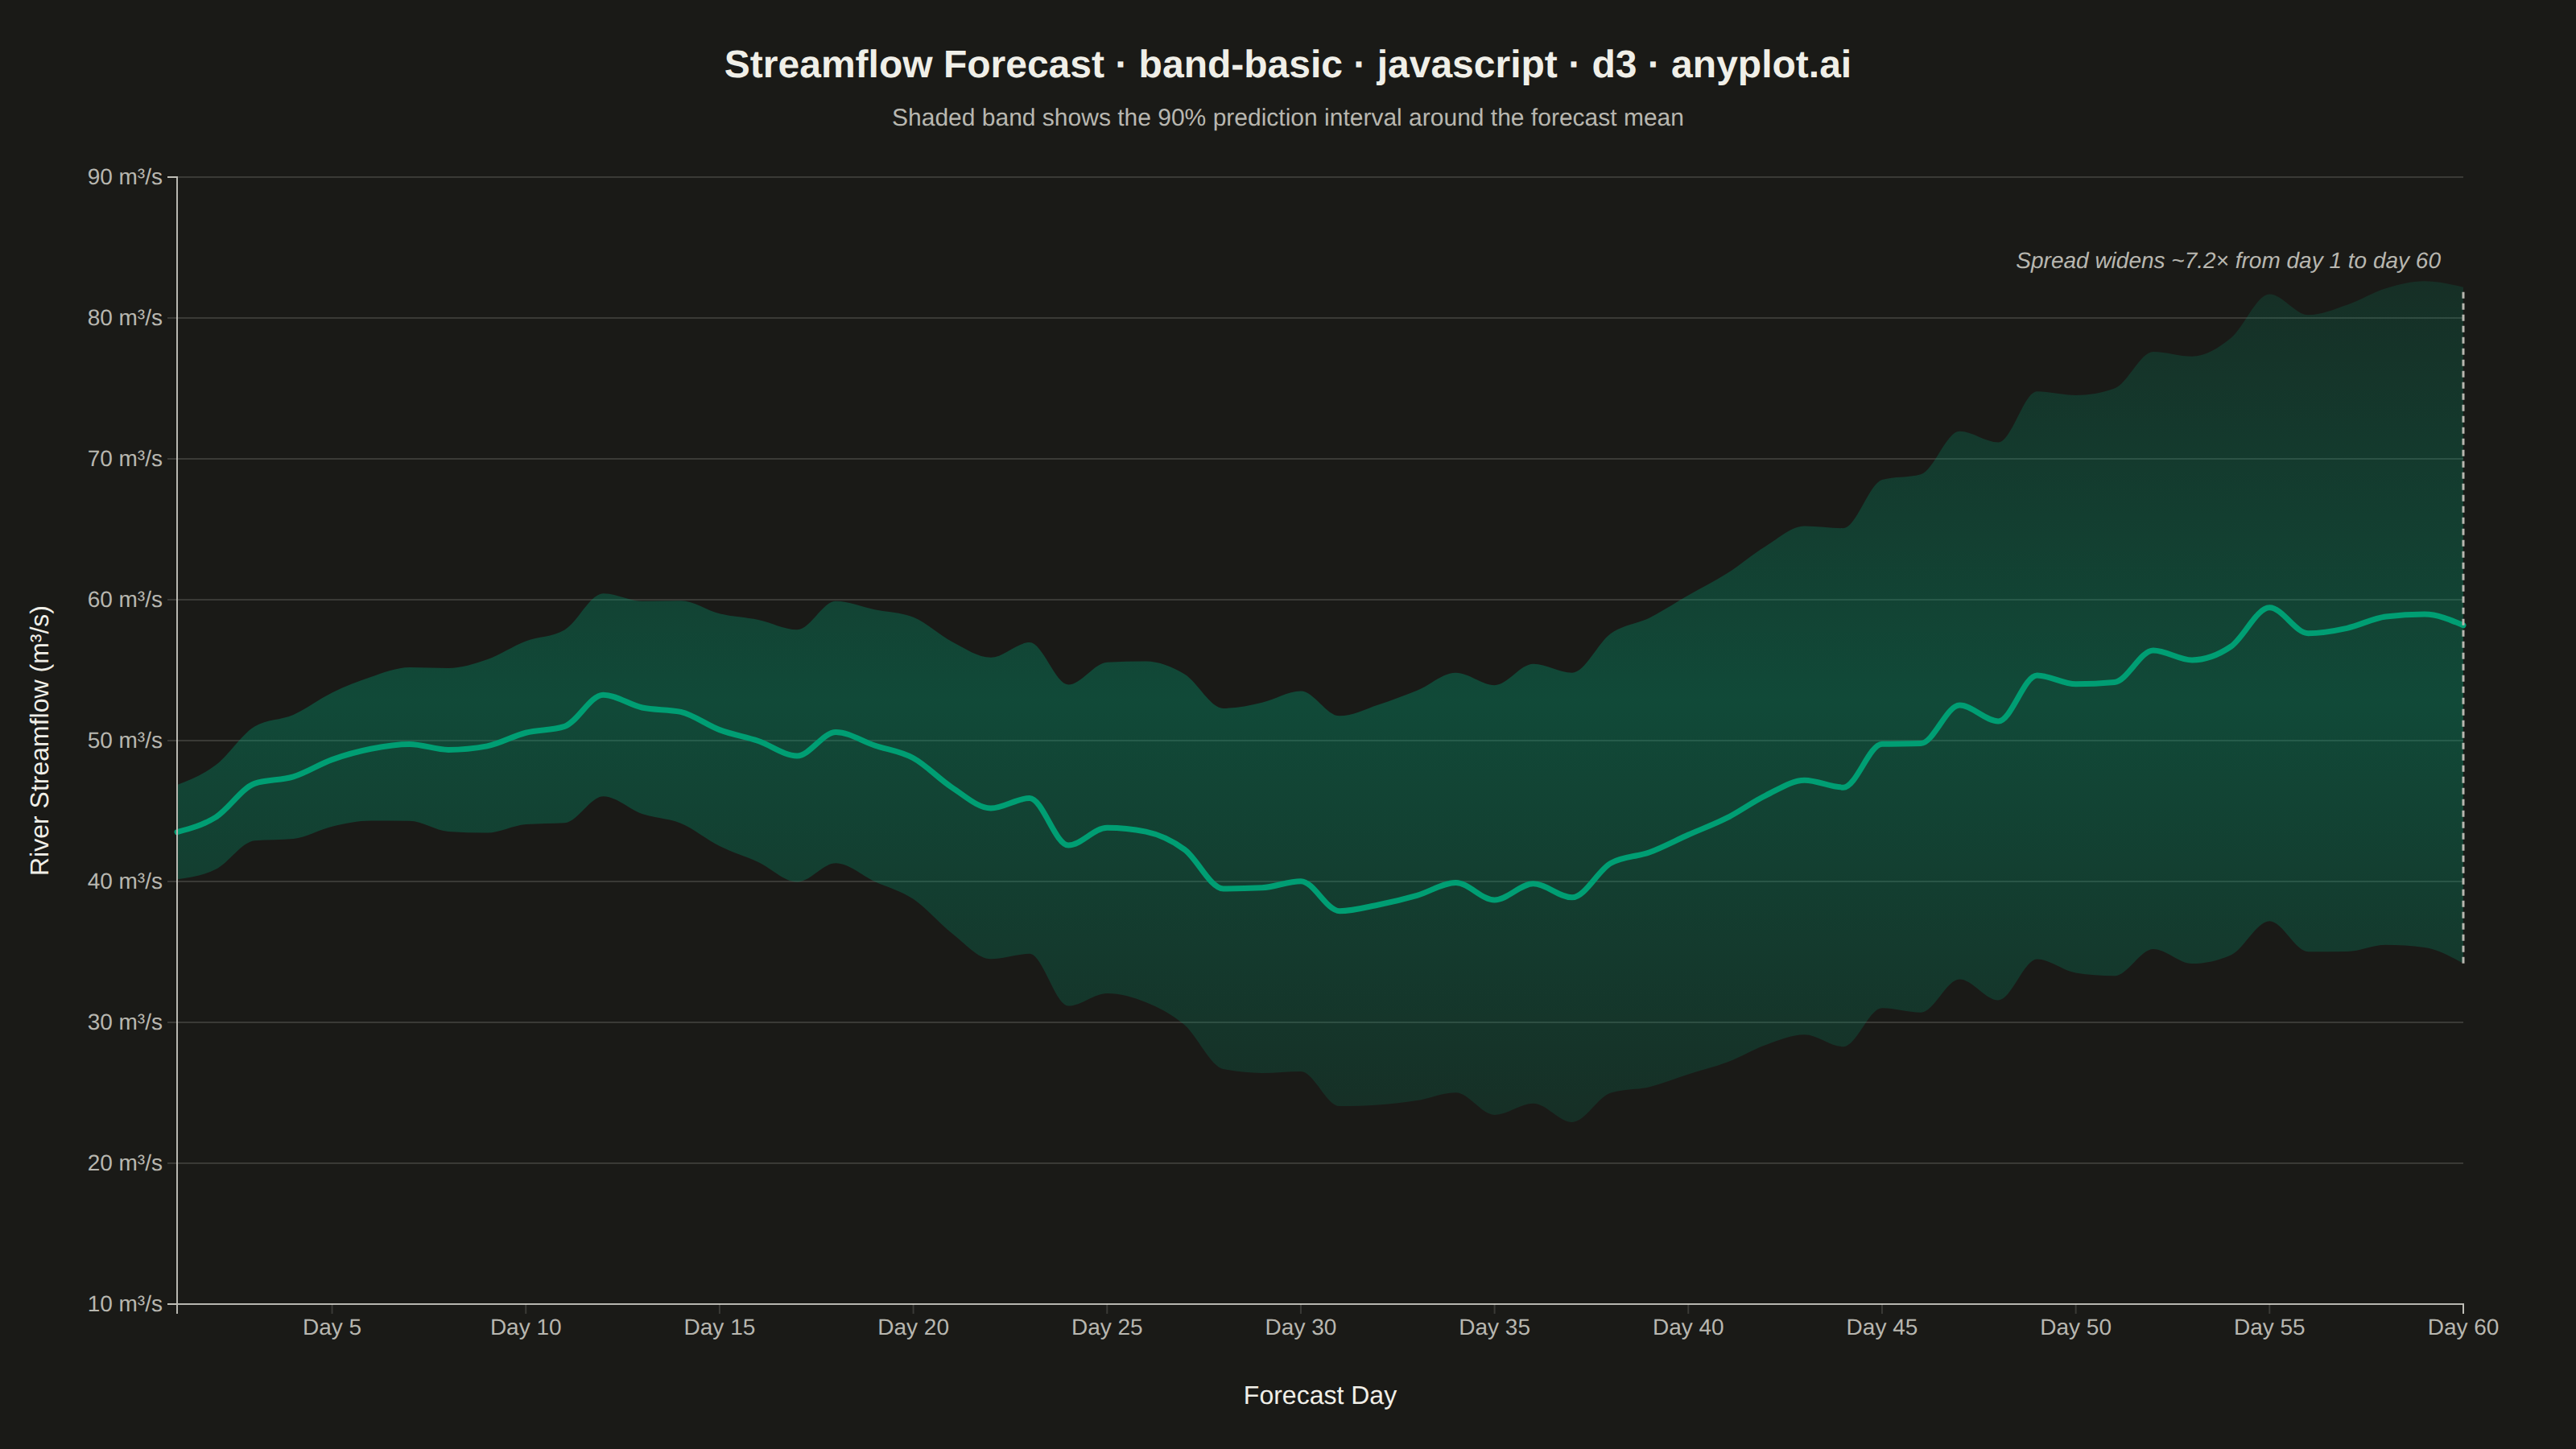
A band plot displays a filled region between two boundary lines, commonly used to show confidence intervals, prediction intervals, or ranges around a central trend line. The semi-transparent band provides visual representation of uncertainty or variability while maintaining visibility of underlying data or overlapping elements.
Preview render from the D3.js implementation.