The same plot in 14 other libraries — JavaScript: Chart.js, Apache ECharts, Highcharts, MUI X Charts; Python: Altair, Bokeh, lets-plot, Matplotlib, Plotly, plotnine, Pygal, Seaborn; R: ggplot2; Julia: Makie.jl. Compare all 15 side by side: Basic Band Plot in Python, R, Julia and JavaScript.
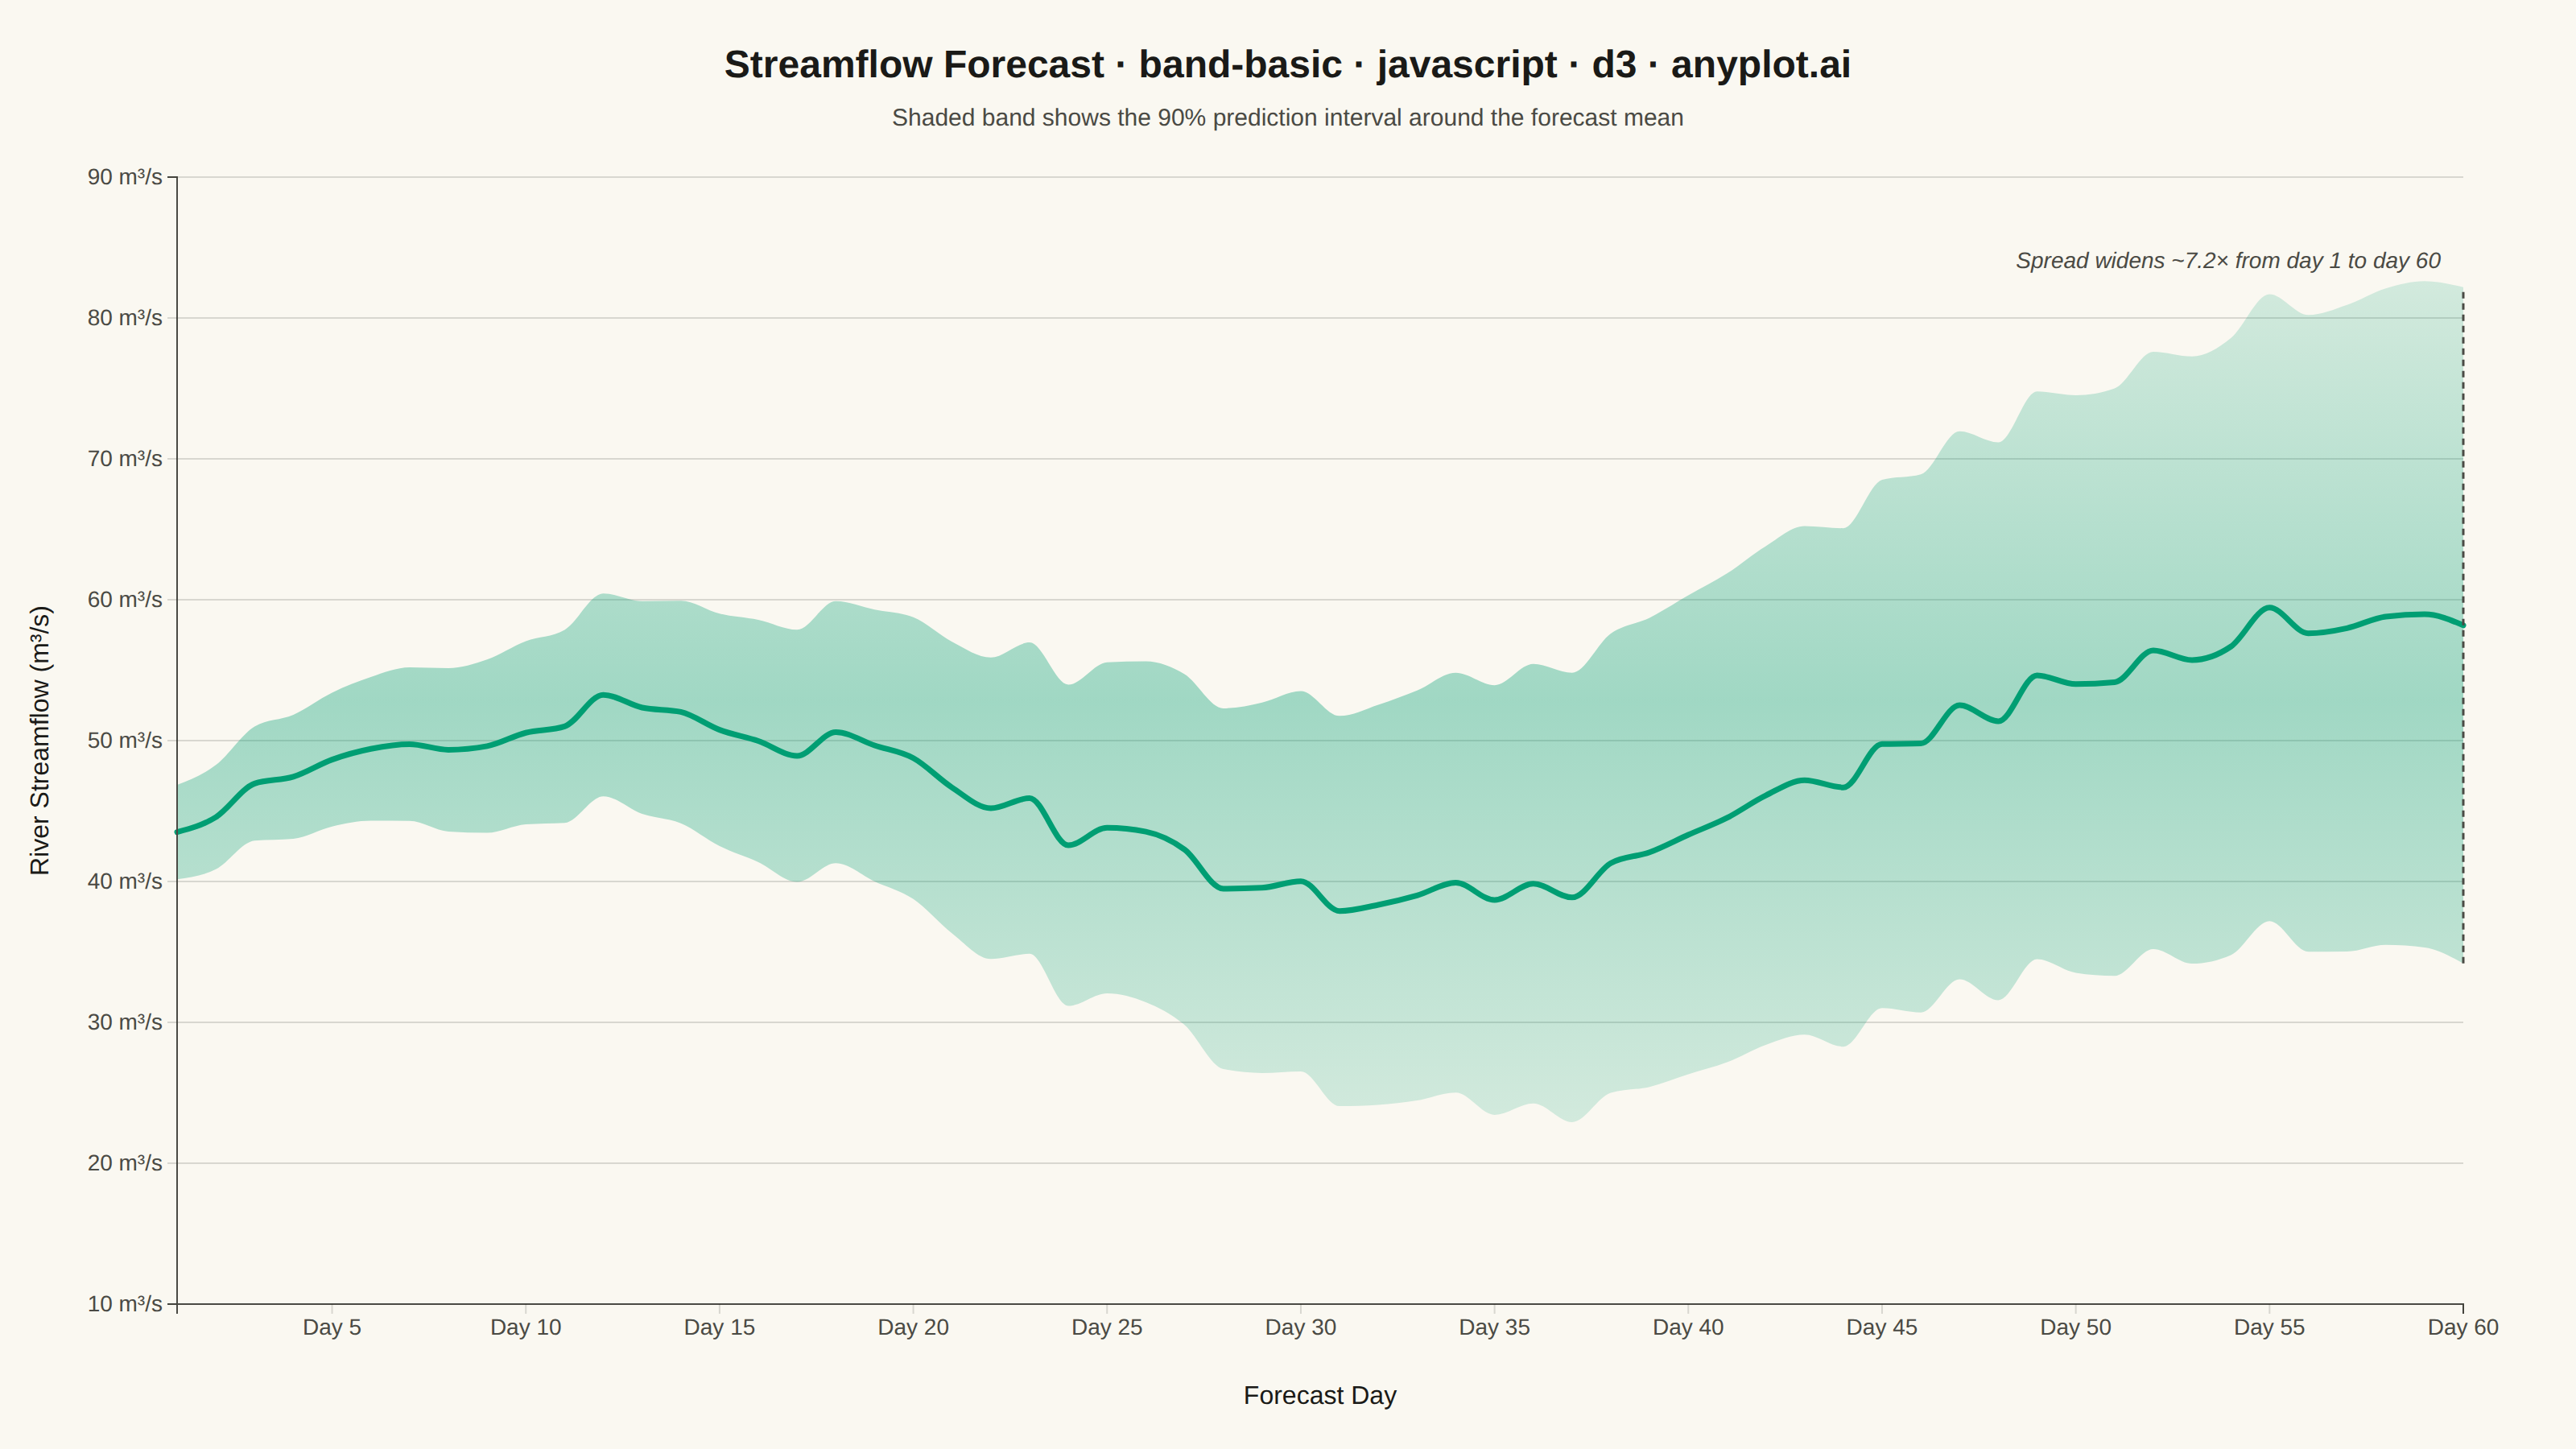
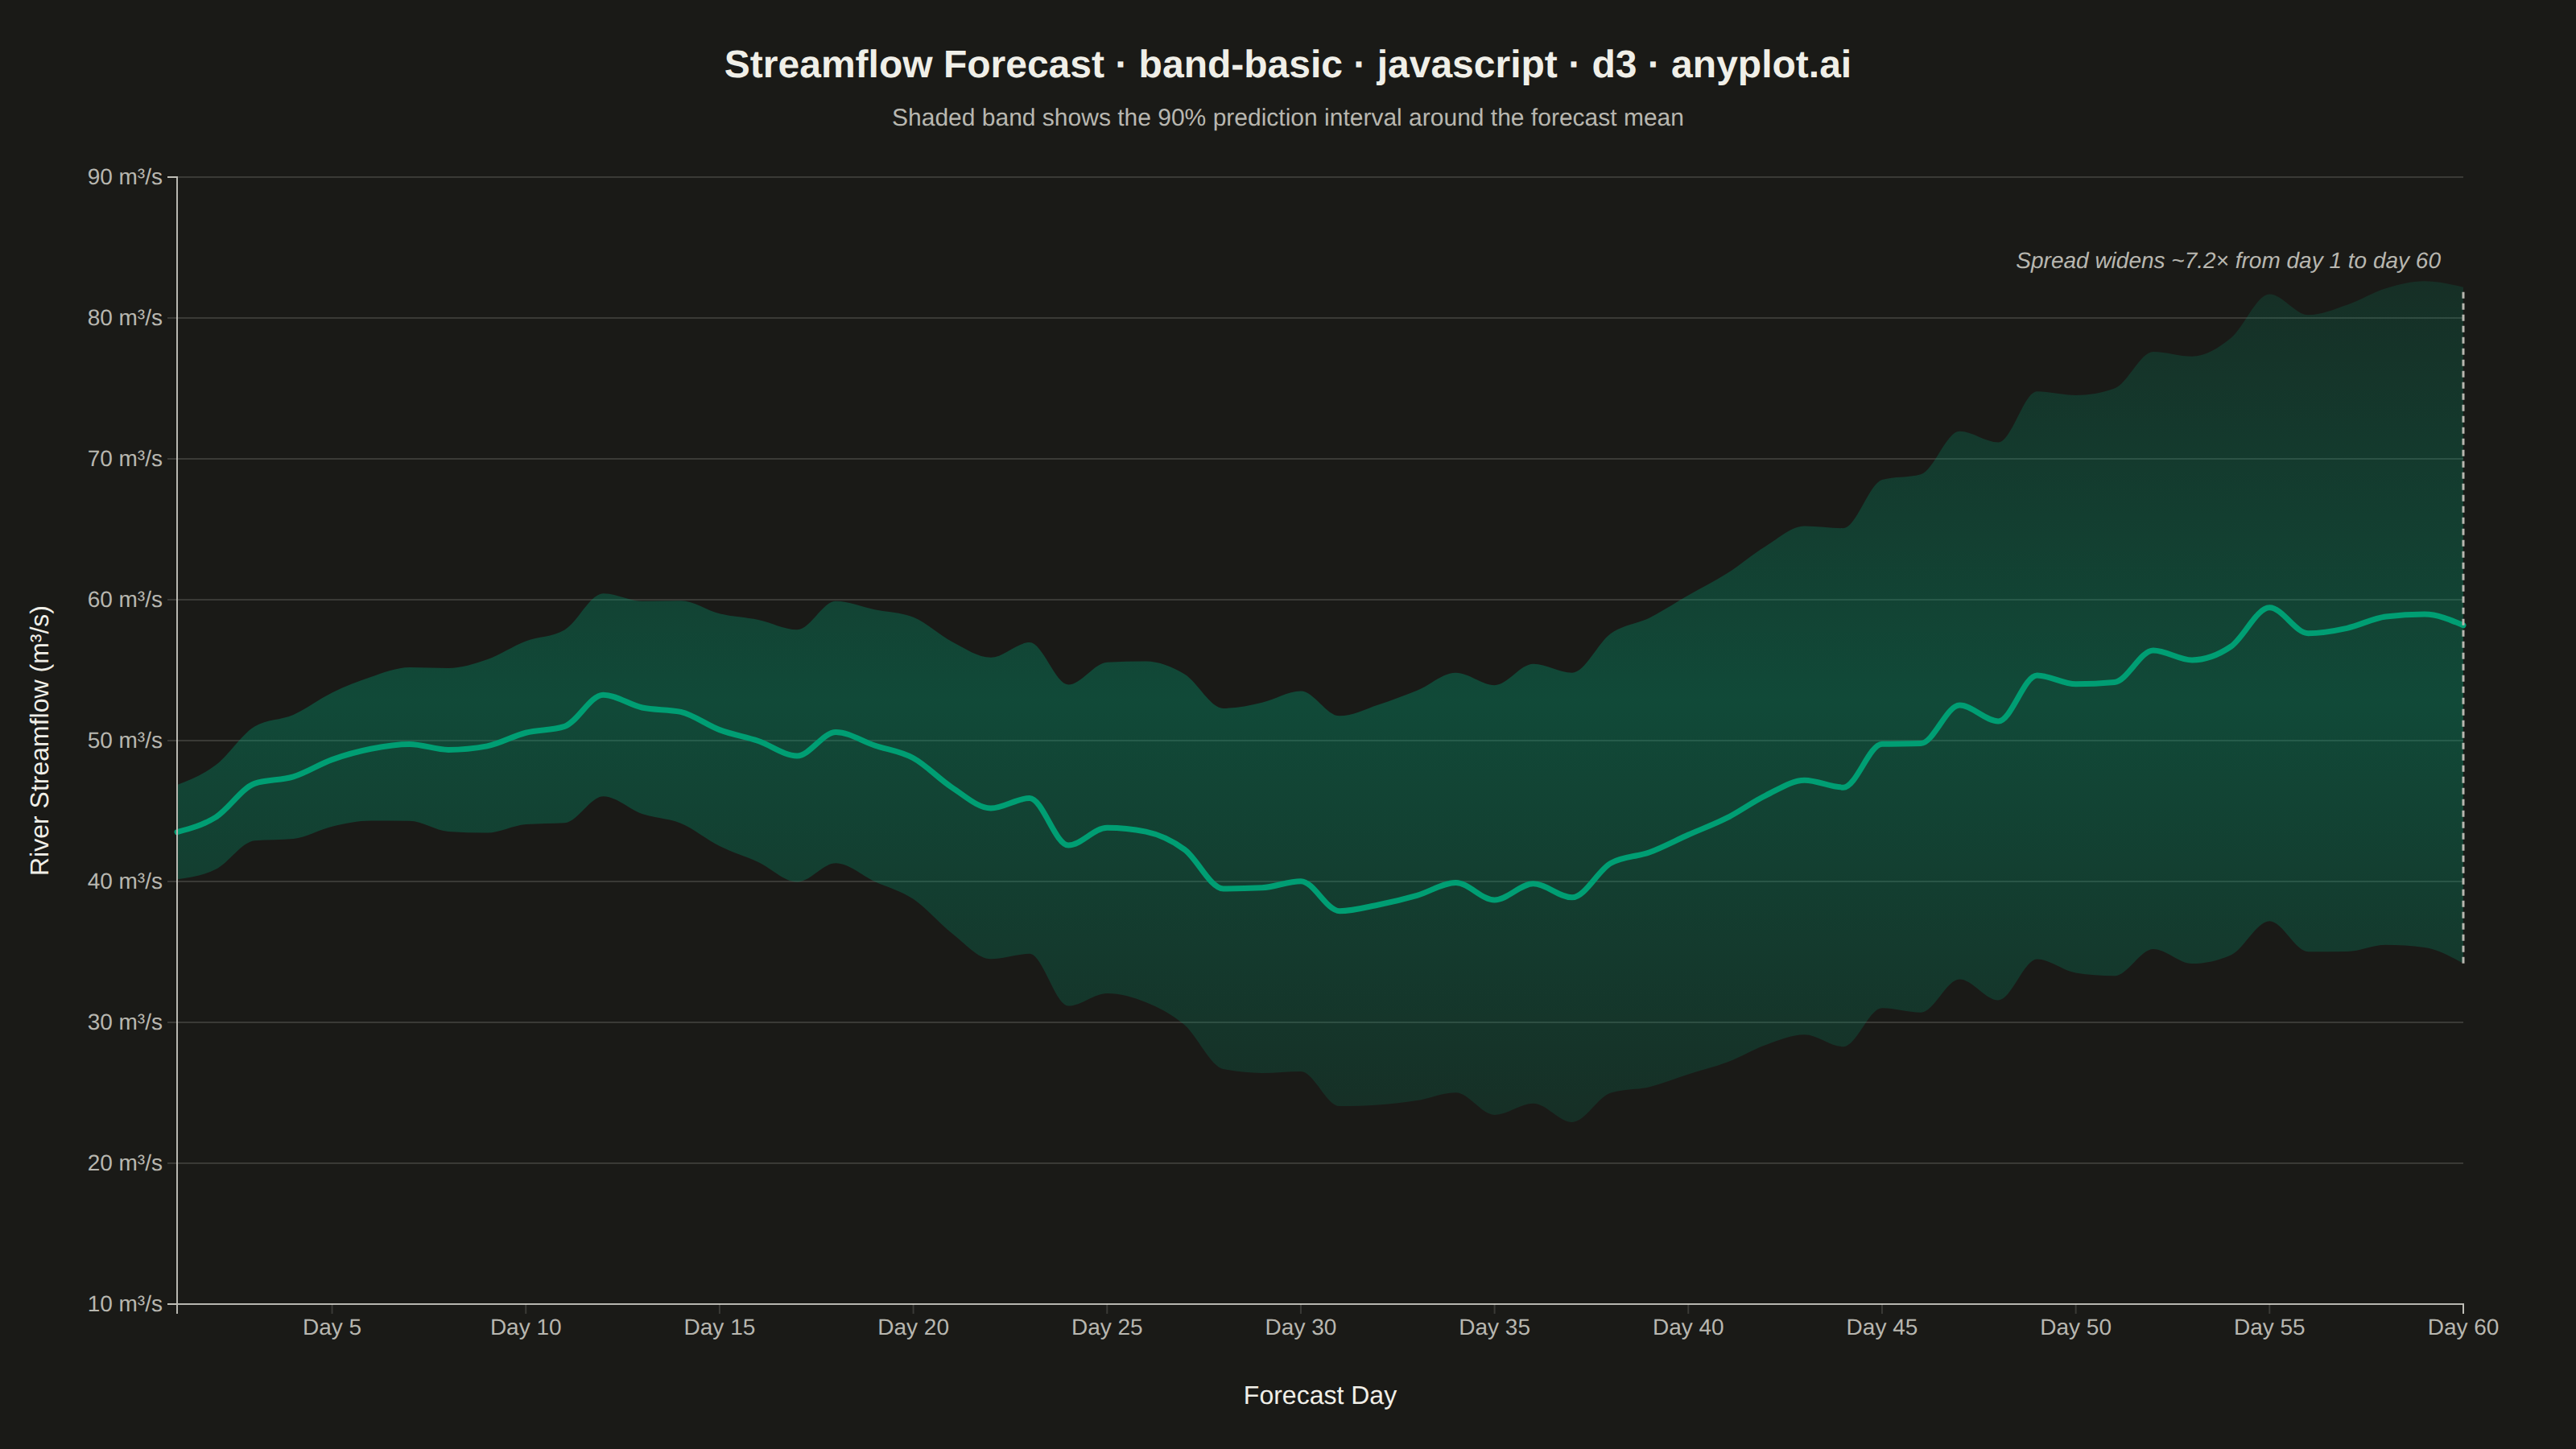
A band plot displays a filled region between two boundary lines, commonly used to show confidence intervals, prediction intervals, or ranges around a central trend line. The semi-transparent band provides visual representation of uncertainty or variability while maintaining visibility of underlying data or overlapping elements.
// anyplot.ai
// band-basic: Basic Band Plot
// Library: d3 7.9.0 | JavaScript 22.23.2
// Quality: 94/100 | Created: 2026-08-24

const t = window.ANYPLOT_TOKENS;
const { width, height } = window.ANYPLOT_SIZE;
const margin = { top: 110, right: 70, bottom: 90, left: 110 };
const iw = width - margin.left - margin.right;
const ih = height - margin.top - margin.bottom;

// --- Data: 60-day streamflow forecast with a widening 90% prediction band --
// Deterministic LCG so the "uncertainty" wiggle is reproducible without Math.random().
let seed = 42;
function lcg() {
  seed = (seed * 1103515245 + 12345) % 2147483648;
  return seed / 2147483648;
}

const days = 60;
const data = Array.from({ length: days }, (_, i) => {
  const day = i + 1;
  const seasonal = 8 * Math.sin((2 * Math.PI * day) / 45);
  const trend = 0.15 * day;
  const wiggle = (lcg() - 0.5) * 3;
  const yCenter = 42 + trend + seasonal + wiggle;
  // Forecast uncertainty grows the further out the prediction reaches.
  const spread = 3 + 0.35 * day;
  return { day, yCenter, yLower: yCenter - spread, yUpper: yCenter + spread };
});

// --- SVG mount ---------------------------------------------------------------
const svg = d3.select("#container").append("svg").attr("width", width).attr("height", height);
const g = svg.append("g").attr("transform", `translate(${margin.left},${margin.top})`);

// --- Scales --------------------------------------------------------------------
const x = d3
  .scaleLinear()
  .domain(d3.extent(data, (d) => d.day))
  .range([0, iw]);
const y = d3
  .scaleLinear()
  .domain([d3.min(data, (d) => d.yLower) - 3, d3.max(data, (d) => d.yUpper) + 3])
  .nice()
  .range([ih, 0]);

// --- Gridlines (y-axis only) ---------------------------------------------------
g.append("g")
  .attr("class", "grid")
  .call(d3.axisLeft(y).tickSize(-iw).tickFormat(""))
  .call((sel) => sel.select(".domain").remove())
  .selectAll("line")
  .attr("stroke", t.grid);

// --- Band (semi-transparent prediction interval, soft vertical gradient) -------
// A single-hue gradient (still built only from t.palette[0]) that fades from the
// band's outer edges toward its vertical middle, echoing the center trend line.
const bandGradient = svg
  .append("defs")
  .append("linearGradient")
  .attr("id", "bandGradient")
  .attr("x1", "0")
  .attr("x2", "0")
  .attr("y1", "0")
  .attr("y2", "1");
bandGradient.append("stop").attr("offset", "0%").attr("stop-color", t.palette[0]).attr("stop-opacity", 0.16);
bandGradient.append("stop").attr("offset", "50%").attr("stop-color", t.palette[0]).attr("stop-opacity", 0.36);
bandGradient.append("stop").attr("offset", "100%").attr("stop-color", t.palette[0]).attr("stop-opacity", 0.16);

const area = d3
  .area()
  .x((d) => x(d.day))
  .y0((d) => y(d.yLower))
  .y1((d) => y(d.yUpper))
  .curve(d3.curveMonotoneX);

g.append("path").datum(data).attr("d", area).attr("fill", "url(#bandGradient)").attr("stroke", "none");

// --- Center trend line -----------------------------------------------------------
const line = d3
  .line()
  .x((d) => x(d.day))
  .y((d) => y(d.yCenter))
  .curve(d3.curveMonotoneX);

g.append("path")
  .datum(data)
  .attr("d", line)
  .attr("fill", "none")
  .attr("stroke", t.palette[0])
  .attr("stroke-width", 3.5)
  .attr("stroke-linejoin", "round")
  .attr("stroke-linecap", "round");

// --- Insight annotation: the forecast band widens sharply with lead time -------
const first = data[0];
const last = data[data.length - 1];
const widenFactor = (last.yUpper - last.yLower) / (first.yUpper - first.yLower);
g.append("line")
  .attr("x1", x(last.day))
  .attr("x2", x(last.day))
  .attr("y1", y(last.yLower))
  .attr("y2", y(last.yUpper))
  .attr("stroke", t.inkSoft)
  .attr("stroke-width", 1.5)
  .attr("stroke-dasharray", "4,3");
g.append("text")
  .attr("x", x(last.day) - 14)
  .attr("y", y(last.yUpper) - 12)
  .attr("text-anchor", "end")
  .attr("fill", t.inkSoft)
  .style("font-size", "14px")
  .style("font-style", "italic")
  .text(`Spread widens ~${widenFactor.toFixed(1)}× from day 1 to day ${last.day}`);

// --- Axes -------------------------------------------------------------------------
const xAxis = g
  .append("g")
  .attr("transform", `translate(0,${ih})`)
  .call(d3.axisBottom(x).ticks(10).tickFormat((d) => `Day ${d}`));
const yAxis = g.append("g").call(d3.axisLeft(y).ticks(8).tickFormat((d) => `${d.toFixed(0)} m³/s`));
for (const ax of [xAxis, yAxis]) {
  ax.selectAll("text").attr("fill", t.inkSoft).style("font-size", "14px");
  ax.selectAll("line").attr("stroke", t.grid);
  ax.select(".domain").attr("stroke", t.inkSoft);
}

// --- Axis labels --------------------------------------------------------------------
g.append("text")
  .attr("x", iw / 2)
  .attr("y", ih + 62)
  .attr("text-anchor", "middle")
  .attr("fill", t.ink)
  .style("font-size", "16px")
  .text("Forecast Day");

g.append("text")
  .attr("transform", "rotate(-90)")
  .attr("x", -ih / 2)
  .attr("y", -80)
  .attr("text-anchor", "middle")
  .attr("fill", t.ink)
  .style("font-size", "16px")
  .text("River Streamflow (m³/s)");

// --- Interactive hover: guide line + day/lower/center/upper readout ------------
// Genuine D3 interactivity for the HTML detail view; hidden by default so the
// static PNG (no synthetic mouse events) is unaffected.
const bisectDay = d3.bisector((d) => d.day).left;
const hoverGroup = g.append("g").style("opacity", 0);
const hoverLine = hoverGroup
  .append("line")
  .attr("y1", 0)
  .attr("y2", ih)
  .attr("stroke", t.inkSoft)
  .attr("stroke-width", 1)
  .attr("stroke-dasharray", "3,3");
const hoverDotLower = hoverGroup.append("circle").attr("r", 4).attr("fill", t.pageBg).attr("stroke", t.palette[0]).attr("stroke-width", 2);
const hoverDotCenter = hoverGroup.append("circle").attr("r", 5).attr("fill", t.palette[0]);
const hoverDotUpper = hoverGroup.append("circle").attr("r", 4).attr("fill", t.pageBg).attr("stroke", t.palette[0]).attr("stroke-width", 2);
const hoverText = hoverGroup.append("text").attr("fill", t.ink).style("font-size", "14px").style("font-weight", "600");

g.append("rect")
  .attr("width", iw)
  .attr("height", ih)
  .attr("fill", "none")
  .attr("pointer-events", "all")
  .on("mousemove", function (event) {
    const [mx] = d3.pointer(event, this);
    const day = x.invert(mx);
    let i = bisectDay(data, day, 1);
    i = Math.min(Math.max(i, 1), data.length - 1);
    const d0 = data[i - 1];
    const d1 = data[i];
    const d = day - d0.day > d1.day - day ? d1 : d0;
    const px = x(d.day);
    const labelOnRight = px < iw - 210;
    const lx = labelOnRight ? px + 14 : px - 14;

    hoverLine.attr("x1", px).attr("x2", px);
    hoverDotLower.attr("cx", px).attr("cy", y(d.yLower));
    hoverDotCenter.attr("cx", px).attr("cy", y(d.yCenter));
    hoverDotUpper.attr("cx", px).attr("cy", y(d.yUpper));

    hoverText.selectAll("tspan").remove();
    hoverText.attr("text-anchor", labelOnRight ? "start" : "end");
    [`Day ${d.day}`, `Upper ${d.yUpper.toFixed(1)} m³/s`, `Center ${d.yCenter.toFixed(1)} m³/s`, `Lower ${d.yLower.toFixed(1)} m³/s`].forEach(
      (lineText, idx) => {
        hoverText
          .append("tspan")
          .attr("x", lx)
          .attr("y", 24 + idx * 18)
          .text(lineText);
      }
    );

    hoverGroup.style("opacity", 1);
  })
  .on("mouseleave", () => hoverGroup.style("opacity", 0));

// --- Title ------------------------------------------------------------------------
svg
  .append("text")
  .attr("x", width / 2)
  .attr("y", 48)
  .attr("text-anchor", "middle")
  .attr("fill", t.ink)
  .style("font-size", "24px")
  .style("font-weight", "600")
  .text("Streamflow Forecast · band-basic · javascript · d3 · anyplot.ai");

svg
  .append("text")
  .attr("x", width / 2)
  .attr("y", 78)
  .attr("text-anchor", "middle")
  .attr("fill", t.inkSoft)
  .style("font-size", "15px")
  .text("Shaded band shows the 90% prediction interval around the forecast mean");
Runnable source as JSON, for any HTTP client: https://api.anyplot.ai/specs/band-basic/d3/code. Any spec id and library id listed in llms-full.txt fit the same URL shape; every URL below is complete and callable.
{
  "spec_id": "band-basic",
  "language": "javascript",
  "library": "d3",
  "page": "https://anyplot.ai/band-basic/javascript/d3",
  "hub": "https://anyplot.ai/band-basic",
  "code_json": "https://api.anyplot.ai/specs/band-basic/d3/code",
  "spec_json": "https://api.anyplot.ai/specs/band-basic",
  "render_light_png": "https://storage.googleapis.com/anyplot-images/plots/band-basic/javascript/d3/plot-light.png",
  "render_dark_png": "https://storage.googleapis.com/anyplot-images/plots/band-basic/javascript/d3/plot-dark.png",
  "interactive_light_html": "https://storage.googleapis.com/anyplot-images/plots/band-basic/javascript/d3/plot-light.html",
  "interactive_dark_html": "https://storage.googleapis.com/anyplot-images/plots/band-basic/javascript/d3/plot-dark.html",
  "quality_score": 94.0,
  "license": "MIT",
  "guide": "https://anyplot.ai/llms.txt"
}
Part of Basic Band Plot on anyplot.ai.