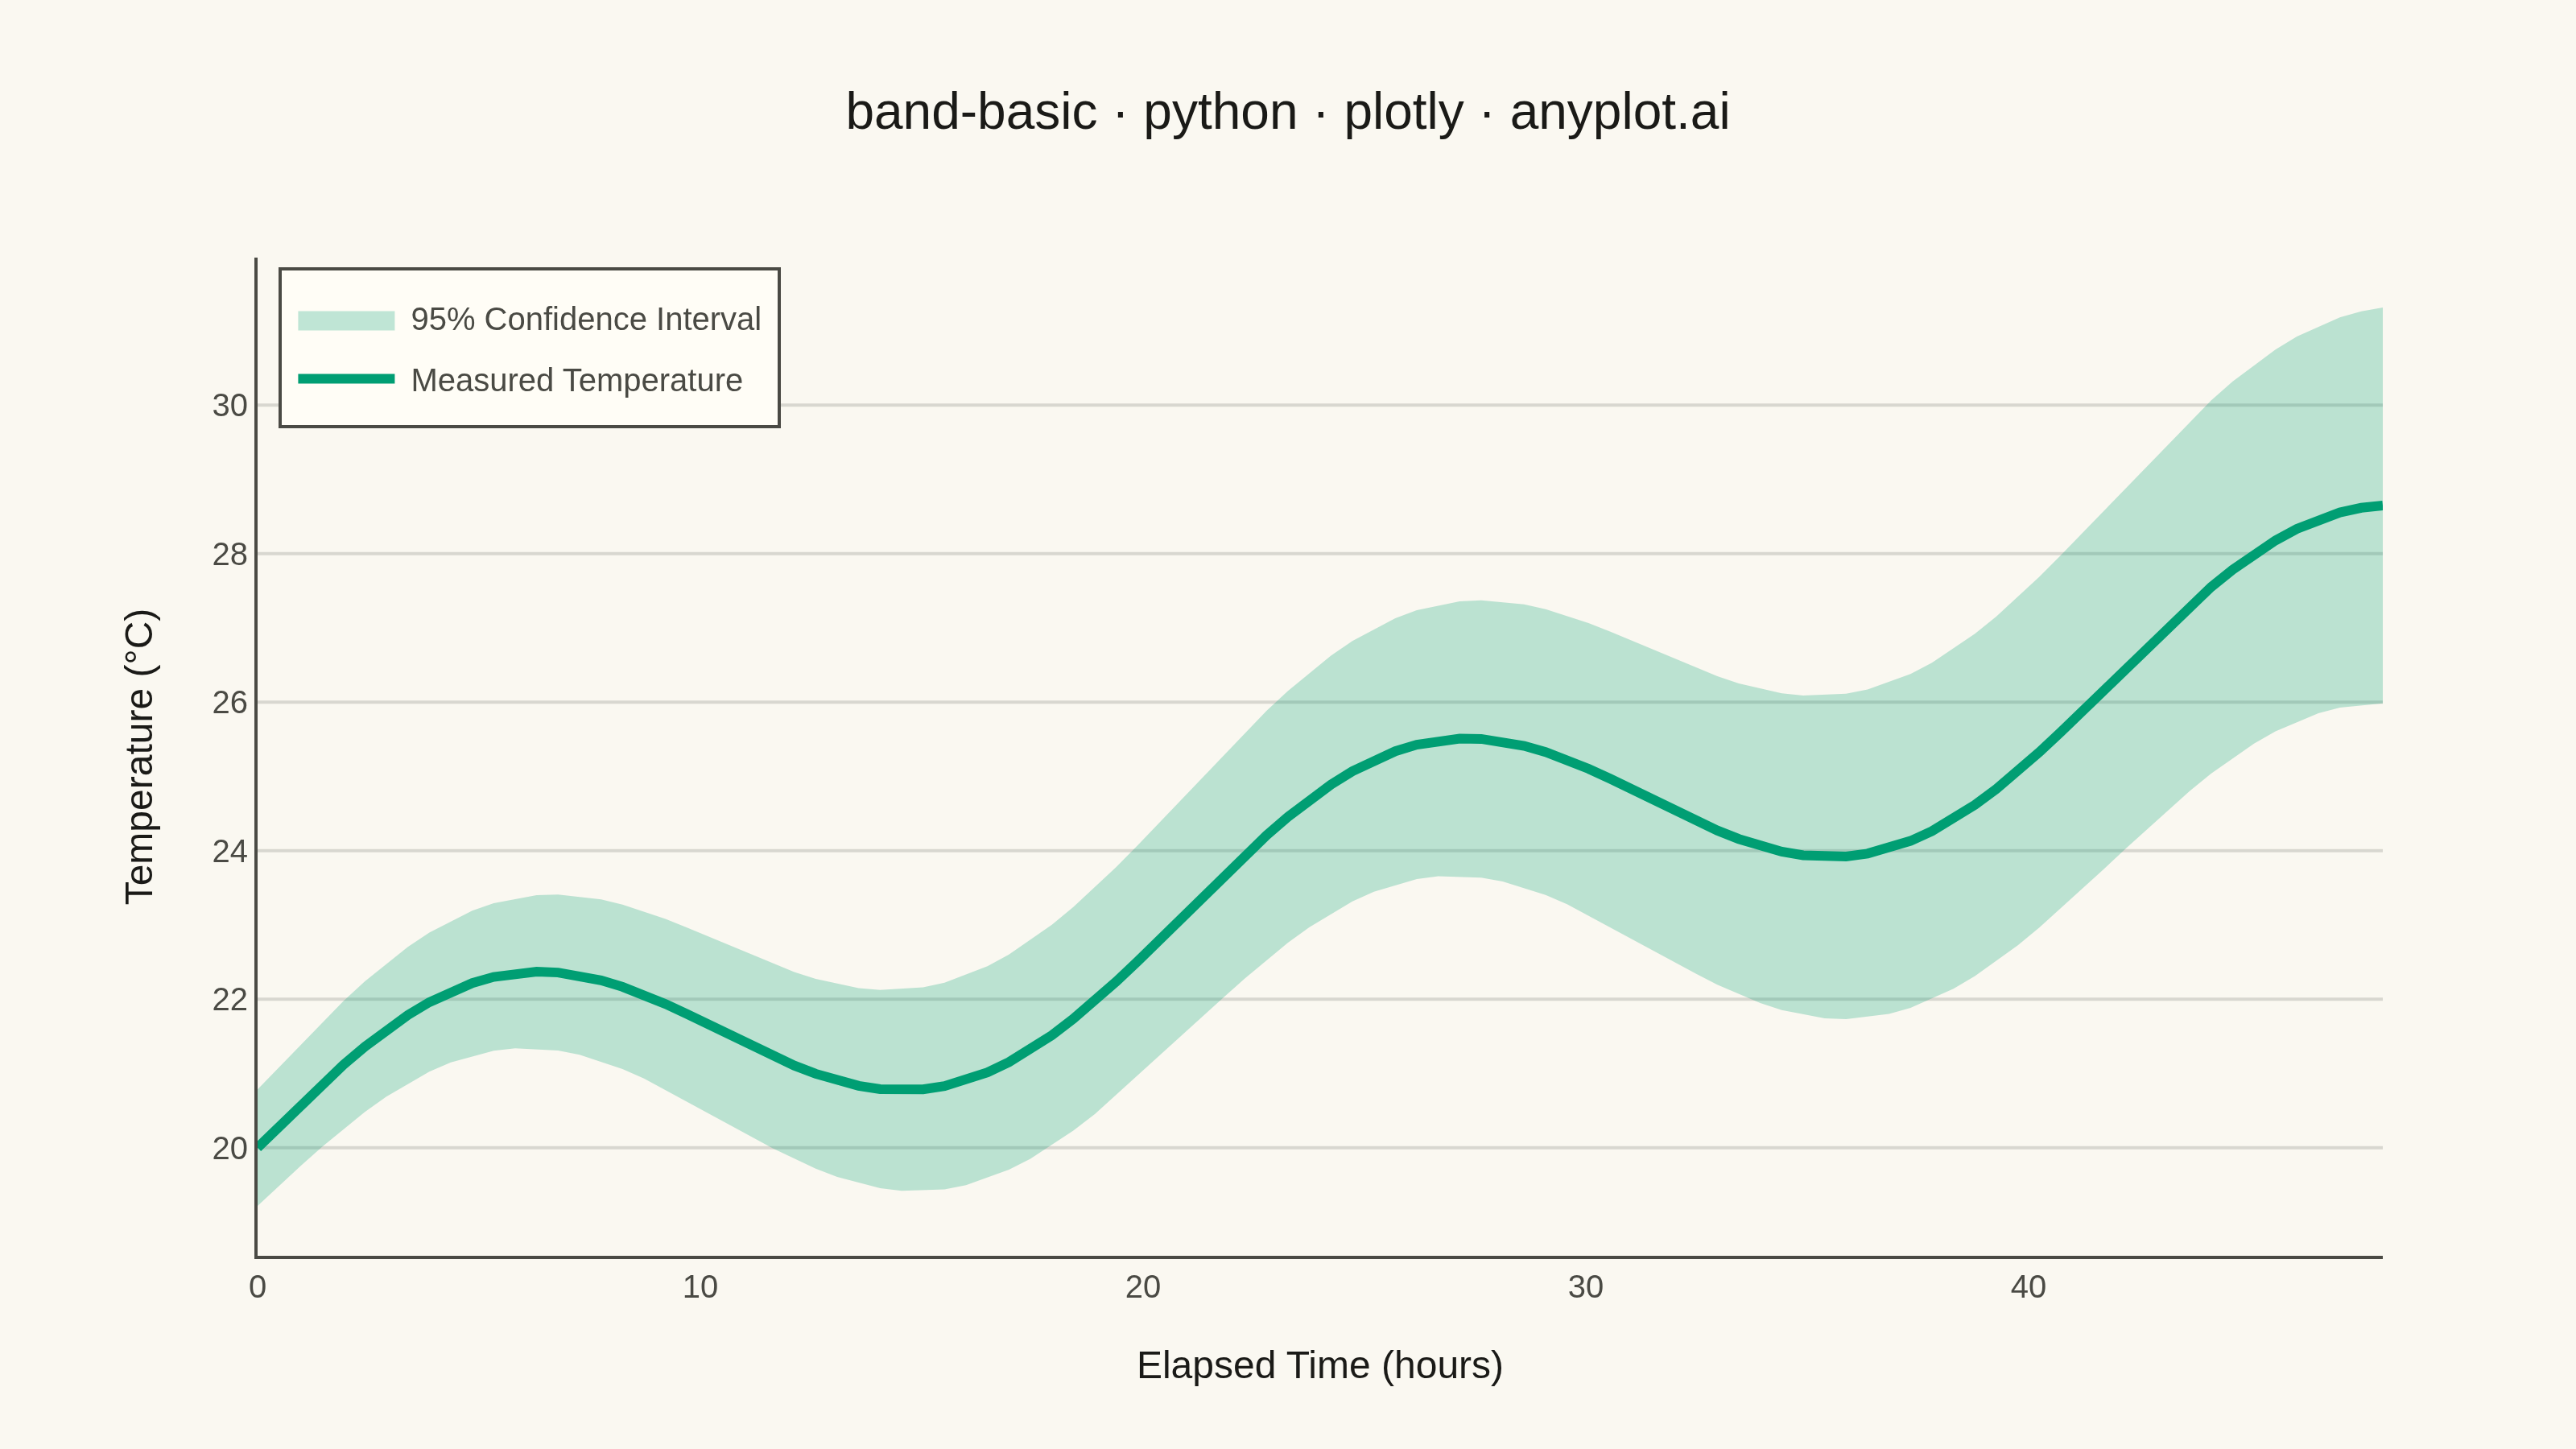
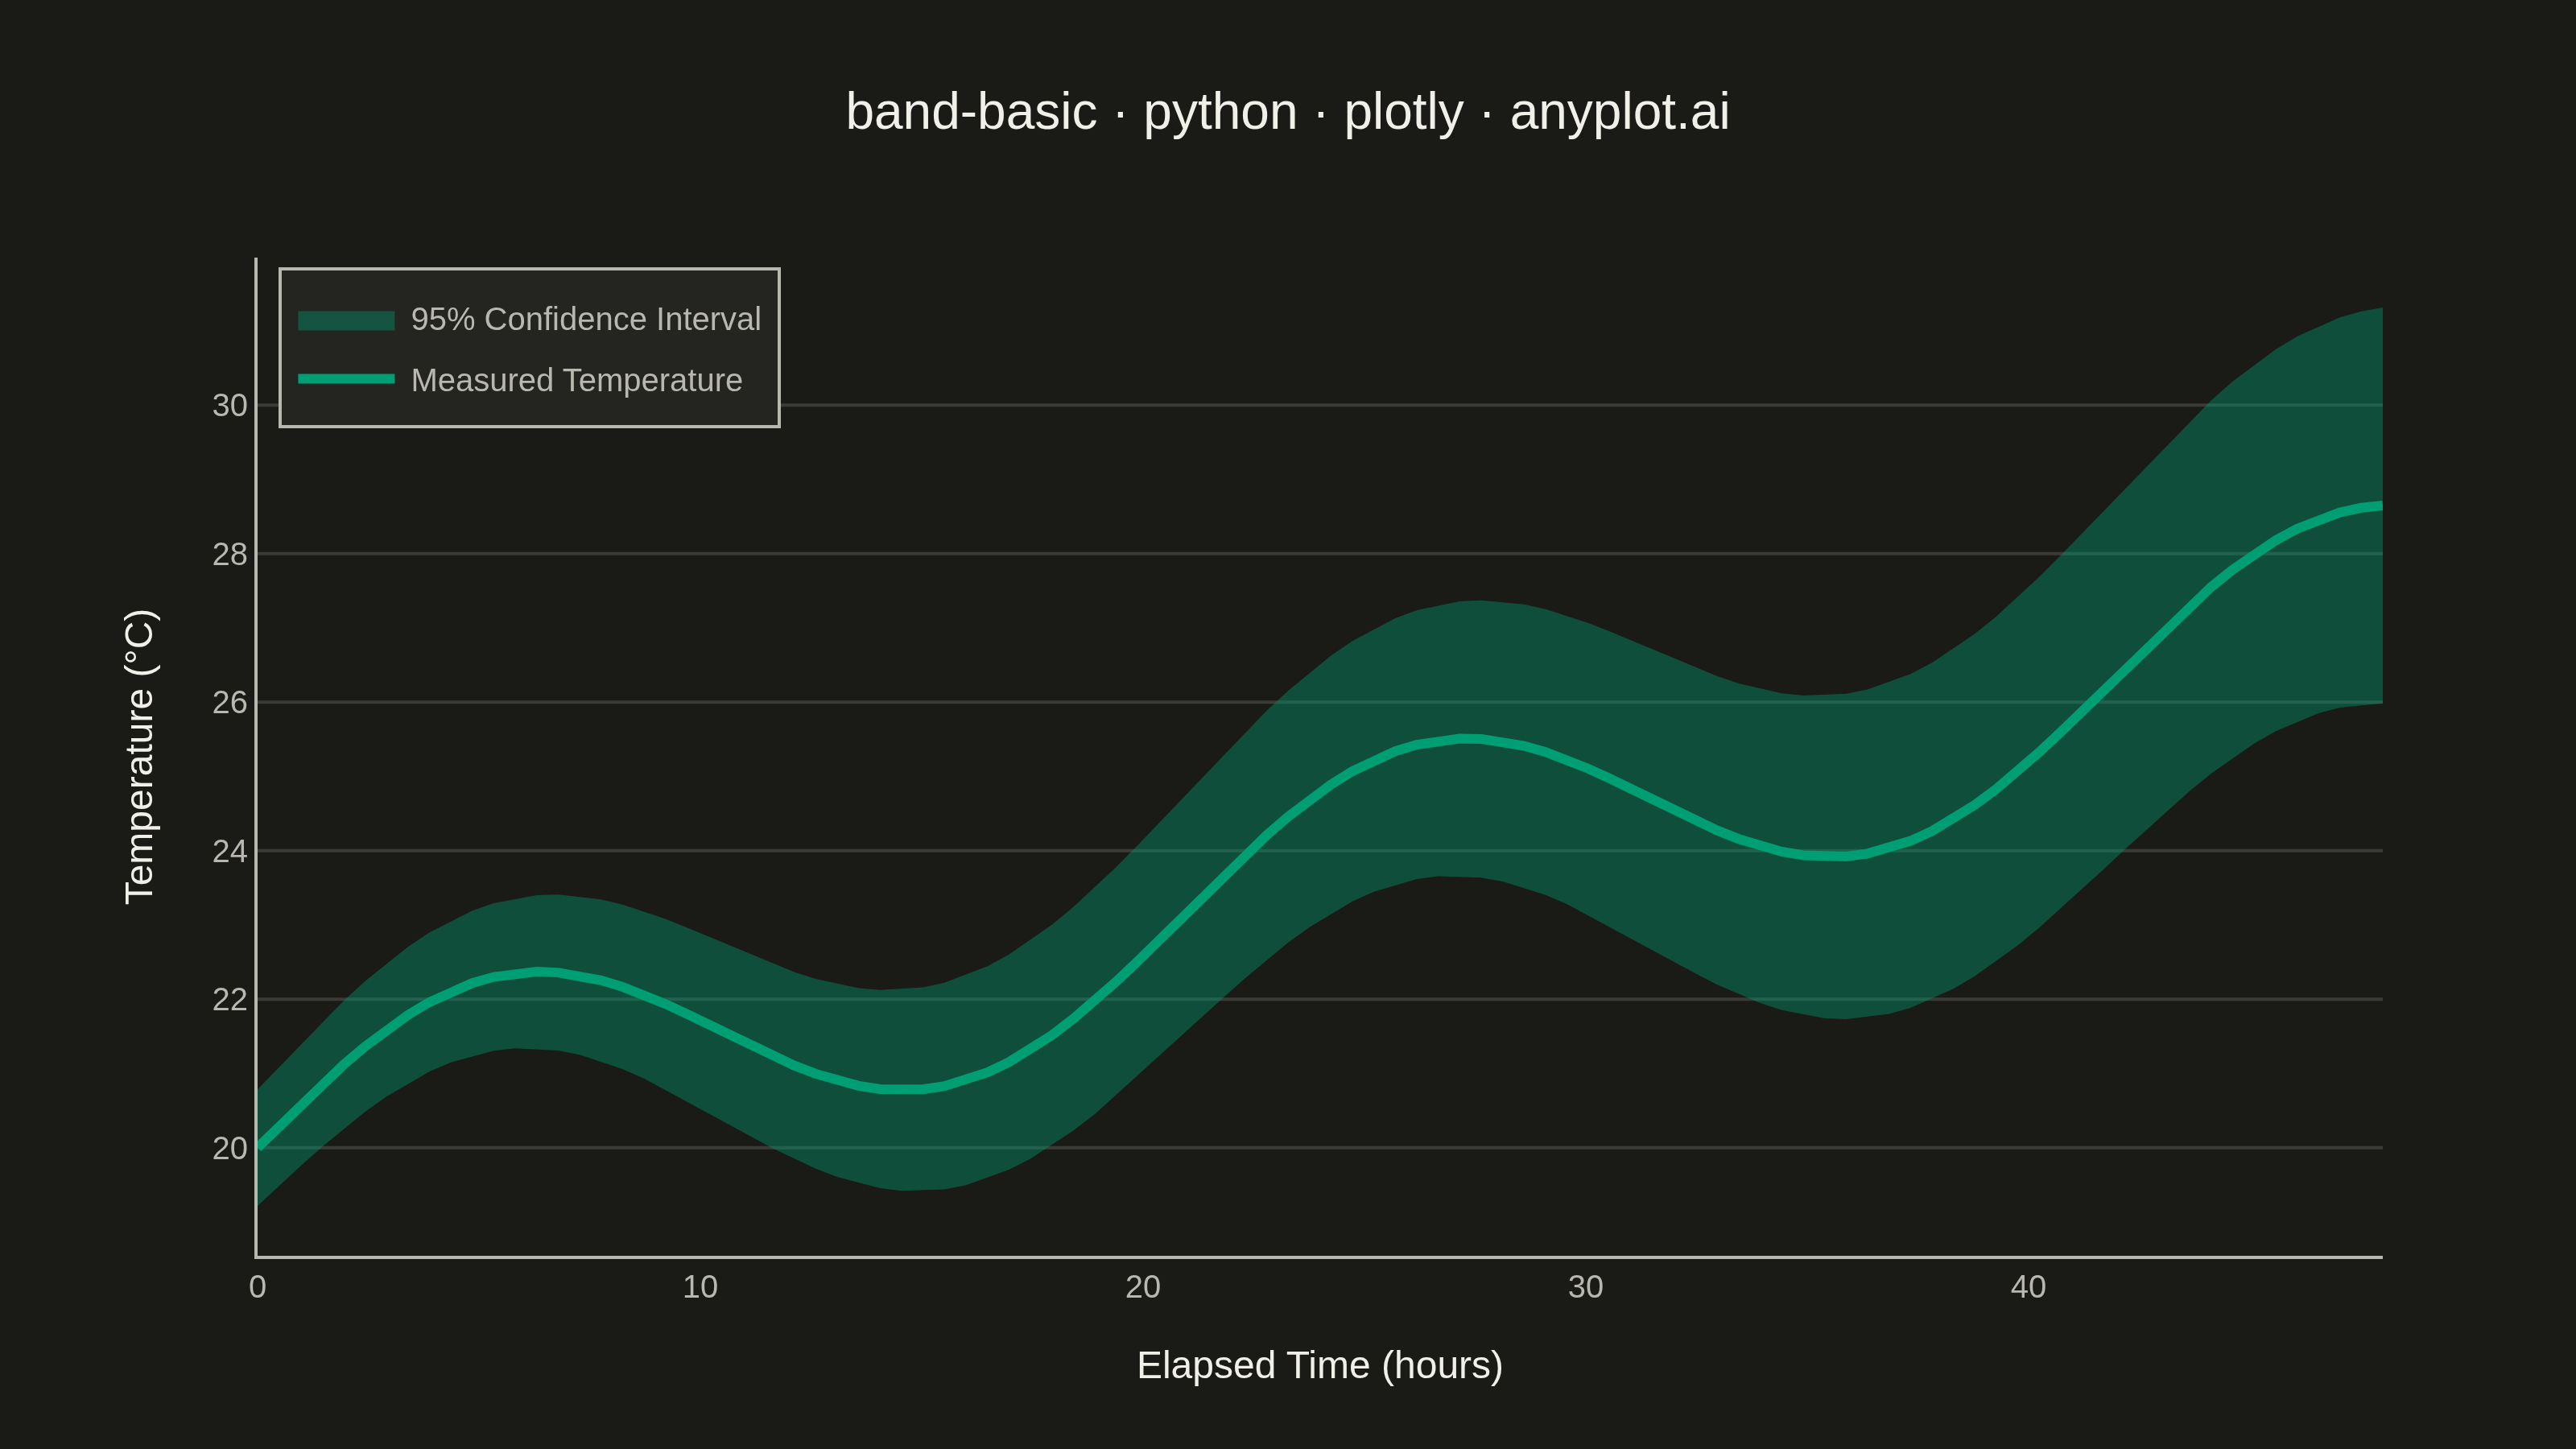
A band plot displays a filled region between two boundary lines, commonly used to show confidence intervals, prediction intervals, or ranges around a central trend line. The semi-transparent band provides visual representation of uncertainty or variability while maintaining visibility of underlying data or overlapping elements.
""" anyplot.ai
band-basic: Basic Band Plot
Library: plotly 6.7.0 | Python 3.13.13
Quality: 87/100 | Updated: 2026-05-29
"""

import os
import sys


# Prevent this file's directory from shadowing the installed plotly package.
# When Python runs "python plotly.py" it inserts the script's directory as
# sys.path[0], which causes "import plotly" to resolve to this file itself.
_impl_dir = os.path.dirname(os.path.abspath(__file__))
sys.path = [p for p in sys.path if p != "" and os.path.normpath(p) != os.path.normpath(_impl_dir)]
del _impl_dir

import numpy as np
import plotly.graph_objects as go


# Theme tokens (Imprint palette — see prompts/default-style-guide.md)
THEME = os.getenv("ANYPLOT_THEME", "light")
PAGE_BG = "#FAF8F1" if THEME == "light" else "#1A1A17"
ELEVATED_BG = "#FFFDF6" if THEME == "light" else "#242420"
INK = "#1A1A17" if THEME == "light" else "#F0EFE8"
INK_SOFT = "#4A4A44" if THEME == "light" else "#B8B7B0"
GRID = "rgba(26,26,23,0.15)" if THEME == "light" else "rgba(240,239,232,0.15)"
BRAND = "#009E73"  # Imprint palette position 1 — ALWAYS first series
BAND_FILL = "rgba(0,158,115,0.25)" if THEME == "light" else "rgba(0,158,115,0.4)"

# Data
hours = np.linspace(0, 48, 100)
# Sensor temperature reading with slight oscillation
temperature = 20 + 0.15 * hours + 1.5 * np.sin(hours * 0.3)
# Measurement uncertainty grows over time (sensor drift)
uncertainty = 0.4 + 0.02 * hours
temp_lower = temperature - 1.96 * uncertainty
temp_upper = temperature + 1.96 * uncertainty

# Plot
fig = go.Figure()

# Band (fill between lower and upper bounds using concat/toself pattern)
fig.add_trace(
    go.Scatter(
        x=np.concatenate([hours, hours[::-1]]),
        y=np.concatenate([temp_upper, temp_lower[::-1]]),
        fill="toself",
        fillcolor=BAND_FILL,
        line={"width": 0},
        hoverinfo="skip",
        showlegend=True,
        name="95% Confidence Interval",
    )
)

# Central trend line with custom hover showing confidence bounds
fig.add_trace(
    go.Scatter(
        x=hours,
        y=temperature,
        mode="lines",
        line={"color": BRAND, "width": 3},
        name="Measured Temperature",
        customdata=np.stack([temp_lower, temp_upper], axis=-1),
        hovertemplate=(
            "<b>Hour:</b> %{x:.1f} h<br>"
            "<b>Temp:</b> %{y:.1f} °C<br>"
            "<b>CI:</b> [%{customdata[0]:.1f}, %{customdata[1]:.1f}] °C"
            "<extra></extra>"
        ),
    )
)

title = "band-basic · python · plotly · anyplot.ai"

# Layout
fig.update_layout(
    autosize=False,
    paper_bgcolor=PAGE_BG,
    plot_bgcolor=PAGE_BG,
    font={"color": INK},
    title={"text": title, "font": {"size": 16, "color": INK}, "x": 0.5, "xanchor": "center"},
    xaxis={
        "title": {"text": "Elapsed Time (hours)", "font": {"size": 12, "color": INK}},
        "tickfont": {"size": 10, "color": INK_SOFT},
        "gridcolor": GRID,
        "gridwidth": 1,
        "zeroline": False,
        "linecolor": INK_SOFT,
        "showline": True,
        "mirror": False,
        "showgrid": False,
    },
    yaxis={
        "title": {"text": "Temperature (°C)", "font": {"size": 12, "color": INK}},
        "tickfont": {"size": 10, "color": INK_SOFT},
        "gridcolor": GRID,
        "gridwidth": 1,
        "zeroline": False,
        "linecolor": INK_SOFT,
        "showline": True,
        "mirror": False,
        "showgrid": True,
    },
    legend={
        "bgcolor": ELEVATED_BG,
        "bordercolor": INK_SOFT,
        "borderwidth": 1,
        "font": {"size": 10, "color": INK_SOFT},
        "yanchor": "top",
        "y": 0.99,
        "xanchor": "left",
        "x": 0.01,
    },
    margin={"l": 80, "r": 60, "t": 80, "b": 60},
    hoverlabel={"font": {"size": 14}},
)

# Save
fig.write_image(f"plot-{THEME}.png", width=800, height=450, scale=4)
fig.write_html(f"plot-{THEME}.html", include_plotlyjs="cdn")
Runnable source as JSON, for any HTTP client: https://api.anyplot.ai/specs/band-basic/plotly/code. Any spec id and library id listed in llms-full.txt fit the same URL shape; every URL below is complete and callable.
{
  "spec_id": "band-basic",
  "language": "python",
  "library": "plotly",
  "page": "https://anyplot.ai/band-basic/python/plotly",
  "hub": "https://anyplot.ai/band-basic",
  "code_json": "https://api.anyplot.ai/specs/band-basic/plotly/code",
  "spec_json": "https://api.anyplot.ai/specs/band-basic",
  "render_light_png": "https://storage.googleapis.com/anyplot-images/plots/band-basic/python/plotly/plot-light.png",
  "render_dark_png": "https://storage.googleapis.com/anyplot-images/plots/band-basic/python/plotly/plot-dark.png",
  "interactive_light_html": "https://storage.googleapis.com/anyplot-images/plots/band-basic/python/plotly/plot-light.html",
  "interactive_dark_html": "https://storage.googleapis.com/anyplot-images/plots/band-basic/python/plotly/plot-dark.html",
  "quality_score": 87.0,
  "license": "MIT",
  "guide": "https://anyplot.ai/llms.txt"
}
Part of Basic Band Plot on anyplot.ai.