The same plot in 14 other libraries — JavaScript: D3.js, Apache ECharts, Highcharts, MUI X Charts; Python: Altair, Bokeh, lets-plot, Matplotlib, Plotly, plotnine, Pygal, Seaborn; R: ggplot2; Julia: Makie.jl. Compare all 15 side by side: Bar Chart with Error Bars in Python, R, Julia and JavaScript.
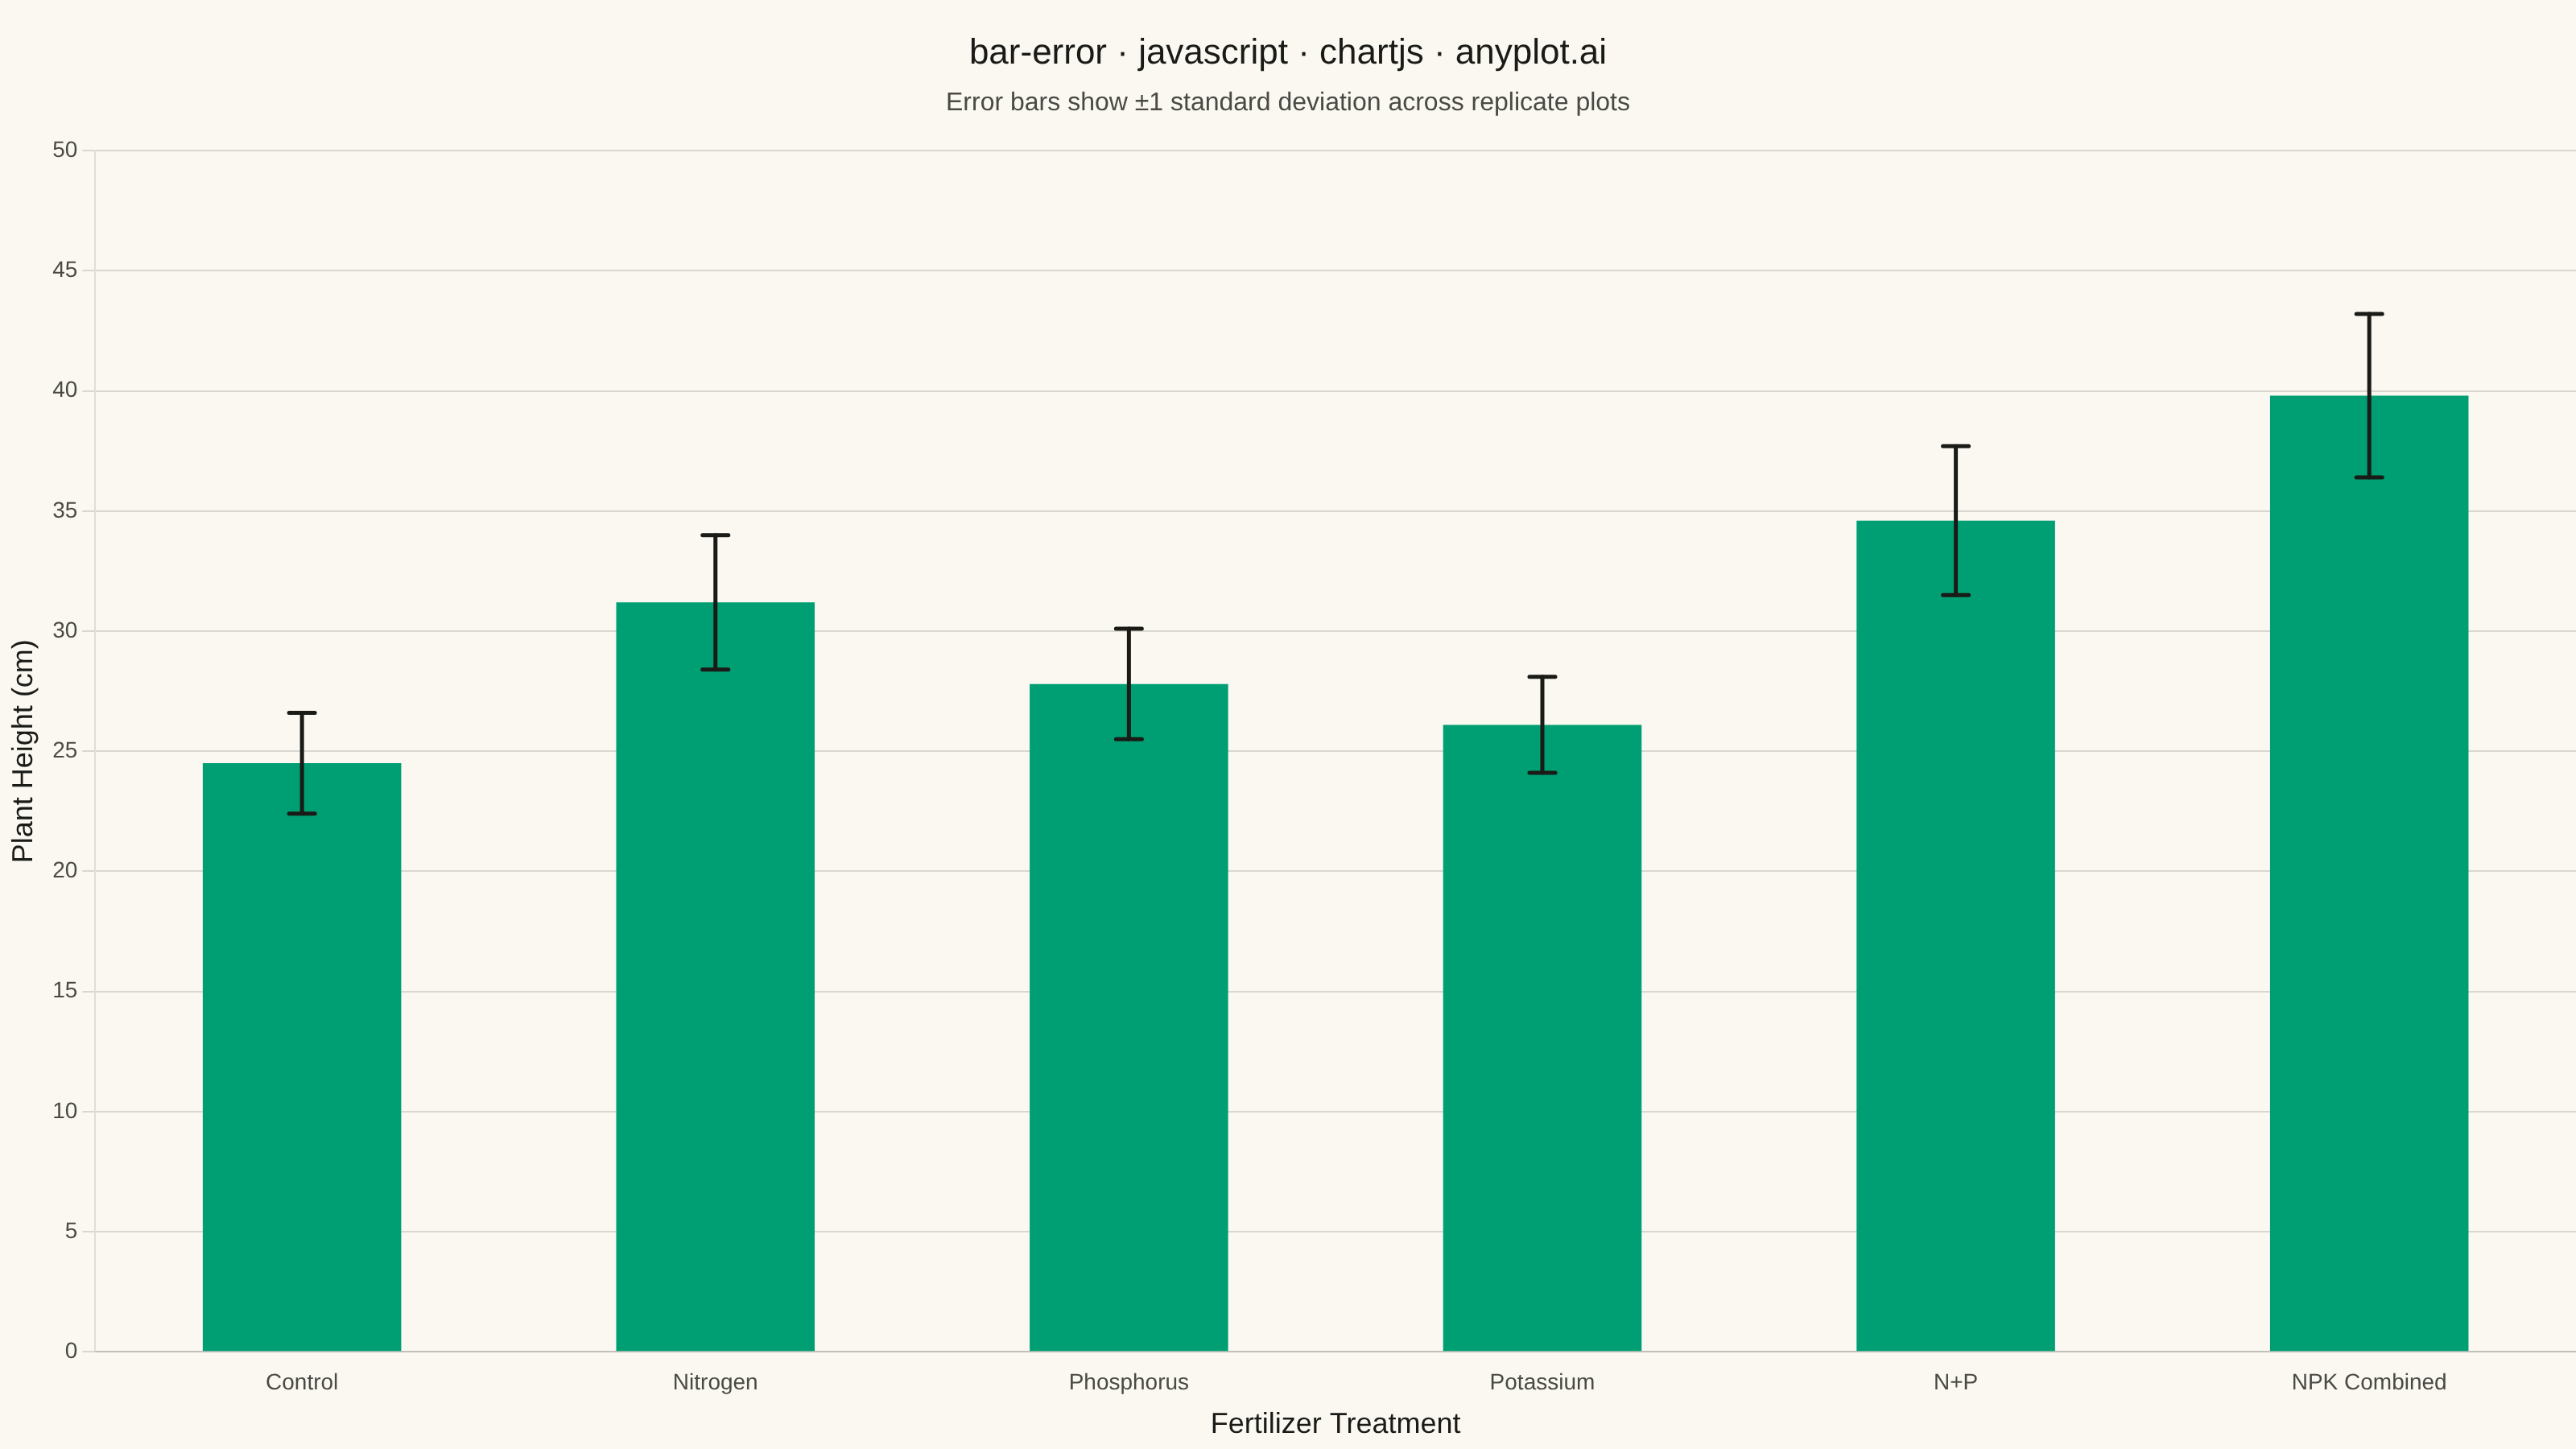
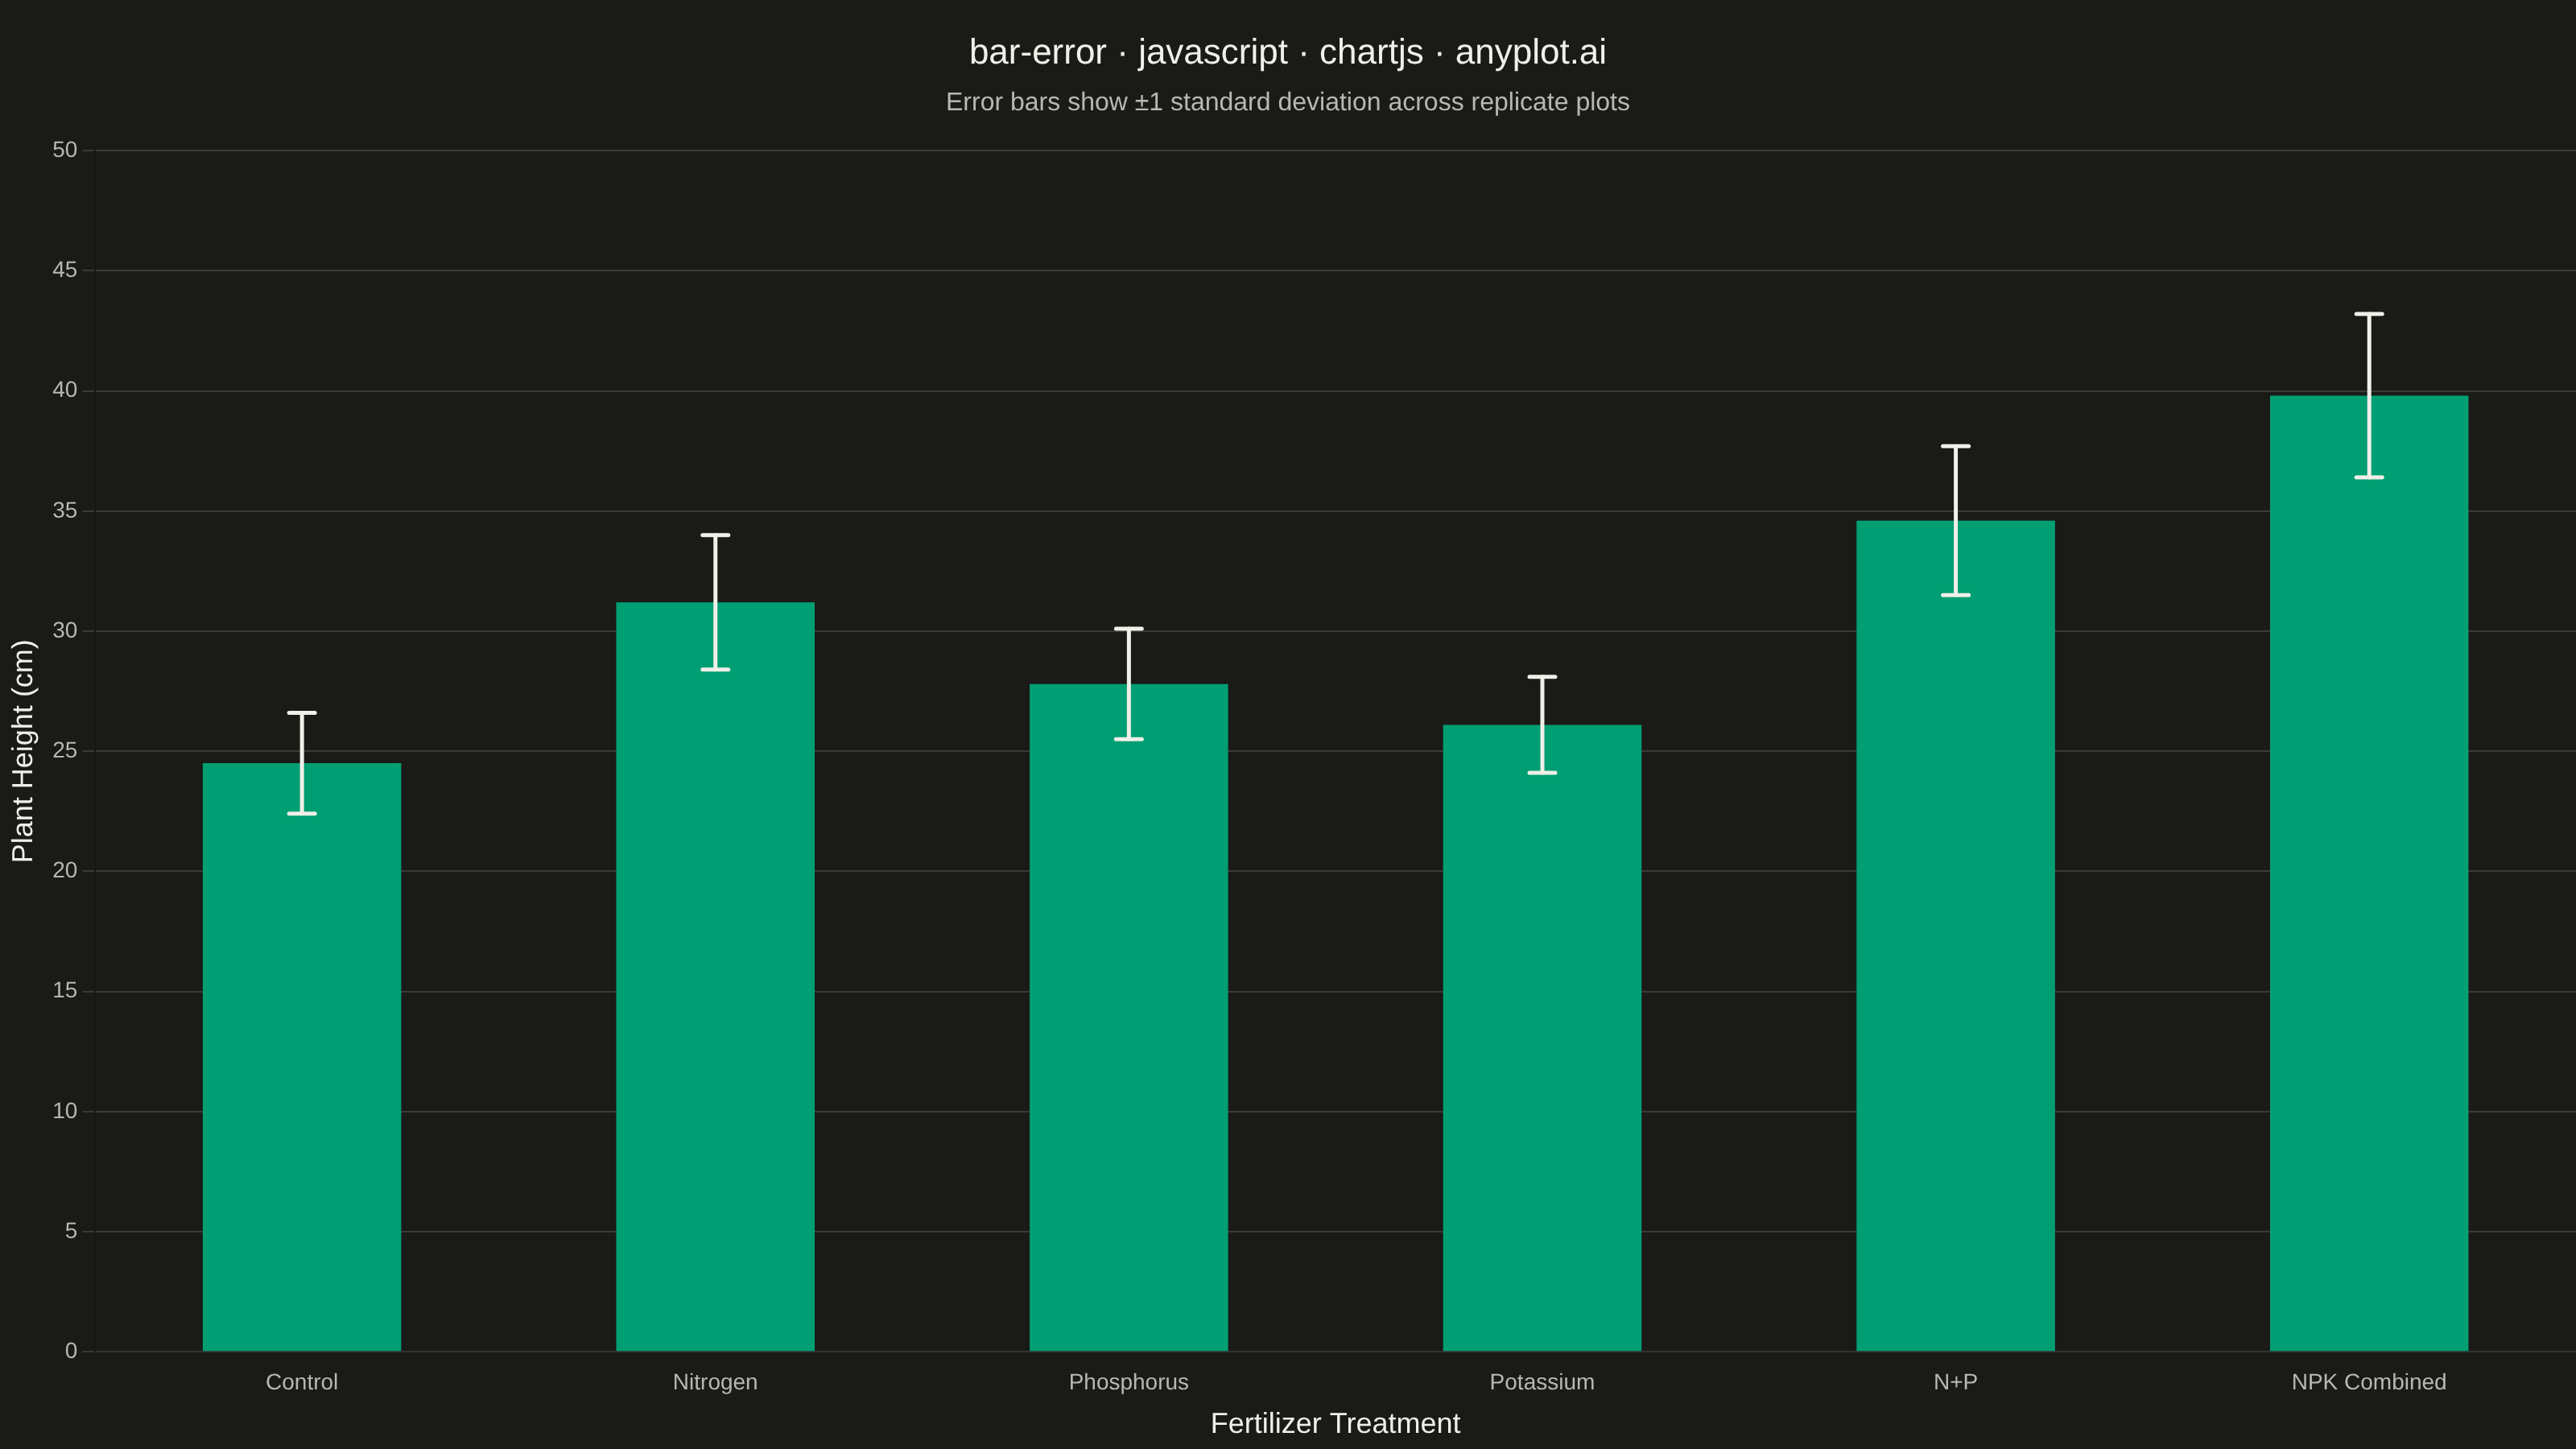
A bar chart with error bars displays categorical data as rectangular bars with vertical (or horizontal) lines extending from each bar to indicate uncertainty or variability. Error bars typically represent standard deviation, standard error, confidence intervals, or min/max ranges. This visualization is essential for comparing group means while communicating the reliability and precision of each measurement.
// anyplot.ai
// bar-error: Bar Chart with Error Bars
// Library: chartjs 4.4.7 | JavaScript 22.23.2
// Quality: 90/100 | Created: 2026-09-02

const t = window.ANYPLOT_TOKENS;

// --- Data (in-memory, deterministic) ---------------------------------------
// Plant height (cm) by fertilizer treatment, error bars show +/-1 SD.
const treatments = ["Control", "Nitrogen", "Phosphorus", "Potassium", "N+P", "NPK Combined"];
const heights = [24.5, 31.2, 27.8, 26.1, 34.6, 39.8];
const stdDevs = [2.1, 2.8, 2.3, 2.0, 3.1, 3.4];

const maxWithError = Math.max(...heights.map((h, i) => h + stdDevs[i]));

// --- Error bar plugin (native Chart.js plugin API, drawn on canvas) --------
const errorBarsPlugin = {
  id: "errorBars",
  afterDatasetsDraw(chart) {
    const { ctx, scales: { y } } = chart;
    const meta = chart.getDatasetMeta(0);
    const capWidth = 16;

    ctx.save();
    ctx.strokeStyle = t.ink;
    ctx.lineWidth = 2.5;
    ctx.lineCap = "round";

    meta.data.forEach((bar, i) => {
      const xCenter = bar.x;
      const yTop = y.getPixelForValue(heights[i] + stdDevs[i]);
      const yBottom = y.getPixelForValue(heights[i] - stdDevs[i]);

      ctx.beginPath();
      ctx.moveTo(xCenter, yTop);
      ctx.lineTo(xCenter, yBottom);
      ctx.stroke();

      ctx.beginPath();
      ctx.moveTo(xCenter - capWidth / 2, yTop);
      ctx.lineTo(xCenter + capWidth / 2, yTop);
      ctx.stroke();

      ctx.beginPath();
      ctx.moveTo(xCenter - capWidth / 2, yBottom);
      ctx.lineTo(xCenter + capWidth / 2, yBottom);
      ctx.stroke();
    });

    ctx.restore();
  },
};

// --- Mount -------------------------------------------------------------------
const canvas = document.createElement("canvas");
document.getElementById("container").appendChild(canvas);

// --- Chart -------------------------------------------------------------------
new Chart(canvas, {
  type: "bar",
  data: {
    labels: treatments,
    datasets: [
      {
        label: "Mean Plant Height",
        data: heights,
        backgroundColor: t.palette[0],
        borderWidth: 0,
        barPercentage: 0.6,
      },
    ],
  },
  plugins: [errorBarsPlugin],
  options: {
    responsive: true,
    maintainAspectRatio: false,
    animation: false,
    layout: { padding: { top: 20 } },
    plugins: {
      title: {
        display: true,
        text: "bar-error · javascript · chartjs · anyplot.ai",
        color: t.ink,
        font: { size: 22, weight: "500" },
        padding: { bottom: 8 },
      },
      subtitle: {
        display: true,
        text: "Error bars show ±1 standard deviation across replicate plots",
        color: t.inkSoft,
        font: { size: 16 },
        padding: { bottom: 20 },
      },
      legend: { display: false },
    },
    scales: {
      x: {
        title: { display: true, text: "Fertilizer Treatment", color: t.ink, font: { size: 18 } },
        ticks: { color: t.inkSoft, font: { size: 14 } },
        grid: { display: false },
      },
      y: {
        beginAtZero: true,
        suggestedMax: Math.ceil(maxWithError * 1.1),
        title: { display: true, text: "Plant Height (cm)", color: t.ink, font: { size: 18 } },
        ticks: { color: t.inkSoft, font: { size: 14 } },
        grid: { color: t.grid },
      },
    },
  },
});
Runnable source as JSON, for any HTTP client: https://api.anyplot.ai/specs/bar-error/chartjs/code. Any spec id and library id listed in llms-full.txt fit the same URL shape; every URL below is complete and callable.
{
  "spec_id": "bar-error",
  "language": "javascript",
  "library": "chartjs",
  "page": "https://anyplot.ai/bar-error/javascript/chartjs",
  "hub": "https://anyplot.ai/bar-error",
  "code_json": "https://api.anyplot.ai/specs/bar-error/chartjs/code",
  "spec_json": "https://api.anyplot.ai/specs/bar-error",
  "render_light_png": "https://storage.googleapis.com/anyplot-images/plots/bar-error/javascript/chartjs/plot-light.png",
  "render_dark_png": "https://storage.googleapis.com/anyplot-images/plots/bar-error/javascript/chartjs/plot-dark.png",
  "interactive_light_html": "https://storage.googleapis.com/anyplot-images/plots/bar-error/javascript/chartjs/plot-light.html",
  "interactive_dark_html": "https://storage.googleapis.com/anyplot-images/plots/bar-error/javascript/chartjs/plot-dark.html",
  "quality_score": 90.0,
  "license": "MIT",
  "guide": "https://anyplot.ai/llms.txt"
}
Part of Bar Chart with Error Bars on anyplot.ai.