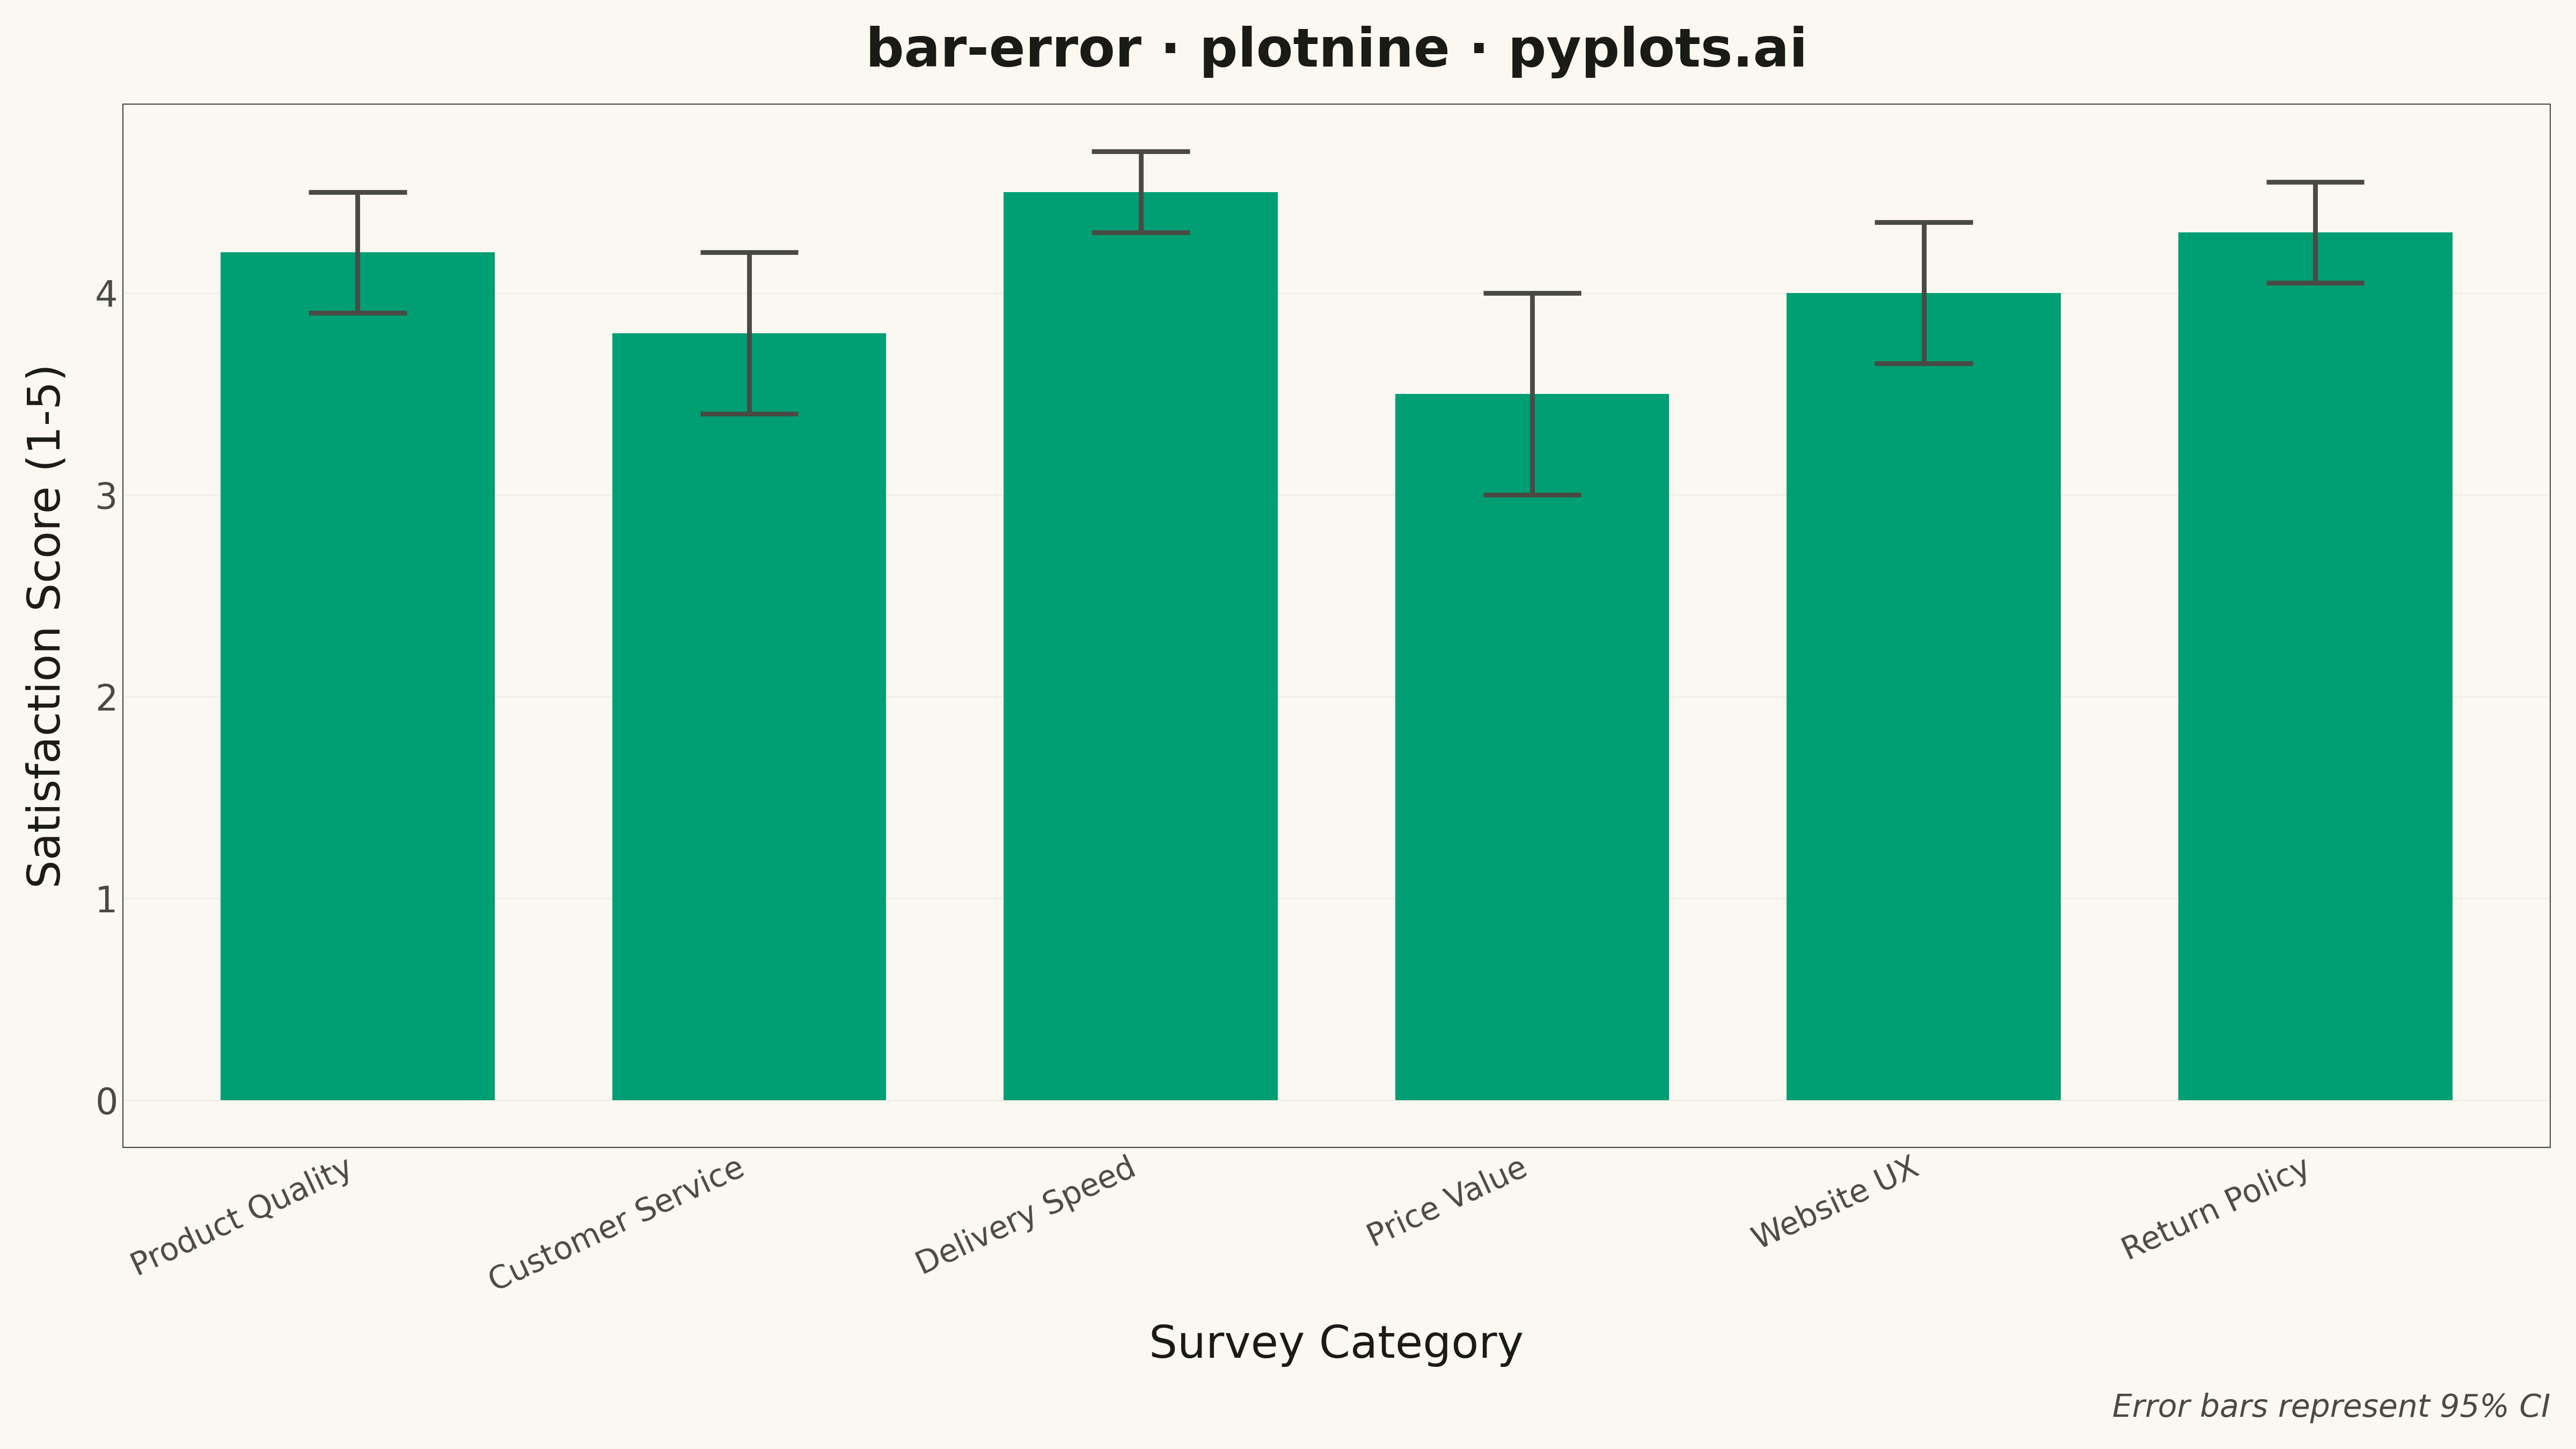
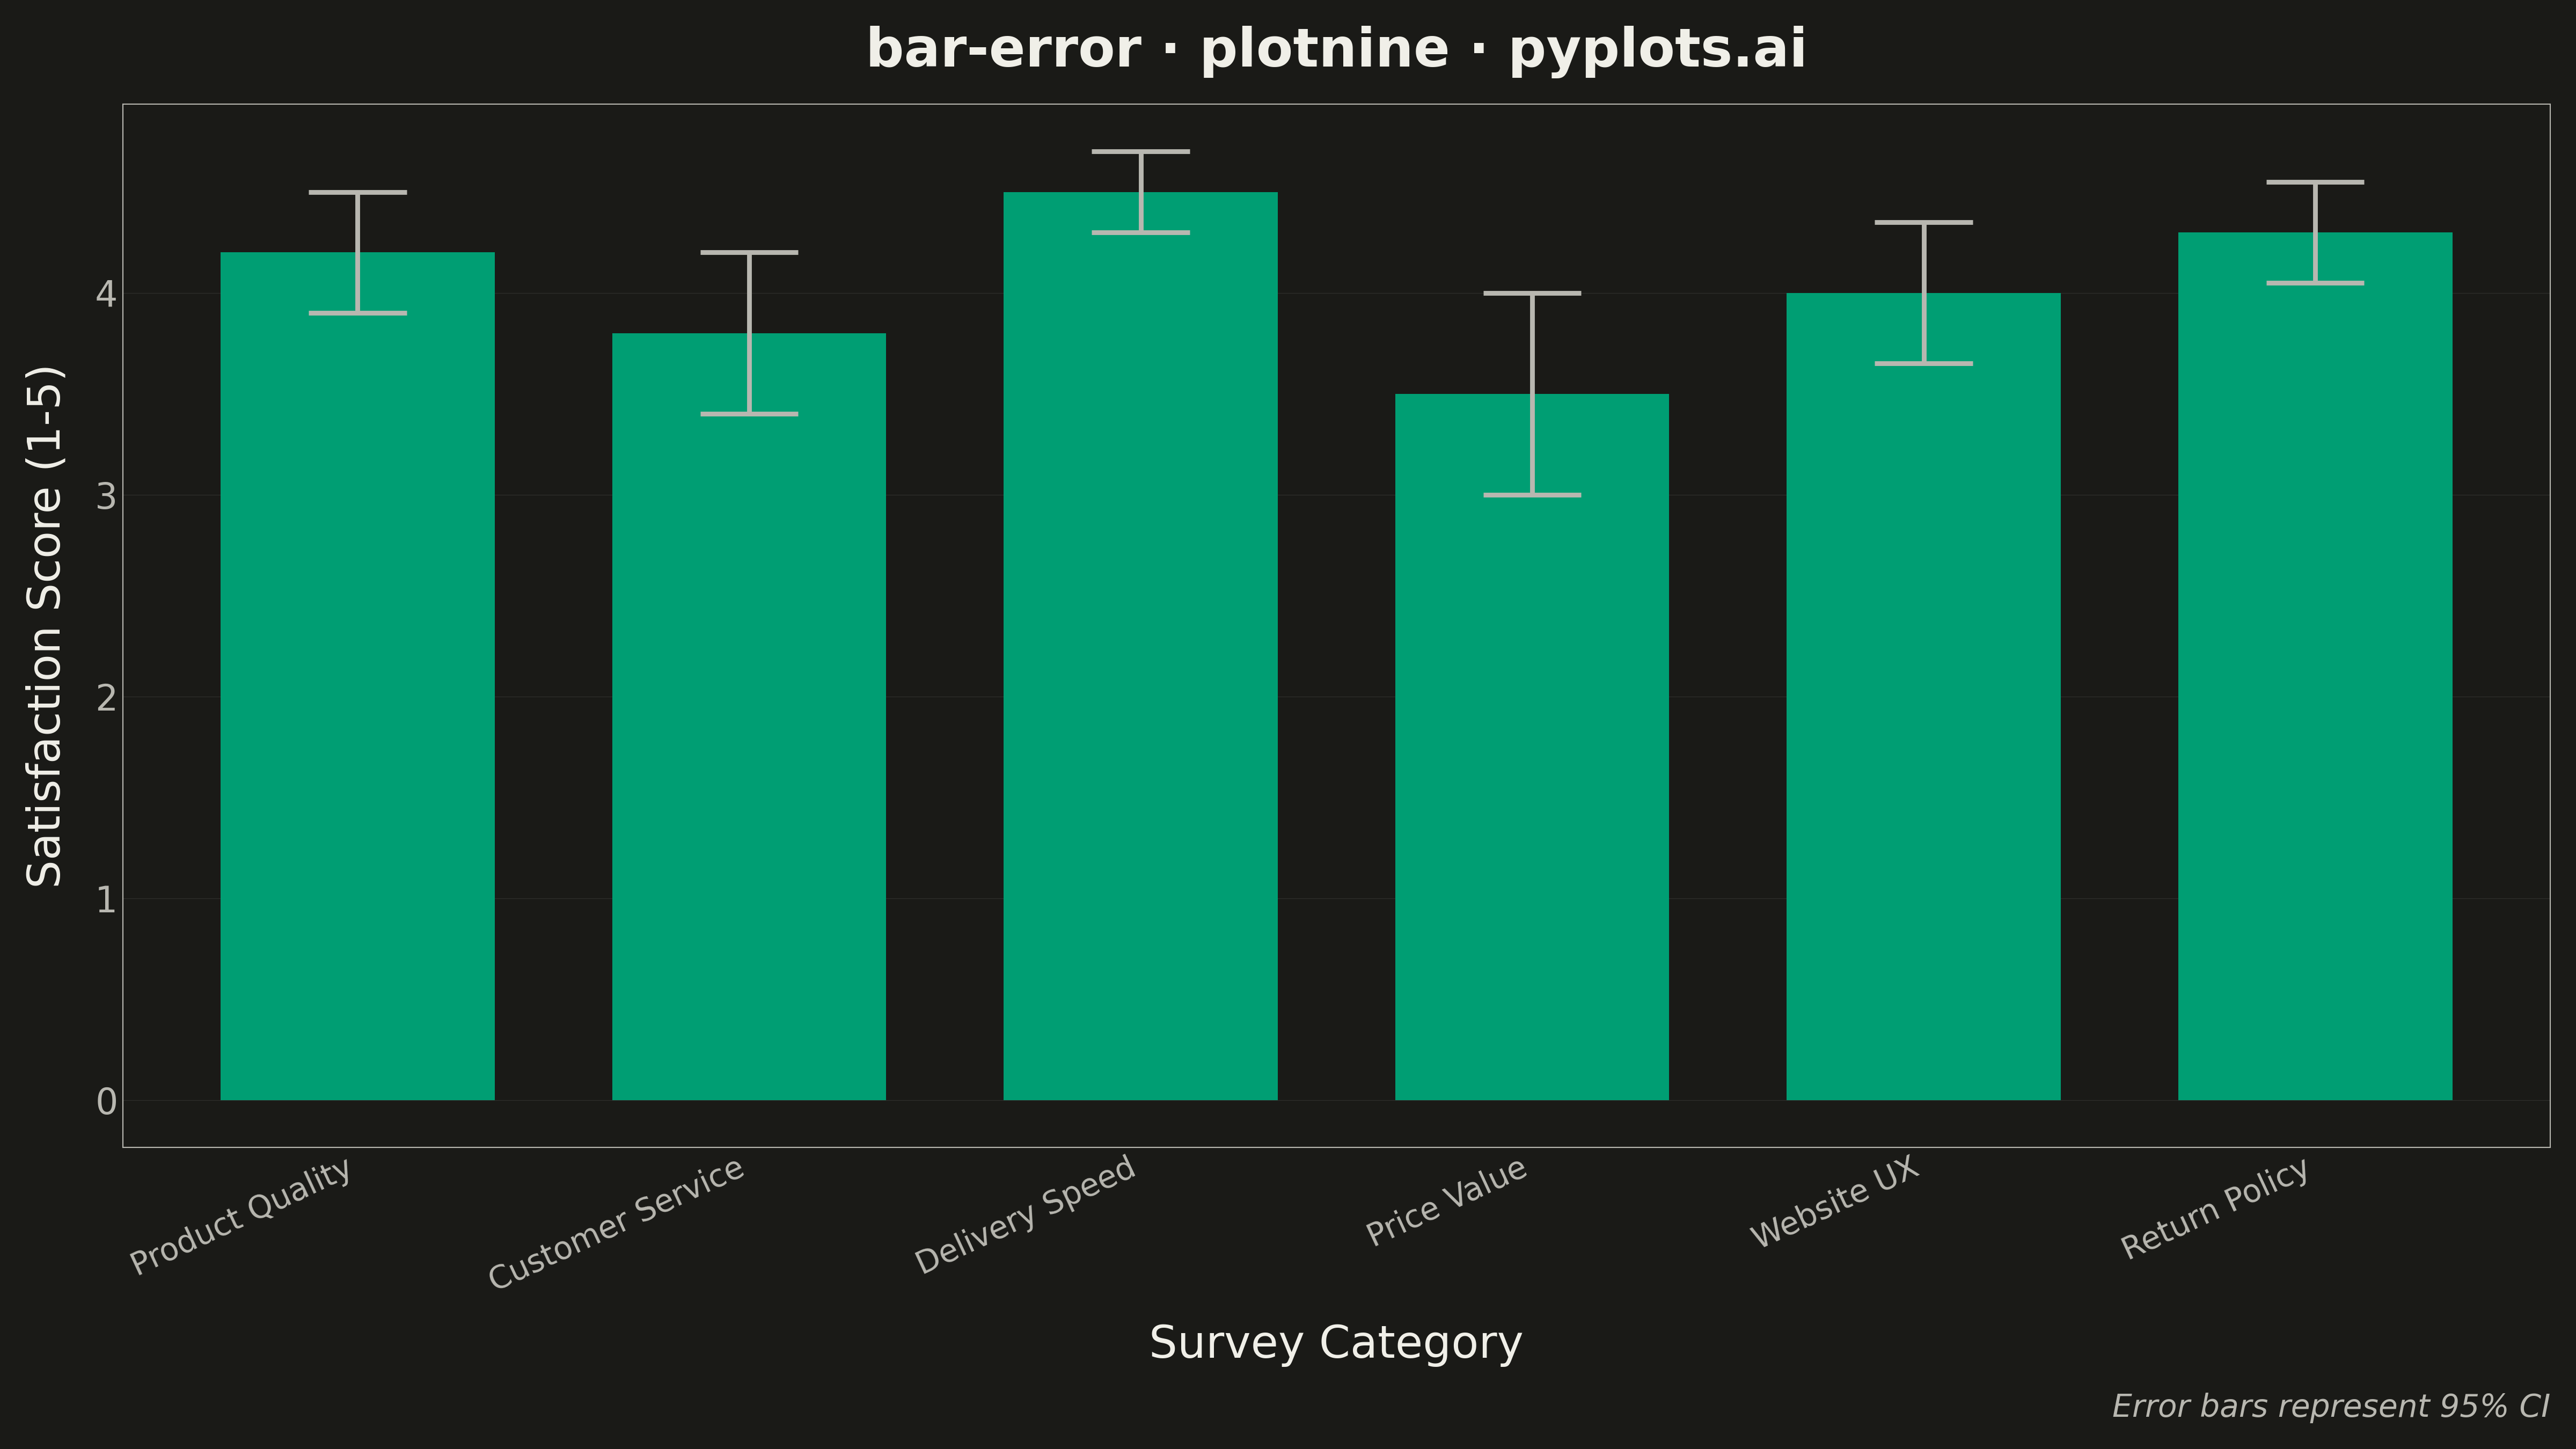
A bar chart with error bars displays categorical data as rectangular bars with vertical (or horizontal) lines extending from each bar to indicate uncertainty or variability. Error bars typically represent standard deviation, standard error, confidence intervals, or min/max ranges. This visualization is essential for comparing group means while communicating the reliability and precision of each measurement.
""" anyplot.ai
bar-error: Bar Chart with Error Bars
Library: plotnine 0.15.4 | Python 3.13.13
Quality: 89/100 | Updated: 2026-05-10
"""

import os

import pandas as pd
from plotnine import (
    aes,
    element_line,
    element_rect,
    element_text,
    geom_col,
    geom_errorbar,
    ggplot,
    labs,
    theme,
    theme_minimal,
)


# Theme tokens
THEME = os.getenv("ANYPLOT_THEME", "light")
PAGE_BG = "#FAF8F1" if THEME == "light" else "#1A1A17"
INK = "#1A1A17" if THEME == "light" else "#F0EFE8"
INK_SOFT = "#4A4A44" if THEME == "light" else "#B8B7B0"
BRAND = "#009E73"

# Data - Survey results showing average satisfaction scores with 95% CI
categories = ["Product Quality", "Customer Service", "Delivery Speed", "Price Value", "Website UX", "Return Policy"]
values = [4.2, 3.8, 4.5, 3.5, 4.0, 4.3]
errors = [0.3, 0.4, 0.2, 0.5, 0.35, 0.25]  # 95% CI half-widths

df = pd.DataFrame(
    {
        "category": categories,
        "value": values,
        "error_lower": [v - e for v, e in zip(values, errors, strict=True)],
        "error_upper": [v + e for v, e in zip(values, errors, strict=True)],
    }
)

# Preserve category order
df["category"] = pd.Categorical(df["category"], categories=categories, ordered=True)

# Plot
plot = (
    ggplot(df, aes(x="category", y="value"))
    + geom_col(fill=BRAND, width=0.7)
    + geom_errorbar(aes(ymin="error_lower", ymax="error_upper"), width=0.25, size=1.2, color=INK_SOFT)
    + labs(
        x="Survey Category",
        y="Satisfaction Score (1-5)",
        title="bar-error \u00b7 plotnine \u00b7 pyplots.ai",
        caption="Error bars represent 95% CI",
    )
    + theme_minimal()
    + theme(
        figure_size=(16, 9),
        plot_background=element_rect(fill=PAGE_BG, color=PAGE_BG),
        panel_background=element_rect(fill=PAGE_BG, color=PAGE_BG),
        panel_border=element_rect(color=INK_SOFT, fill=None, size=0.5),
        panel_grid_major_x=element_line(alpha=0),
        panel_grid_minor=element_line(alpha=0),
        panel_grid_major_y=element_line(color=INK, size=0.3, alpha=0.1),
        plot_title=element_text(size=24, weight="bold", color=INK),
        axis_title_x=element_text(size=20, color=INK),
        axis_title_y=element_text(size=20, color=INK),
        axis_text_x=element_text(size=14, angle=25, ha="right", color=INK_SOFT),
        axis_text_y=element_text(size=16, color=INK_SOFT),
        plot_caption=element_text(size=14, style="italic", color=INK_SOFT),
        axis_line=element_line(color=INK_SOFT, size=0.5),
    )
)

# Save with theme-aware filename
plot.save(f"plot-{THEME}.png", dpi=300, verbose=False)
Runnable source as JSON, for any HTTP client: https://api.anyplot.ai/specs/bar-error/plotnine/code. Any spec id and library id listed in llms-full.txt fit the same URL shape; every URL below is complete and callable.
{
  "spec_id": "bar-error",
  "language": "python",
  "library": "plotnine",
  "page": "https://anyplot.ai/bar-error/python/plotnine",
  "hub": "https://anyplot.ai/bar-error",
  "code_json": "https://api.anyplot.ai/specs/bar-error/plotnine/code",
  "spec_json": "https://api.anyplot.ai/specs/bar-error",
  "render_light_png": "https://storage.googleapis.com/anyplot-images/plots/bar-error/python/plotnine/plot-light.png",
  "render_dark_png": "https://storage.googleapis.com/anyplot-images/plots/bar-error/python/plotnine/plot-dark.png",
  "quality_score": 89.0,
  "license": "MIT",
  "guide": "https://anyplot.ai/llms.txt"
}
Part of Bar Chart with Error Bars on anyplot.ai.