The same plot in 14 other libraries — Python: Altair, Bokeh, lets-plot, Matplotlib, Plotly, plotnine, Pygal, Seaborn; Julia: Makie.jl; JavaScript: Chart.js, D3.js, Apache ECharts, Highcharts, MUI X Charts. Compare all 15 side by side: Bar Chart with Error Bars in Python, R, Julia and JavaScript.
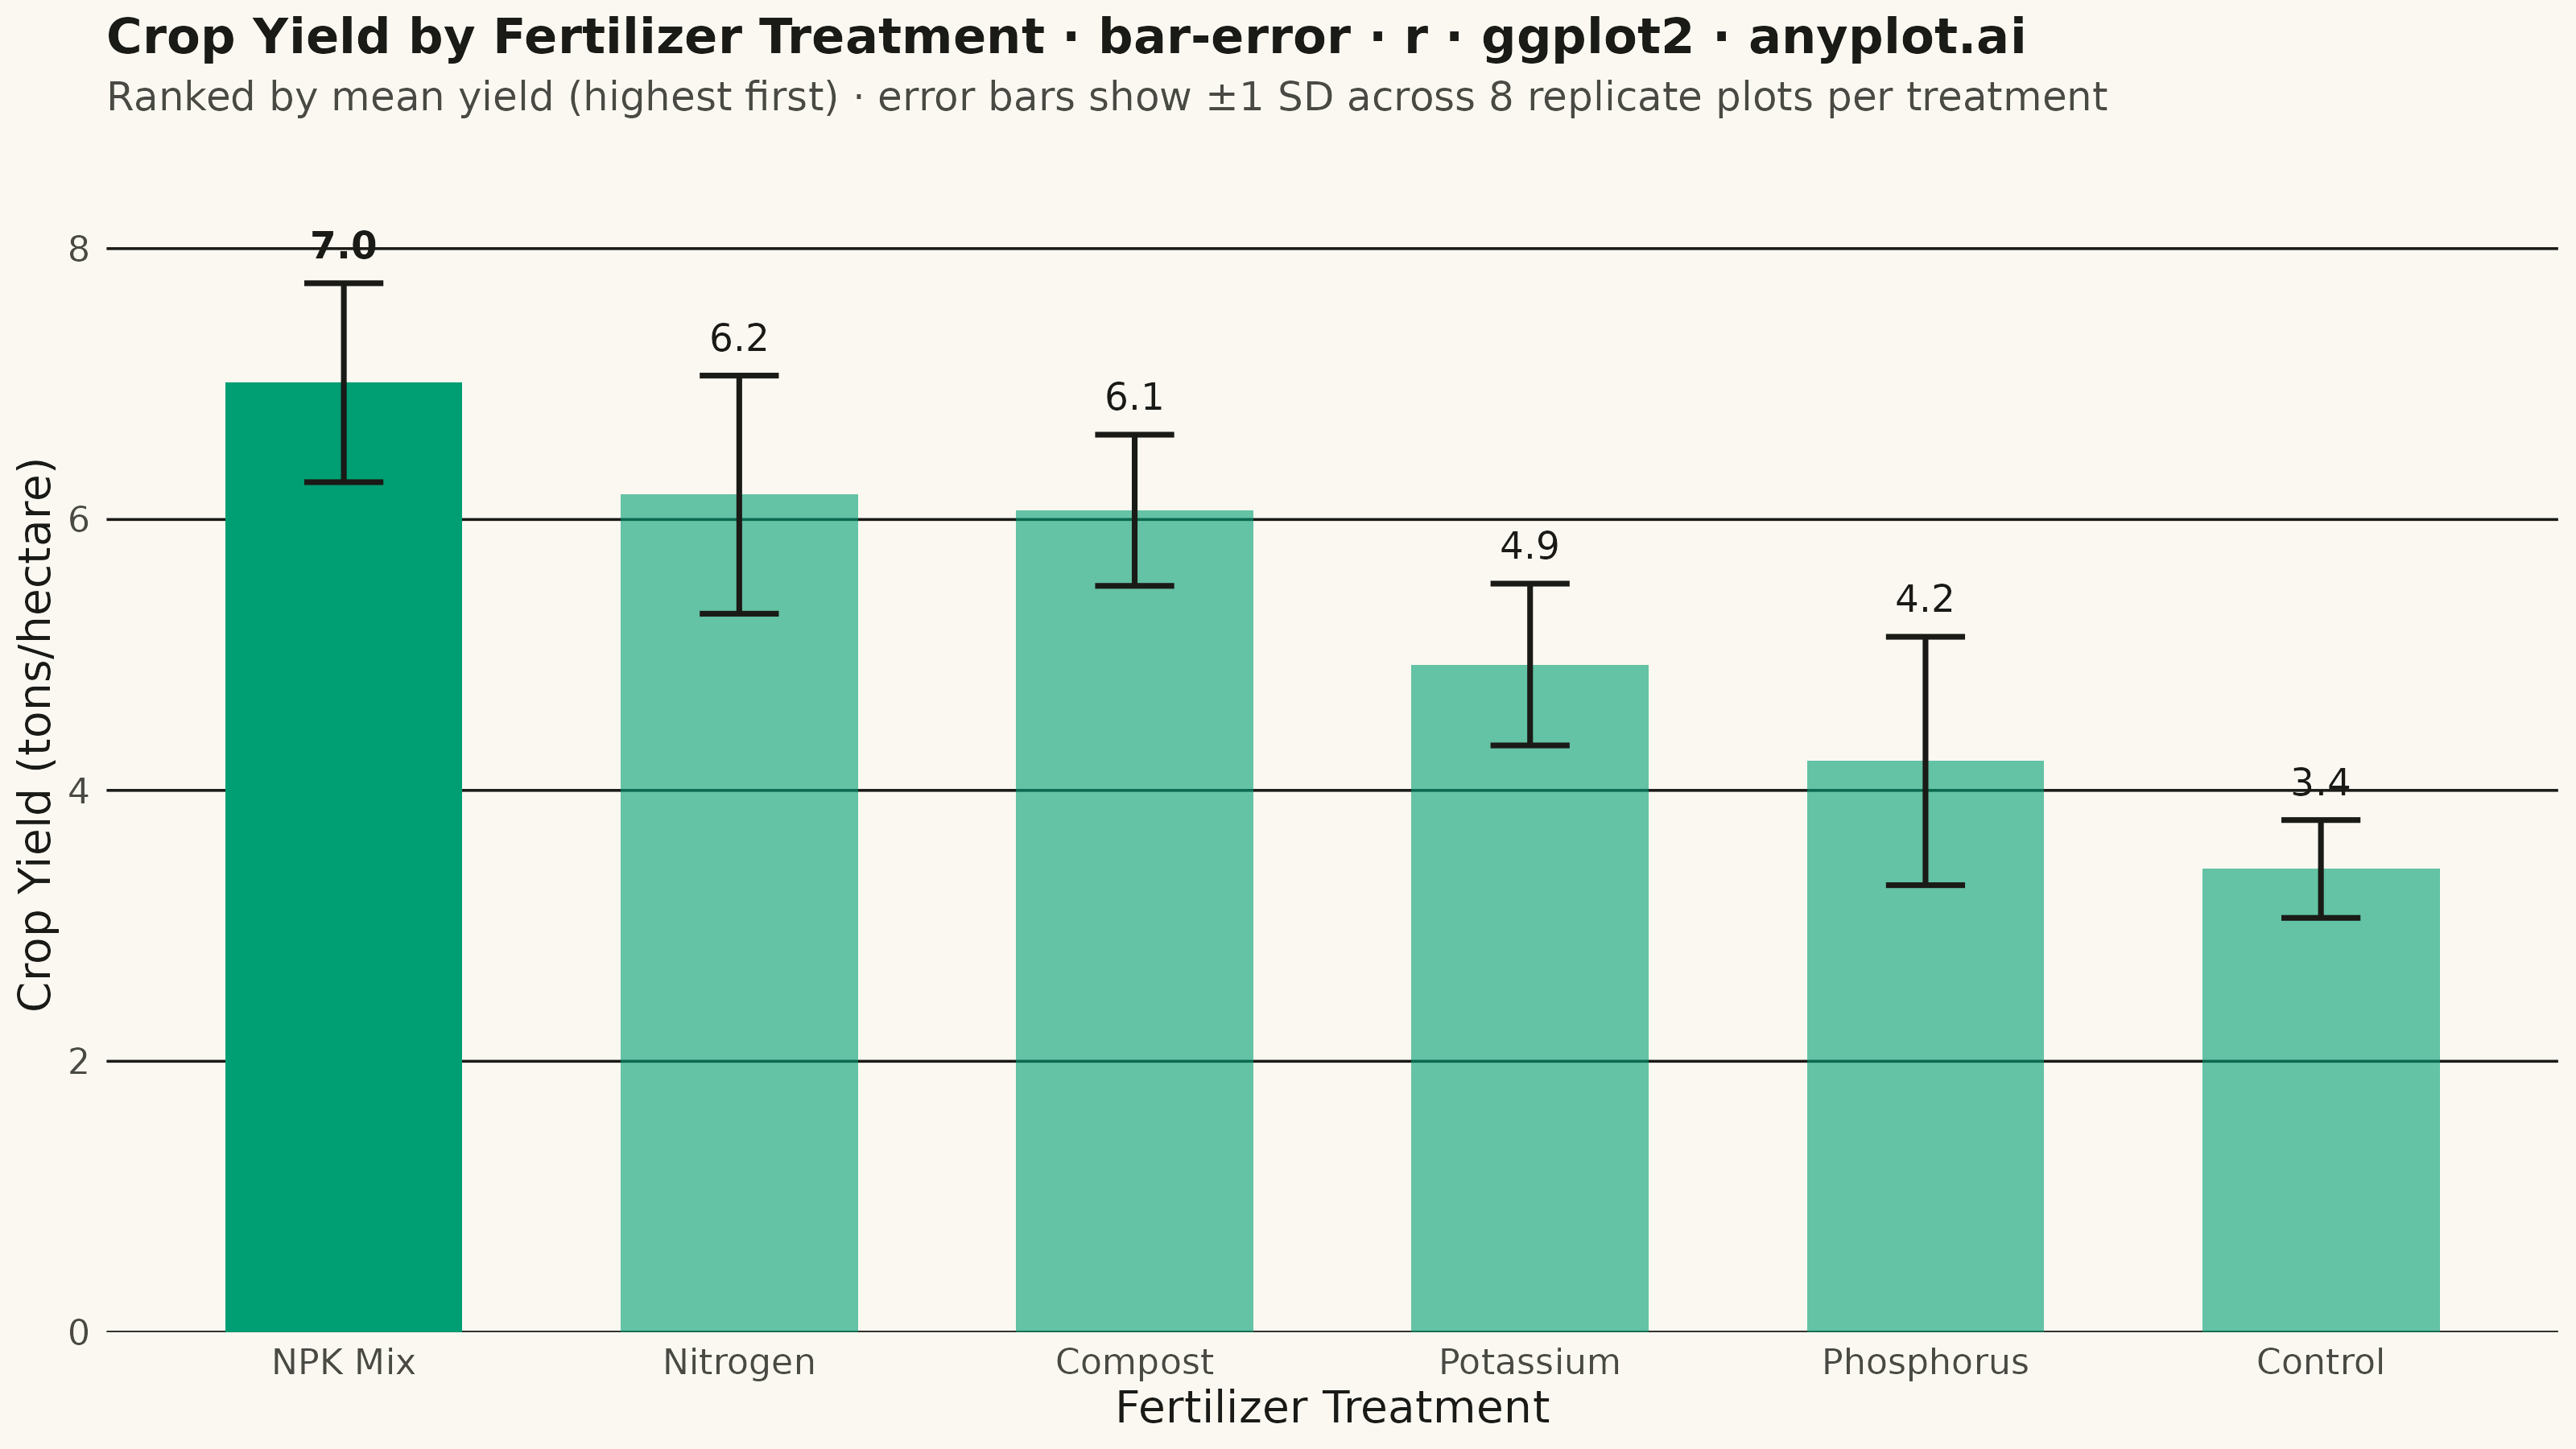
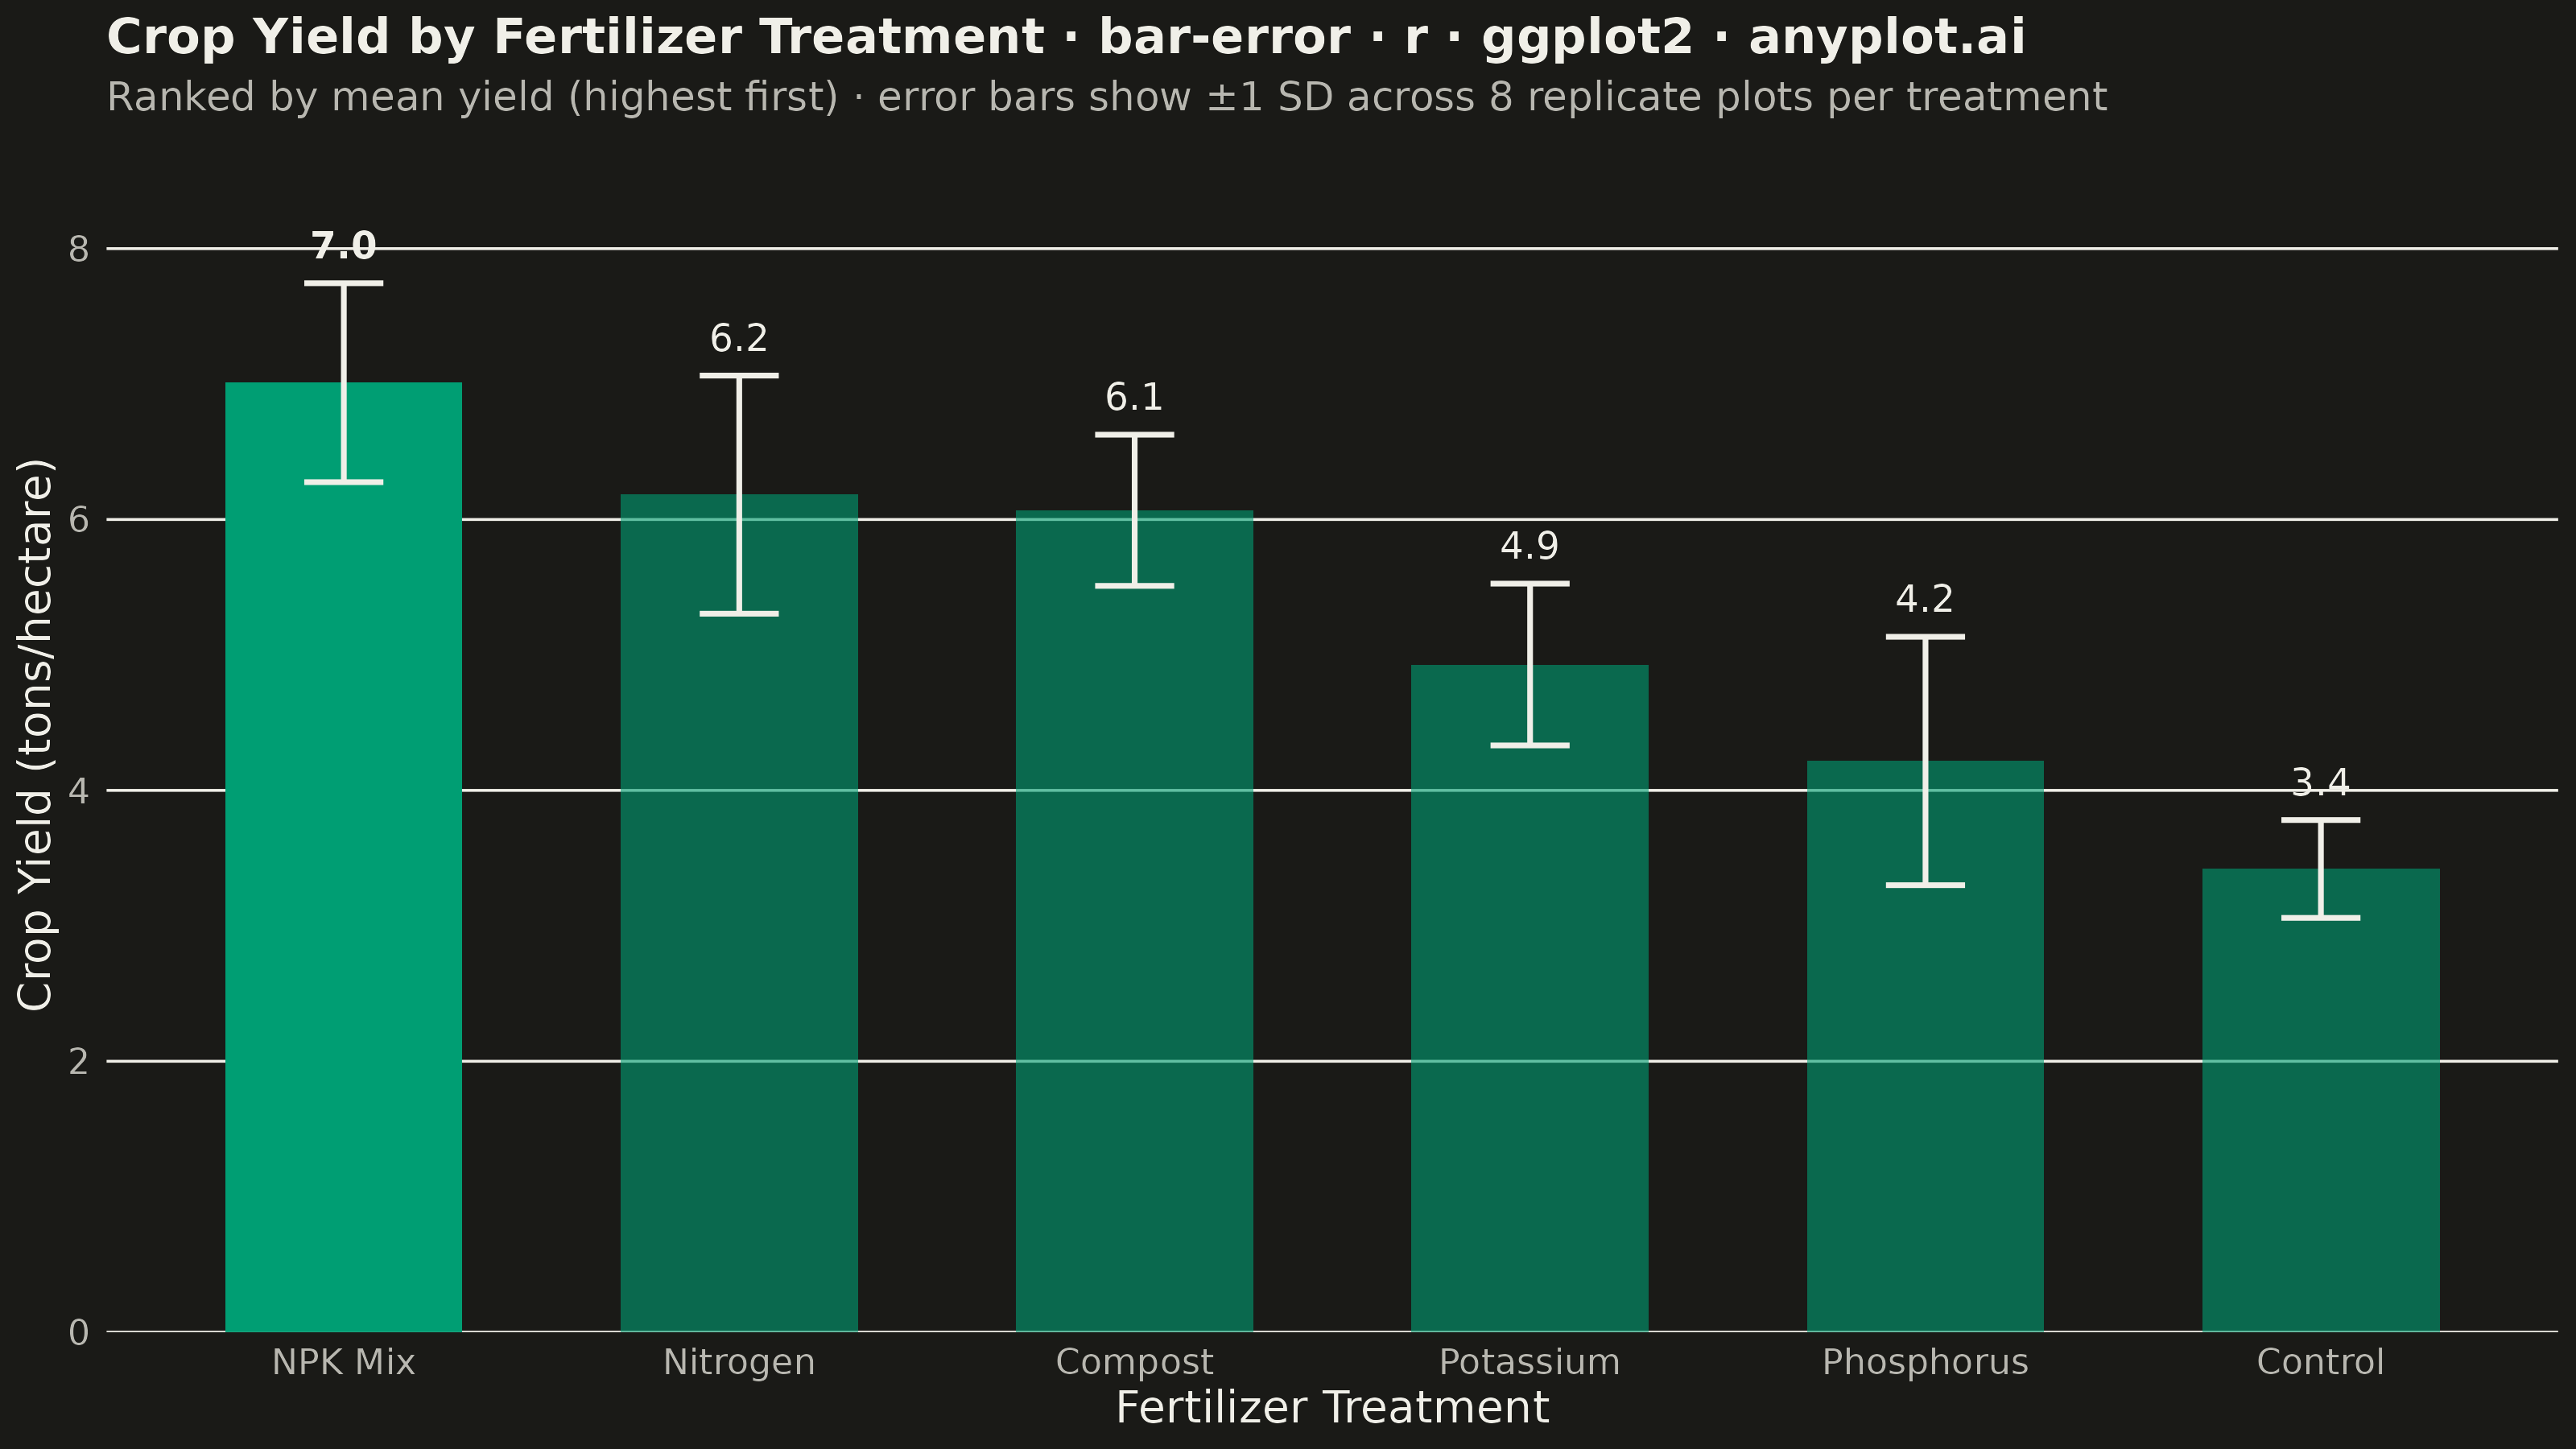
A bar chart with error bars displays categorical data as rectangular bars with vertical (or horizontal) lines extending from each bar to indicate uncertainty or variability. Error bars typically represent standard deviation, standard error, confidence intervals, or min/max ranges. This visualization is essential for comparing group means while communicating the reliability and precision of each measurement.
#' anyplot.ai
#' bar-error: Bar Chart with Error Bars
#' Library: ggplot2 3.5.1 | R 4.4.1
#' Quality: 81/100 | Updated: 2026-09-27

library(ggplot2)
library(dplyr)
library(ragg)

set.seed(42)

# --- Theme tokens -------------------------------------------------------
THEME    <- Sys.getenv("ANYPLOT_THEME", "light")
PAGE_BG  <- if (THEME == "light") "#FAF8F1" else "#1A1A17"
INK      <- if (THEME == "light") "#1A1A17" else "#F0EFE8"
INK_SOFT <- if (THEME == "light") "#4A4A44" else "#B8B7B0"
BRAND    <- "#009E73" # Imprint palette position 1 — always first series

# --- Data -----------------------------------------------------------------
# Simulated field trial: crop yield (tons/hectare) across fertilizer
# treatments, 8 replicate plots per treatment.
treatments <- c("Control", "Nitrogen", "Phosphorus", "Potassium", "NPK Mix", "Compost")
true_means <- c(3.2, 5.8, 4.6, 4.9, 7.4, 6.1)
true_sds <- c(0.5, 0.7, 0.6, 0.55, 0.65, 0.6)
n_reps <- 8

replicate_yields <- bind_rows(lapply(seq_along(treatments), function(i) {
  tibble::tibble(
    treatment = treatments[i],
    yield = rnorm(n_reps, mean = true_means[i], sd = true_sds[i])
  )
}))

yield_summary <- replicate_yields %>%
  group_by(treatment) %>%
  summarise(mean_yield = mean(yield), sd_yield = sd(yield)) %>%
  arrange(desc(mean_yield)) %>%
  mutate(
    # Reversed levels so coord_flip() draws the top-ranked treatment
    # at the top of the horizontal axis, not the bottom.
    treatment = factor(treatment, levels = rev(treatment)),
    is_top = mean_yield == max(mean_yield)
  )

top_row <- yield_summary %>% filter(is_top)
top_x <- as.numeric(top_row$treatment)

# --- Plot -------------------------------------------------------------------
plot_title <- "Crop Yield by Fertilizer Treatment · bar-error · r · ggplot2 · anyplot.ai"
title_fontsize <- round(12 * 67 / nchar(plot_title))

p <- ggplot(yield_summary, aes(x = treatment, y = mean_yield)) +
  geom_col(aes(alpha = is_top), fill = BRAND, width = 0.6) +
  geom_errorbar(
    aes(ymin = mean_yield - sd_yield, ymax = mean_yield + sd_yield),
    width = 0.2, color = INK, linewidth = 0.6
  ) +
  geom_text(
    aes(y = mean_yield + sd_yield, label = sprintf("%.1f", mean_yield), fontface = ifelse(is_top, "bold", "plain")),
    hjust = -0.4, size = 3, color = INK
  ) +
  annotate(
    "text",
    x = top_x, y = top_row$mean_yield + top_row$sd_yield + 0.9,
    label = "★ Best yield", hjust = 0, vjust = 0.5,
    size = 3, fontface = "bold", color = BRAND
  ) +
  coord_flip(clip = "off") +
  scale_alpha_manual(values = c(`TRUE` = 1, `FALSE` = 0.6), guide = "none") +
  scale_y_continuous(
    labels = scales::label_number(suffix = " t/ha"),
    expand = expansion(mult = c(0, 0.32))
  ) +
  labs(
    title = plot_title,
    subtitle = "Ranked by mean yield (highest first) · error bars show ±1 SD across 8 replicate plots per treatment",
    x = "Fertilizer Treatment",
    y = "Crop Yield (tons/hectare)"
  ) +
  theme_minimal(base_size = 8) +
  theme(
    plot.background   = element_rect(fill = PAGE_BG, color = PAGE_BG),
    panel.background  = element_rect(fill = PAGE_BG, color = NA),
    panel.grid.major.y = element_blank(),
    panel.grid.minor  = element_blank(),
    panel.grid.major.x = element_line(color = INK, linewidth = 0.3),
    axis.title        = element_text(color = INK, size = 10),
    axis.text         = element_text(color = INK_SOFT, size = 8),
    axis.ticks        = element_blank(),
    plot.title        = element_text(color = INK, size = title_fontsize, face = "bold"),
    plot.subtitle     = element_text(color = INK_SOFT, size = 9)
  )

# --- Save -------------------------------------------------------------------
ggsave(
  filename = sprintf("plot-%s.png", THEME),
  plot     = p,
  device   = ragg::agg_png,
  width    = 8,
  height   = 4.5,
  units    = "in",
  dpi      = 400
)
Runnable source as JSON, for any HTTP client: https://api.anyplot.ai/specs/bar-error/ggplot2/code. Any spec id and library id listed in llms-full.txt fit the same URL shape; every URL below is complete and callable.
{
  "spec_id": "bar-error",
  "language": "r",
  "library": "ggplot2",
  "page": "https://anyplot.ai/bar-error/r/ggplot2",
  "hub": "https://anyplot.ai/bar-error",
  "code_json": "https://api.anyplot.ai/specs/bar-error/ggplot2/code",
  "spec_json": "https://api.anyplot.ai/specs/bar-error",
  "render_light_png": "https://storage.googleapis.com/anyplot-images/plots/bar-error/r/ggplot2/plot-light.png",
  "render_dark_png": "https://storage.googleapis.com/anyplot-images/plots/bar-error/r/ggplot2/plot-dark.png",
  "quality_score": 81.0,
  "license": "MIT",
  "guide": "https://anyplot.ai/llms.txt"
}
Part of Bar Chart with Error Bars on anyplot.ai.