The same plot in 14 other libraries — JavaScript: Chart.js, Apache ECharts, Highcharts, MUI X Charts; Python: Altair, Bokeh, lets-plot, Matplotlib, Plotly, plotnine, Pygal, Seaborn; R: ggplot2; Julia: Makie.jl. Compare all 15 side by side: Bar Chart with Error Bars in Python, R, Julia and JavaScript.
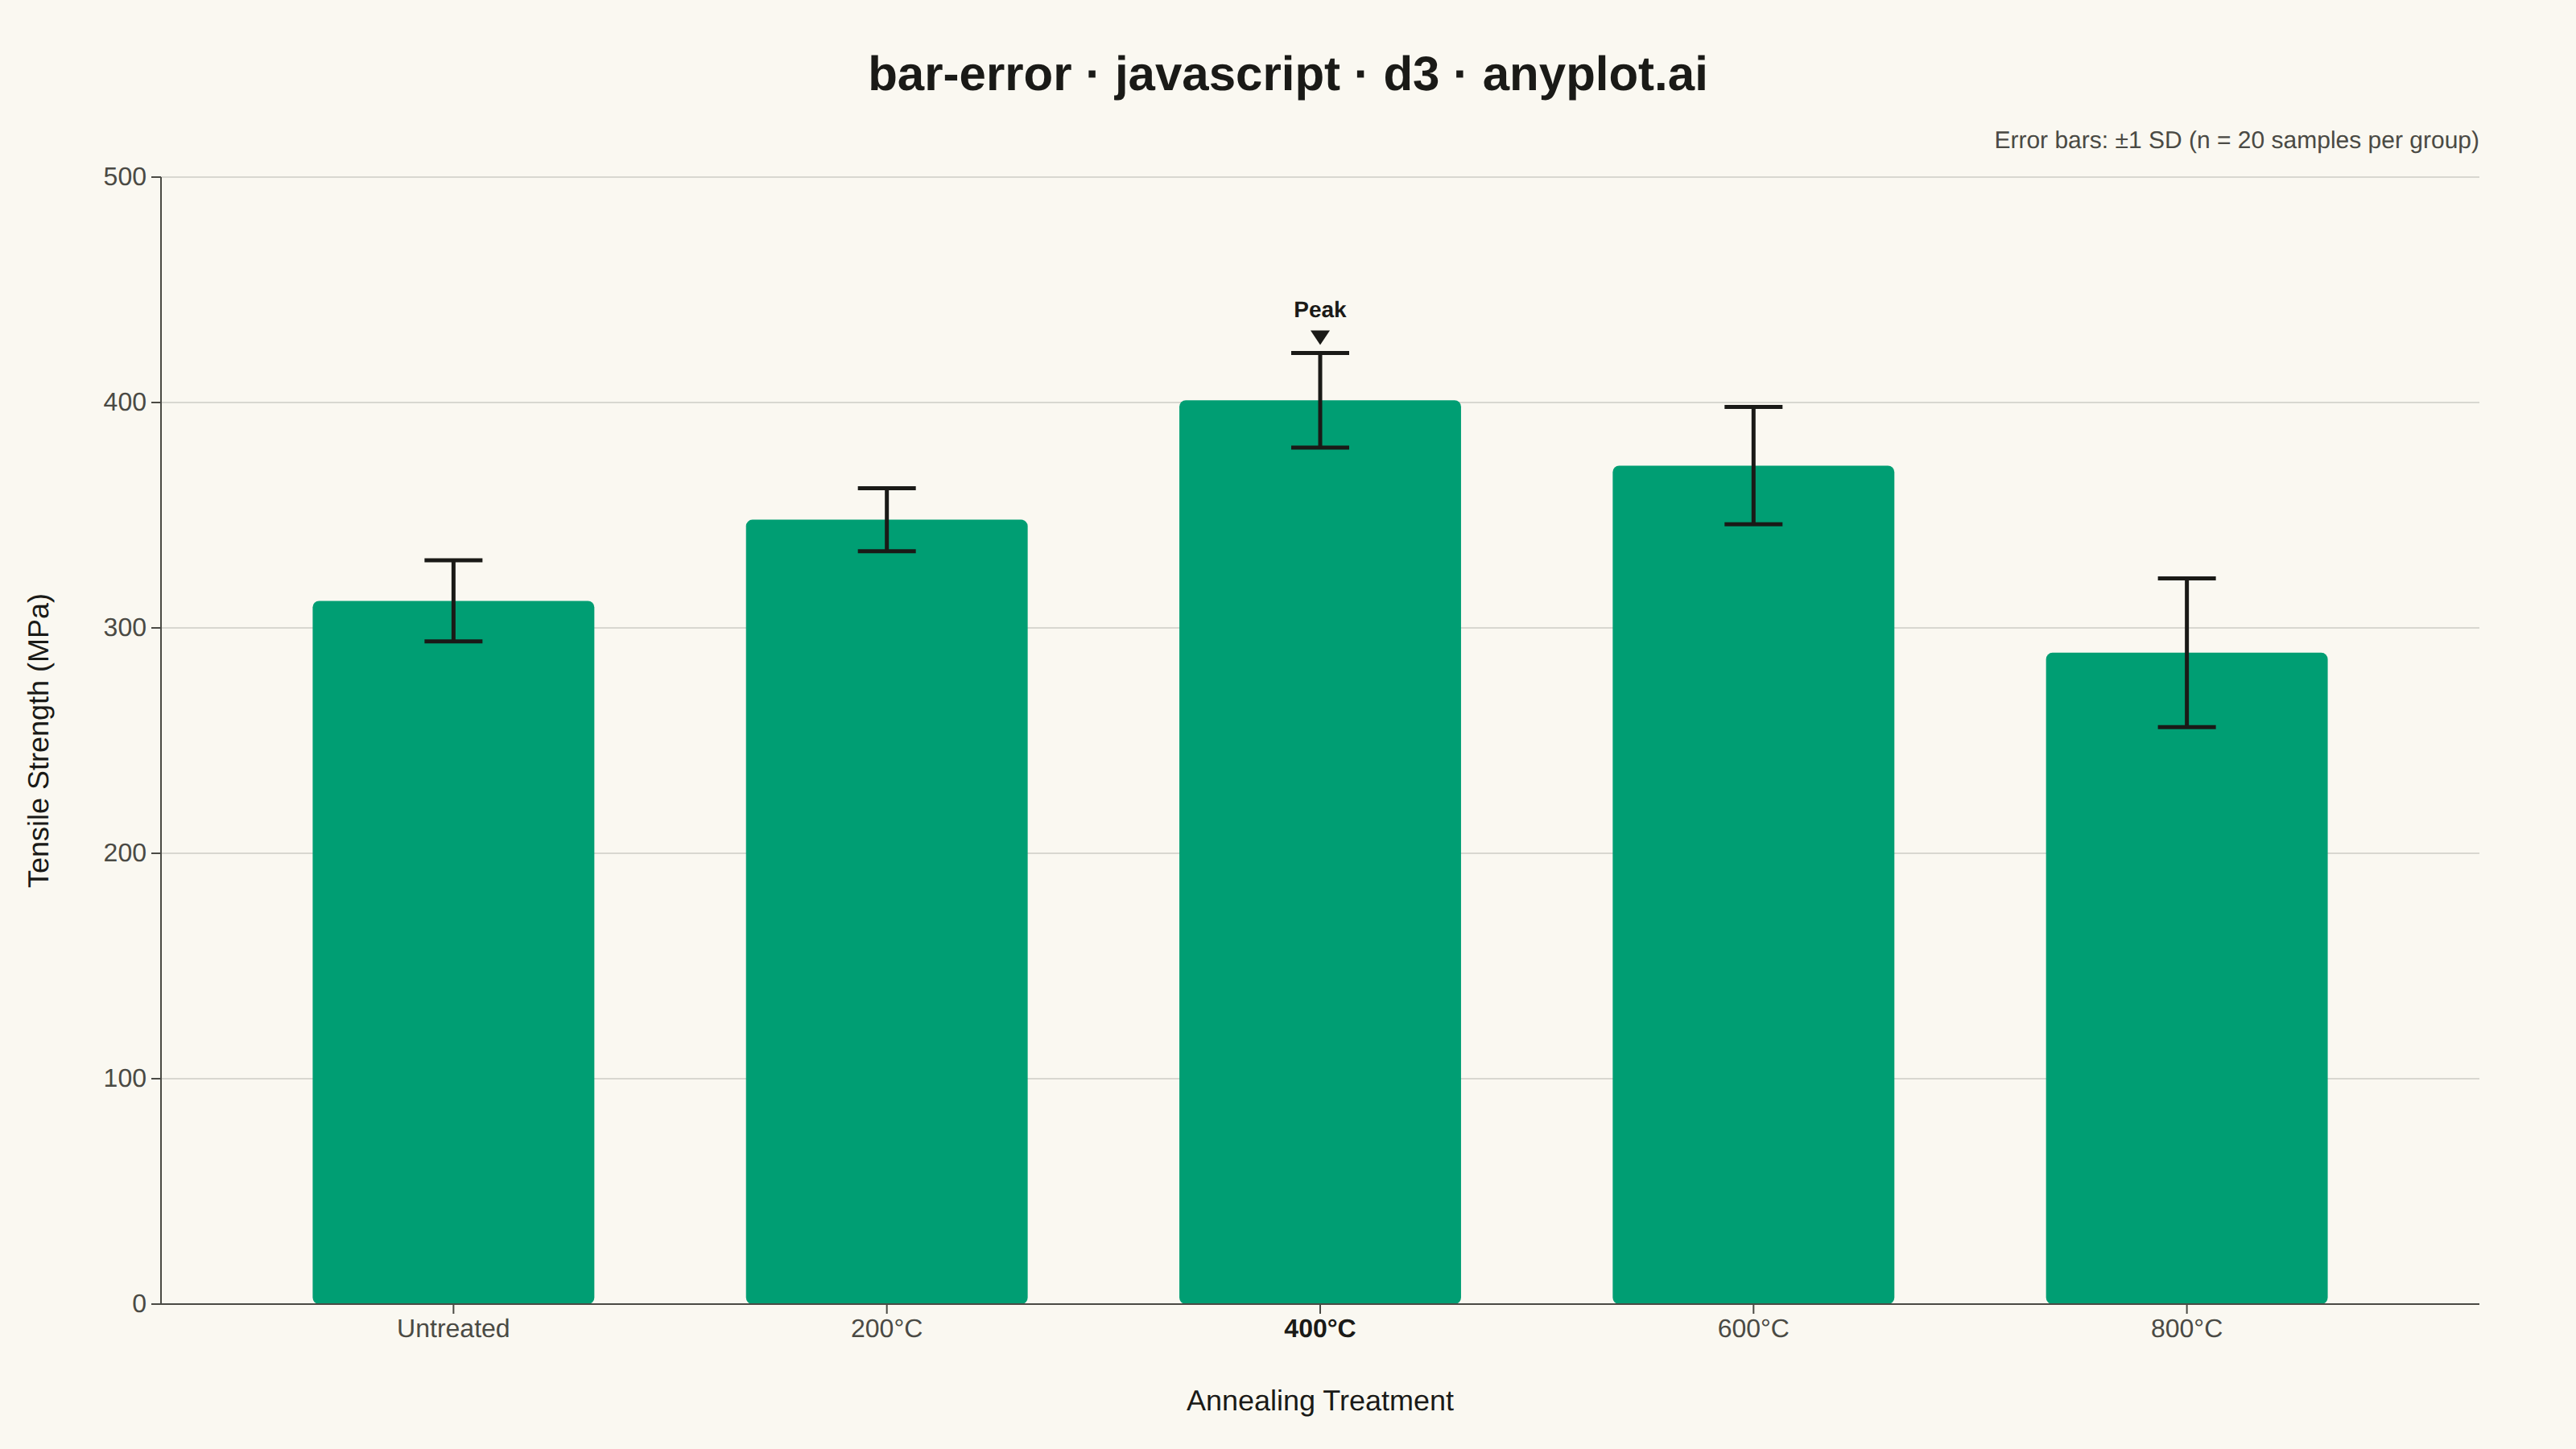
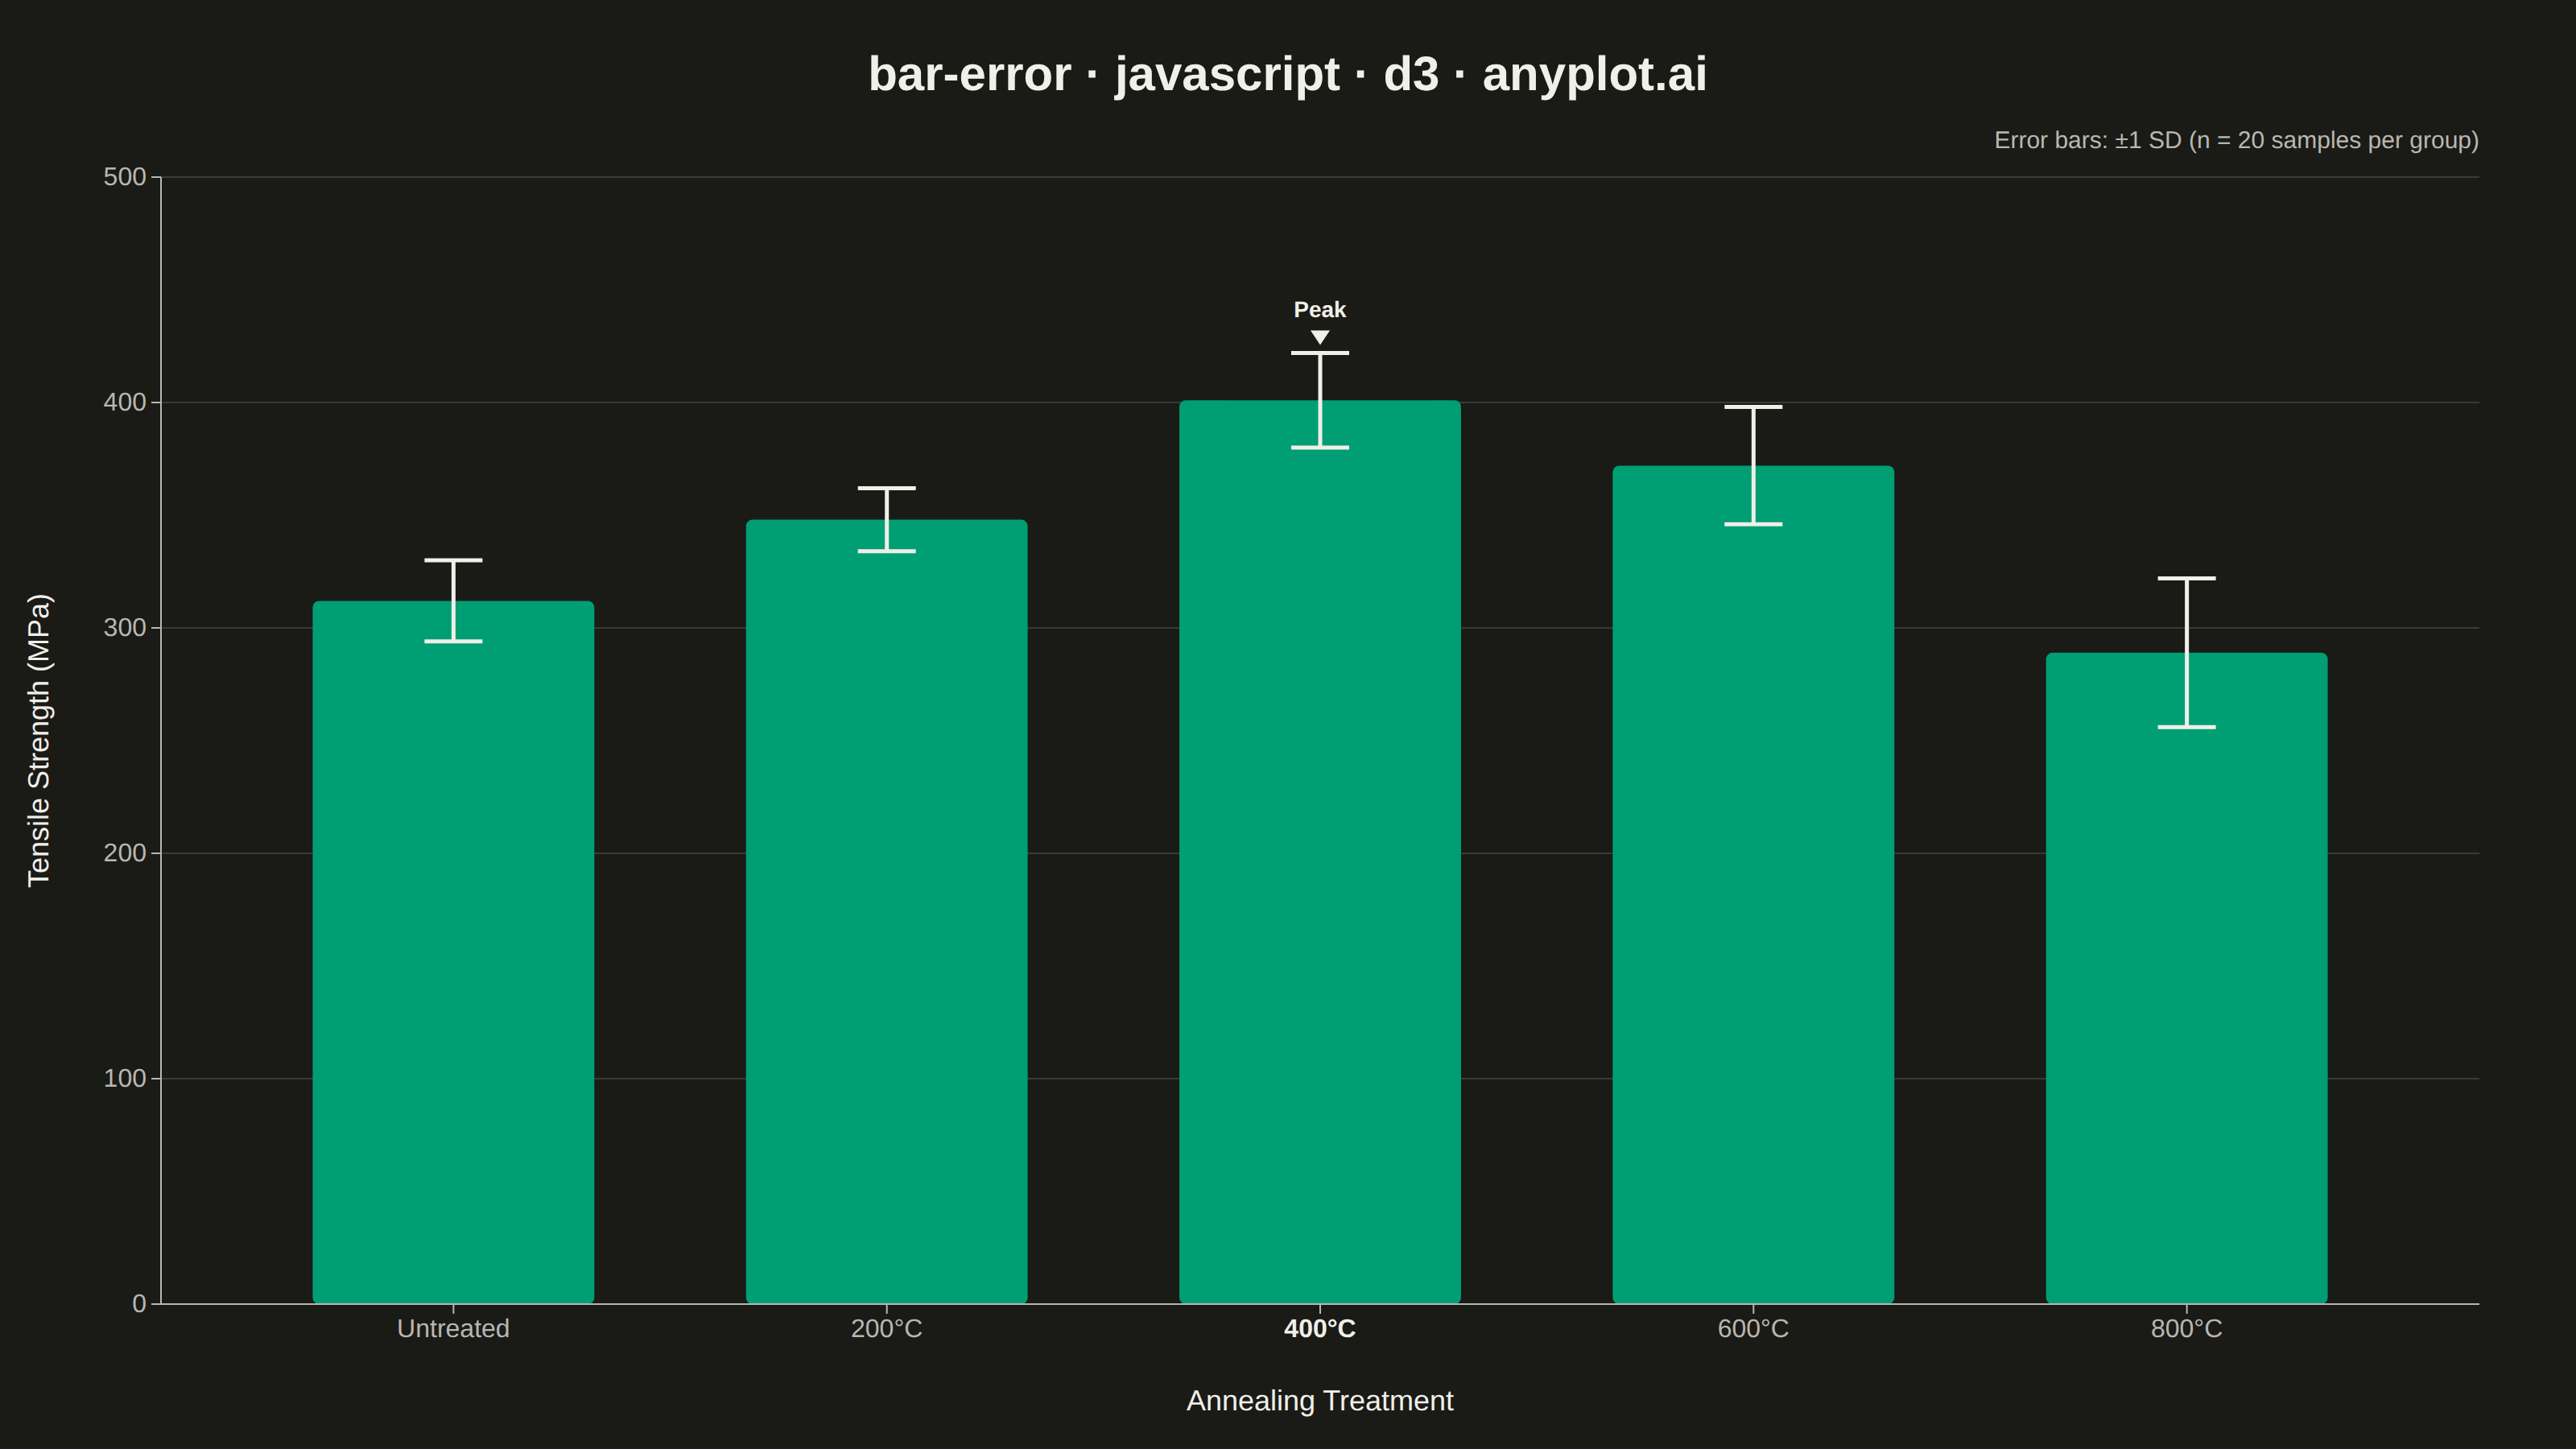
A bar chart with error bars displays categorical data as rectangular bars with vertical (or horizontal) lines extending from each bar to indicate uncertainty or variability. Error bars typically represent standard deviation, standard error, confidence intervals, or min/max ranges. This visualization is essential for comparing group means while communicating the reliability and precision of each measurement.
// anyplot.ai
// bar-error: Bar Chart with Error Bars
// Library: d3 7.9.0 | JavaScript 22.23.2
// Quality: 88/100 | Updated: 2026-09-27

const t = window.ANYPLOT_TOKENS;
const { width, height } = window.ANYPLOT_SIZE;
const margin = { top: 110, right: 60, bottom: 90, left: 100 };
const iw = width - margin.left - margin.right;
const ih = height - margin.top - margin.bottom;

// --- Data (in-memory, deterministic) ----------------------------------------
// Mean tensile strength (MPa) of alloy samples across annealing treatments,
// with standard deviation as the error range.
const data = [
  { treatment: "Untreated", mean: 312, sd: 18 },
  { treatment: "200°C", mean: 348, sd: 14 },
  { treatment: "400°C", mean: 401, sd: 21 },
  { treatment: "600°C", mean: 372, sd: 26 },
  { treatment: "800°C", mean: 289, sd: 33 },
];

// --- SVG mount ----------------------------------------------------------------
const svg = d3.select("#container").append("svg").attr("width", width).attr("height", height);
const g = svg.append("g").attr("transform", `translate(${margin.left},${margin.top})`);

// --- Scales ---------------------------------------------------------------
const x = d3.scaleBand().domain(data.map((d) => d.treatment)).range([0, iw]).padding(0.35);
const yMax = d3.max(data, (d) => d.mean + d.sd) * 1.08;
const y = d3.scaleLinear().domain([0, yMax]).nice().range([ih, 0]);

// --- Gridlines (y-axis only) ------------------------------------------------
g.append("g")
  .selectAll("line")
  .data(y.ticks(6))
  .join("line")
  .attr("x1", 0)
  .attr("x2", iw)
  .attr("y1", (d) => y(d))
  .attr("y2", (d) => y(d))
  .attr("stroke", t.grid)
  .attr("stroke-width", 1);

// --- Bars --------------------------------------------------------------------
g.selectAll(".bar")
  .data(data)
  .join("rect")
  .attr("class", "bar")
  .attr("x", (d) => x(d.treatment))
  .attr("y", (d) => y(d.mean))
  .attr("width", x.bandwidth())
  .attr("height", (d) => ih - y(d.mean))
  .attr("fill", t.palette[0])
  .attr("rx", 4);

// --- Error bars (stem + caps, drawn as one d3-shape "I-beam" path per bar) --
const capWidth = Math.min(x.bandwidth() * 0.4, 36);
// A d3.line() generator with .defined() gaps draws three disjoint segments
// (top cap, stem, bottom cap) as a single path per datum.
const errorLine = d3
  .line()
  .defined((p) => p !== null)
  .x((p) => p.x)
  .y((p) => p.y);

g.selectAll(".error")
  .data(data)
  .join("path")
  .attr("class", "error")
  .attr("fill", "none")
  .attr("stroke", t.ink)
  .attr("stroke-width", 2.5)
  .attr("d", (d) => {
    const cx = x(d.treatment) + x.bandwidth() / 2;
    const top = y(d.mean + d.sd);
    const bottom = y(d.mean - d.sd);
    return errorLine([
      { x: cx - capWidth / 2, y: top },
      { x: cx + capWidth / 2, y: top },
      null,
      { x: cx, y: top },
      { x: cx, y: bottom },
      null,
      { x: cx - capWidth / 2, y: bottom },
      { x: cx + capWidth / 2, y: bottom },
    ]);
  });

// --- Peak callout (data storytelling) -----------------------------------
const peak = data.reduce((a, b) => (b.mean > a.mean ? b : a));
const peakX = x(peak.treatment) + x.bandwidth() / 2;
const peakY = y(peak.mean + peak.sd) - 14;
g.append("path")
  .attr("d", `M${peakX - 6},${peakY} L${peakX + 6},${peakY} L${peakX},${peakY + 9} Z`)
  .attr("fill", t.ink);
g.append("text")
  .attr("x", peakX)
  .attr("y", peakY - 8)
  .attr("text-anchor", "middle")
  .attr("fill", t.ink)
  .style("font-size", "14px")
  .style("font-weight", "600")
  .text("Peak");

// --- Axes ----------------------------------------------------------------
const xAxis = g.append("g").attr("transform", `translate(0,${ih})`).call(d3.axisBottom(x).tickSizeOuter(0));
const yAxis = g.append("g").call(d3.axisLeft(y).ticks(6).tickSizeOuter(0));

for (const ax of [xAxis, yAxis]) {
  ax.selectAll("text").attr("fill", t.inkSoft).style("font-size", "16px");
  ax.selectAll("line").attr("stroke", t.inkSoft);
  ax.select(".domain").attr("stroke", t.inkSoft);
}
g.selectAll(".tick line").attr("stroke", t.inkSoft);

// Emphasize the peak treatment's x-axis label to guide the reader to it.
xAxis
  .selectAll("text")
  .filter((d) => d === peak.treatment)
  .style("font-weight", "700")
  .attr("fill", t.ink);

// --- Axis labels ---------------------------------------------------------
g.append("text")
  .attr("x", iw / 2)
  .attr("y", ih + 66)
  .attr("text-anchor", "middle")
  .attr("fill", t.ink)
  .style("font-size", "18px")
  .text("Annealing Treatment");

g.append("text")
  .attr("transform", "rotate(-90)")
  .attr("x", -ih / 2)
  .attr("y", -70)
  .attr("text-anchor", "middle")
  .attr("fill", t.ink)
  .style("font-size", "18px")
  .text("Tensile Strength (MPa)");

// --- Annotation explaining error bars ---------------------------------------
g.append("text")
  .attr("x", iw)
  .attr("y", -18)
  .attr("text-anchor", "end")
  .attr("fill", t.inkSoft)
  .style("font-size", "15px")
  .text("Error bars: ±1 SD (n = 20 samples per group)");

// --- Title -----------------------------------------------------------------
svg
  .append("text")
  .attr("x", width / 2)
  .attr("y", 56)
  .attr("text-anchor", "middle")
  .attr("fill", t.ink)
  .style("font-size", "36px")
  .style("font-weight", "600")
  .text("bar-error · javascript · d3 · anyplot.ai");
Runnable source as JSON, for any HTTP client: https://api.anyplot.ai/specs/bar-error/d3/code. Any spec id and library id listed in llms-full.txt fit the same URL shape; every URL below is complete and callable.
{
  "spec_id": "bar-error",
  "language": "javascript",
  "library": "d3",
  "page": "https://anyplot.ai/bar-error/javascript/d3",
  "hub": "https://anyplot.ai/bar-error",
  "code_json": "https://api.anyplot.ai/specs/bar-error/d3/code",
  "spec_json": "https://api.anyplot.ai/specs/bar-error",
  "render_light_png": "https://storage.googleapis.com/anyplot-images/plots/bar-error/javascript/d3/plot-light.png",
  "render_dark_png": "https://storage.googleapis.com/anyplot-images/plots/bar-error/javascript/d3/plot-dark.png",
  "interactive_light_html": "https://storage.googleapis.com/anyplot-images/plots/bar-error/javascript/d3/plot-light.html",
  "interactive_dark_html": "https://storage.googleapis.com/anyplot-images/plots/bar-error/javascript/d3/plot-dark.html",
  "quality_score": 88.0,
  "license": "MIT",
  "guide": "https://anyplot.ai/llms.txt"
}
Part of Bar Chart with Error Bars on anyplot.ai.