The same plot in 14 other libraries — JavaScript: Chart.js, D3.js, Apache ECharts, MUI X Charts; Python: Altair, Bokeh, lets-plot, Matplotlib, Plotly, plotnine, Pygal, Seaborn; R: ggplot2; Julia: Makie.jl. Compare all 15 side by side: Bar Chart with Error Bars in Python, R, Julia and JavaScript.
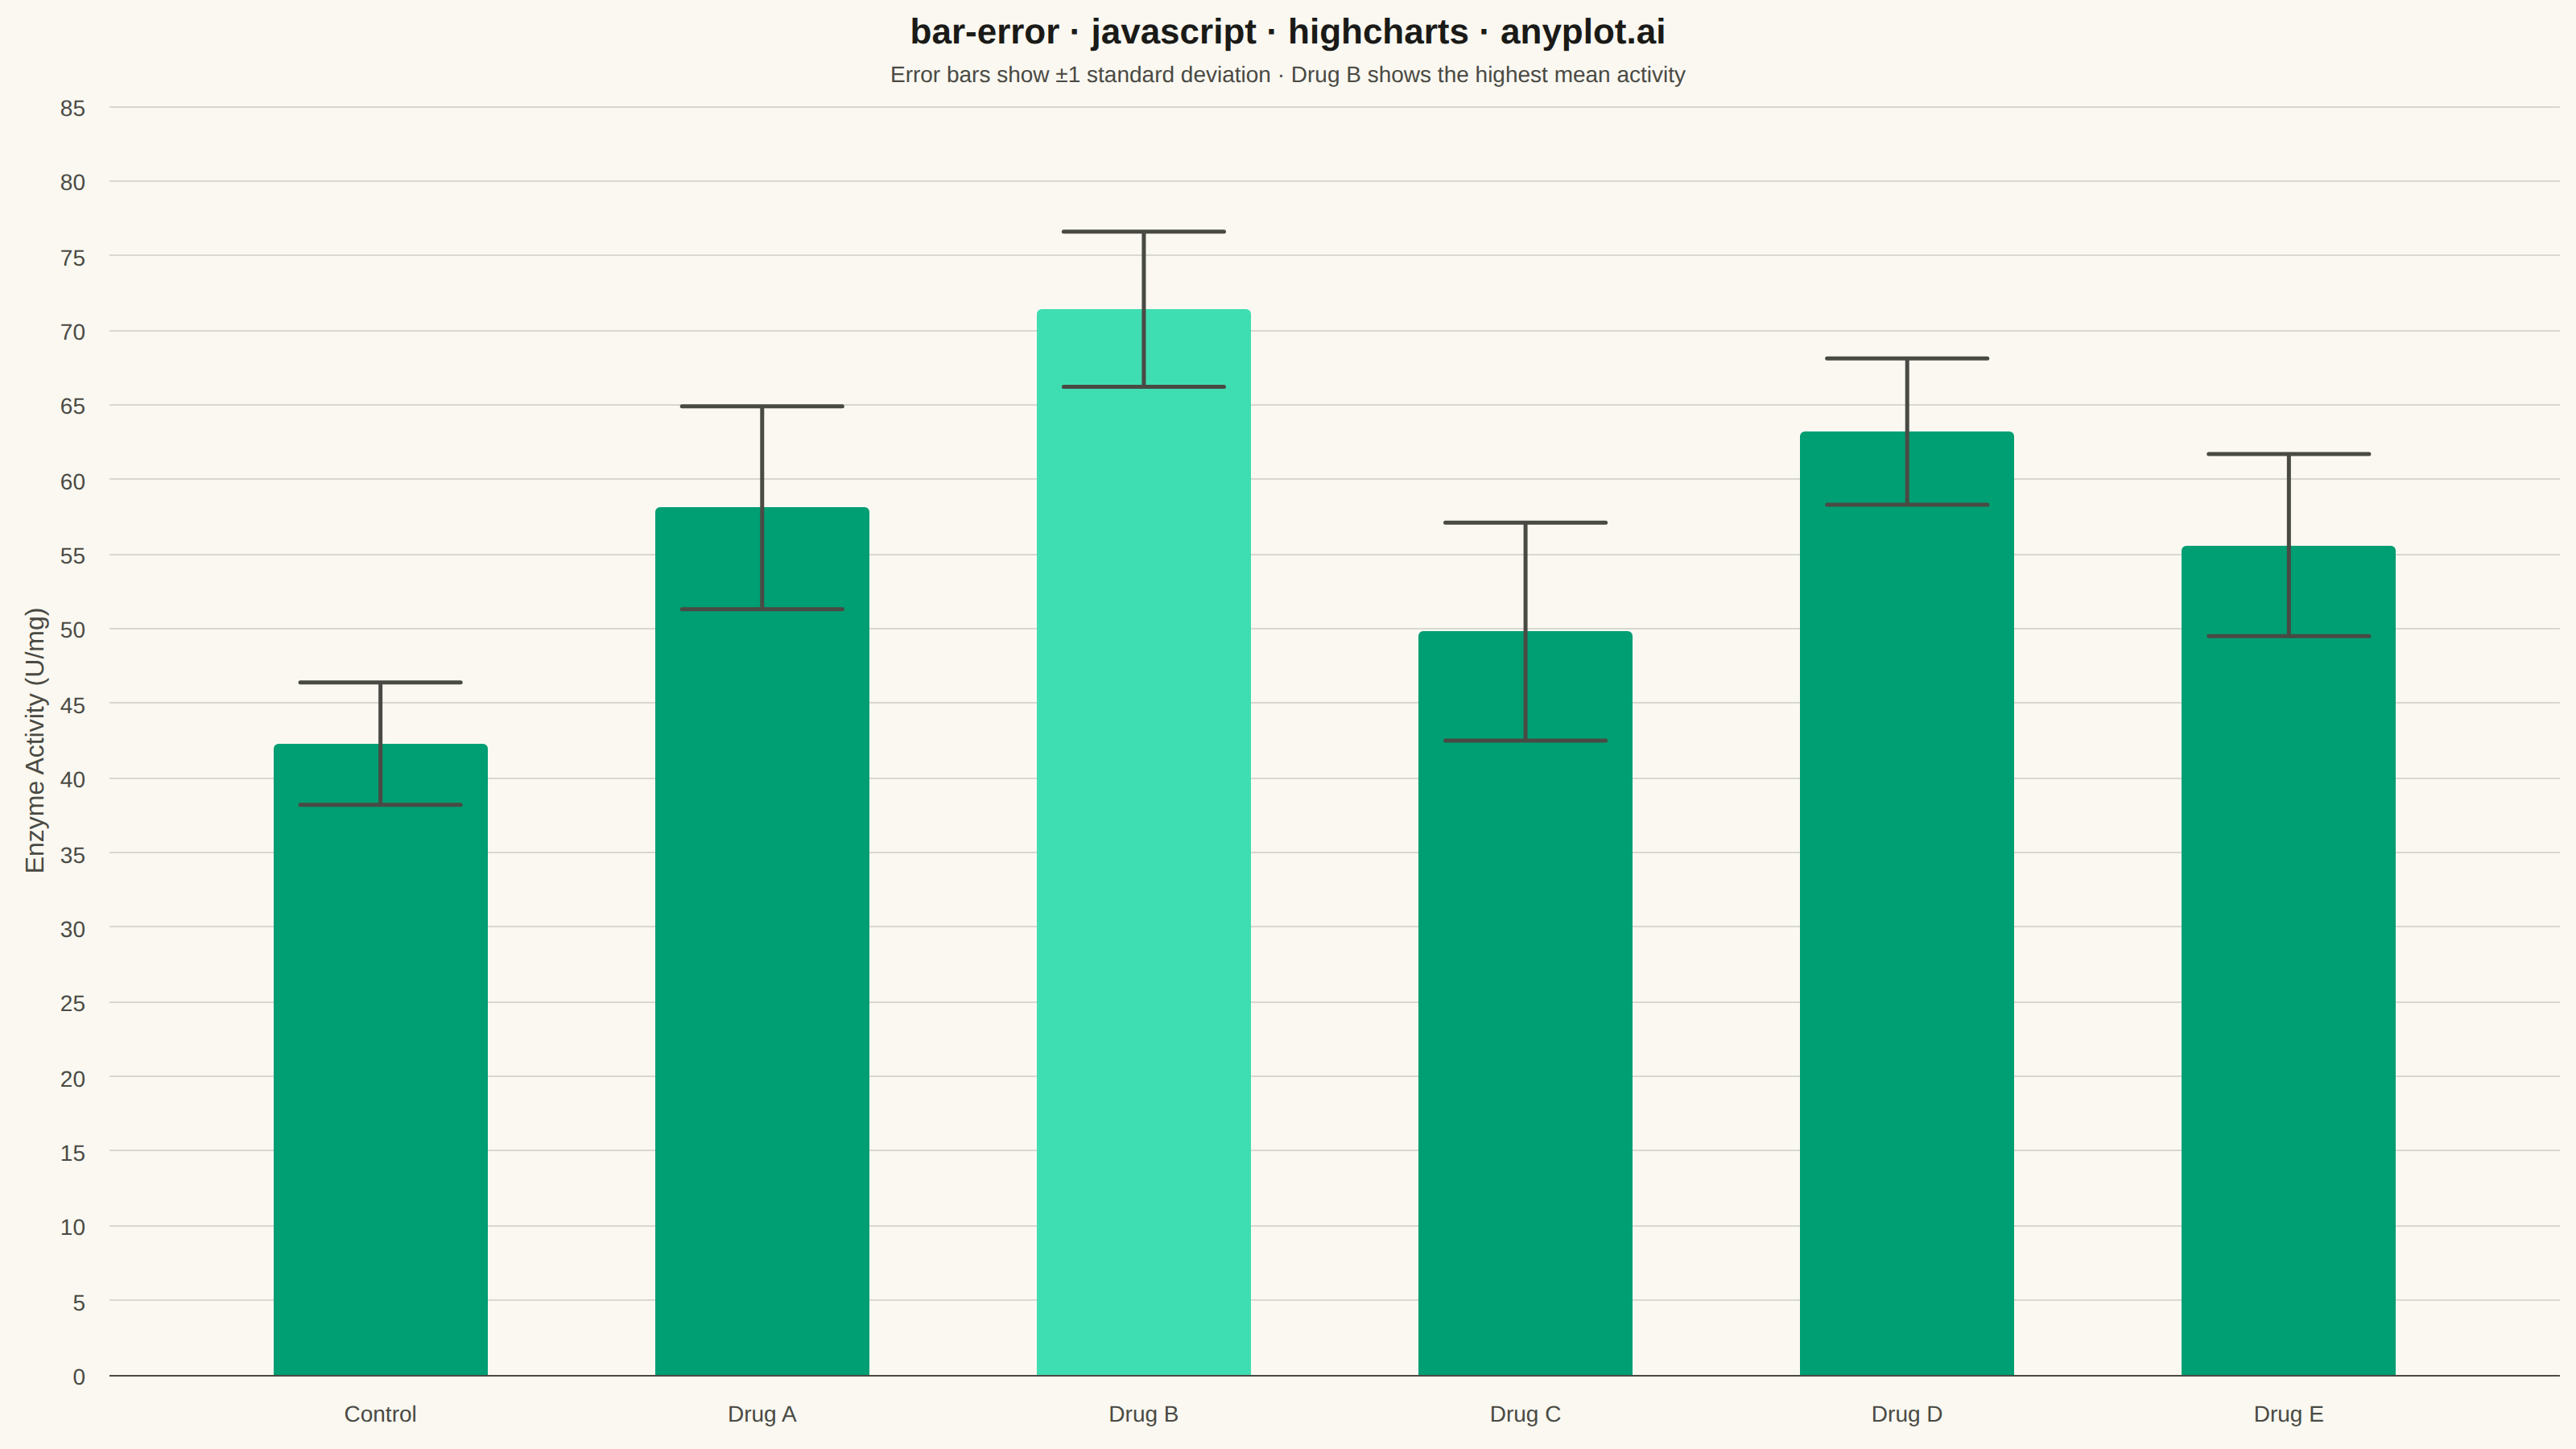
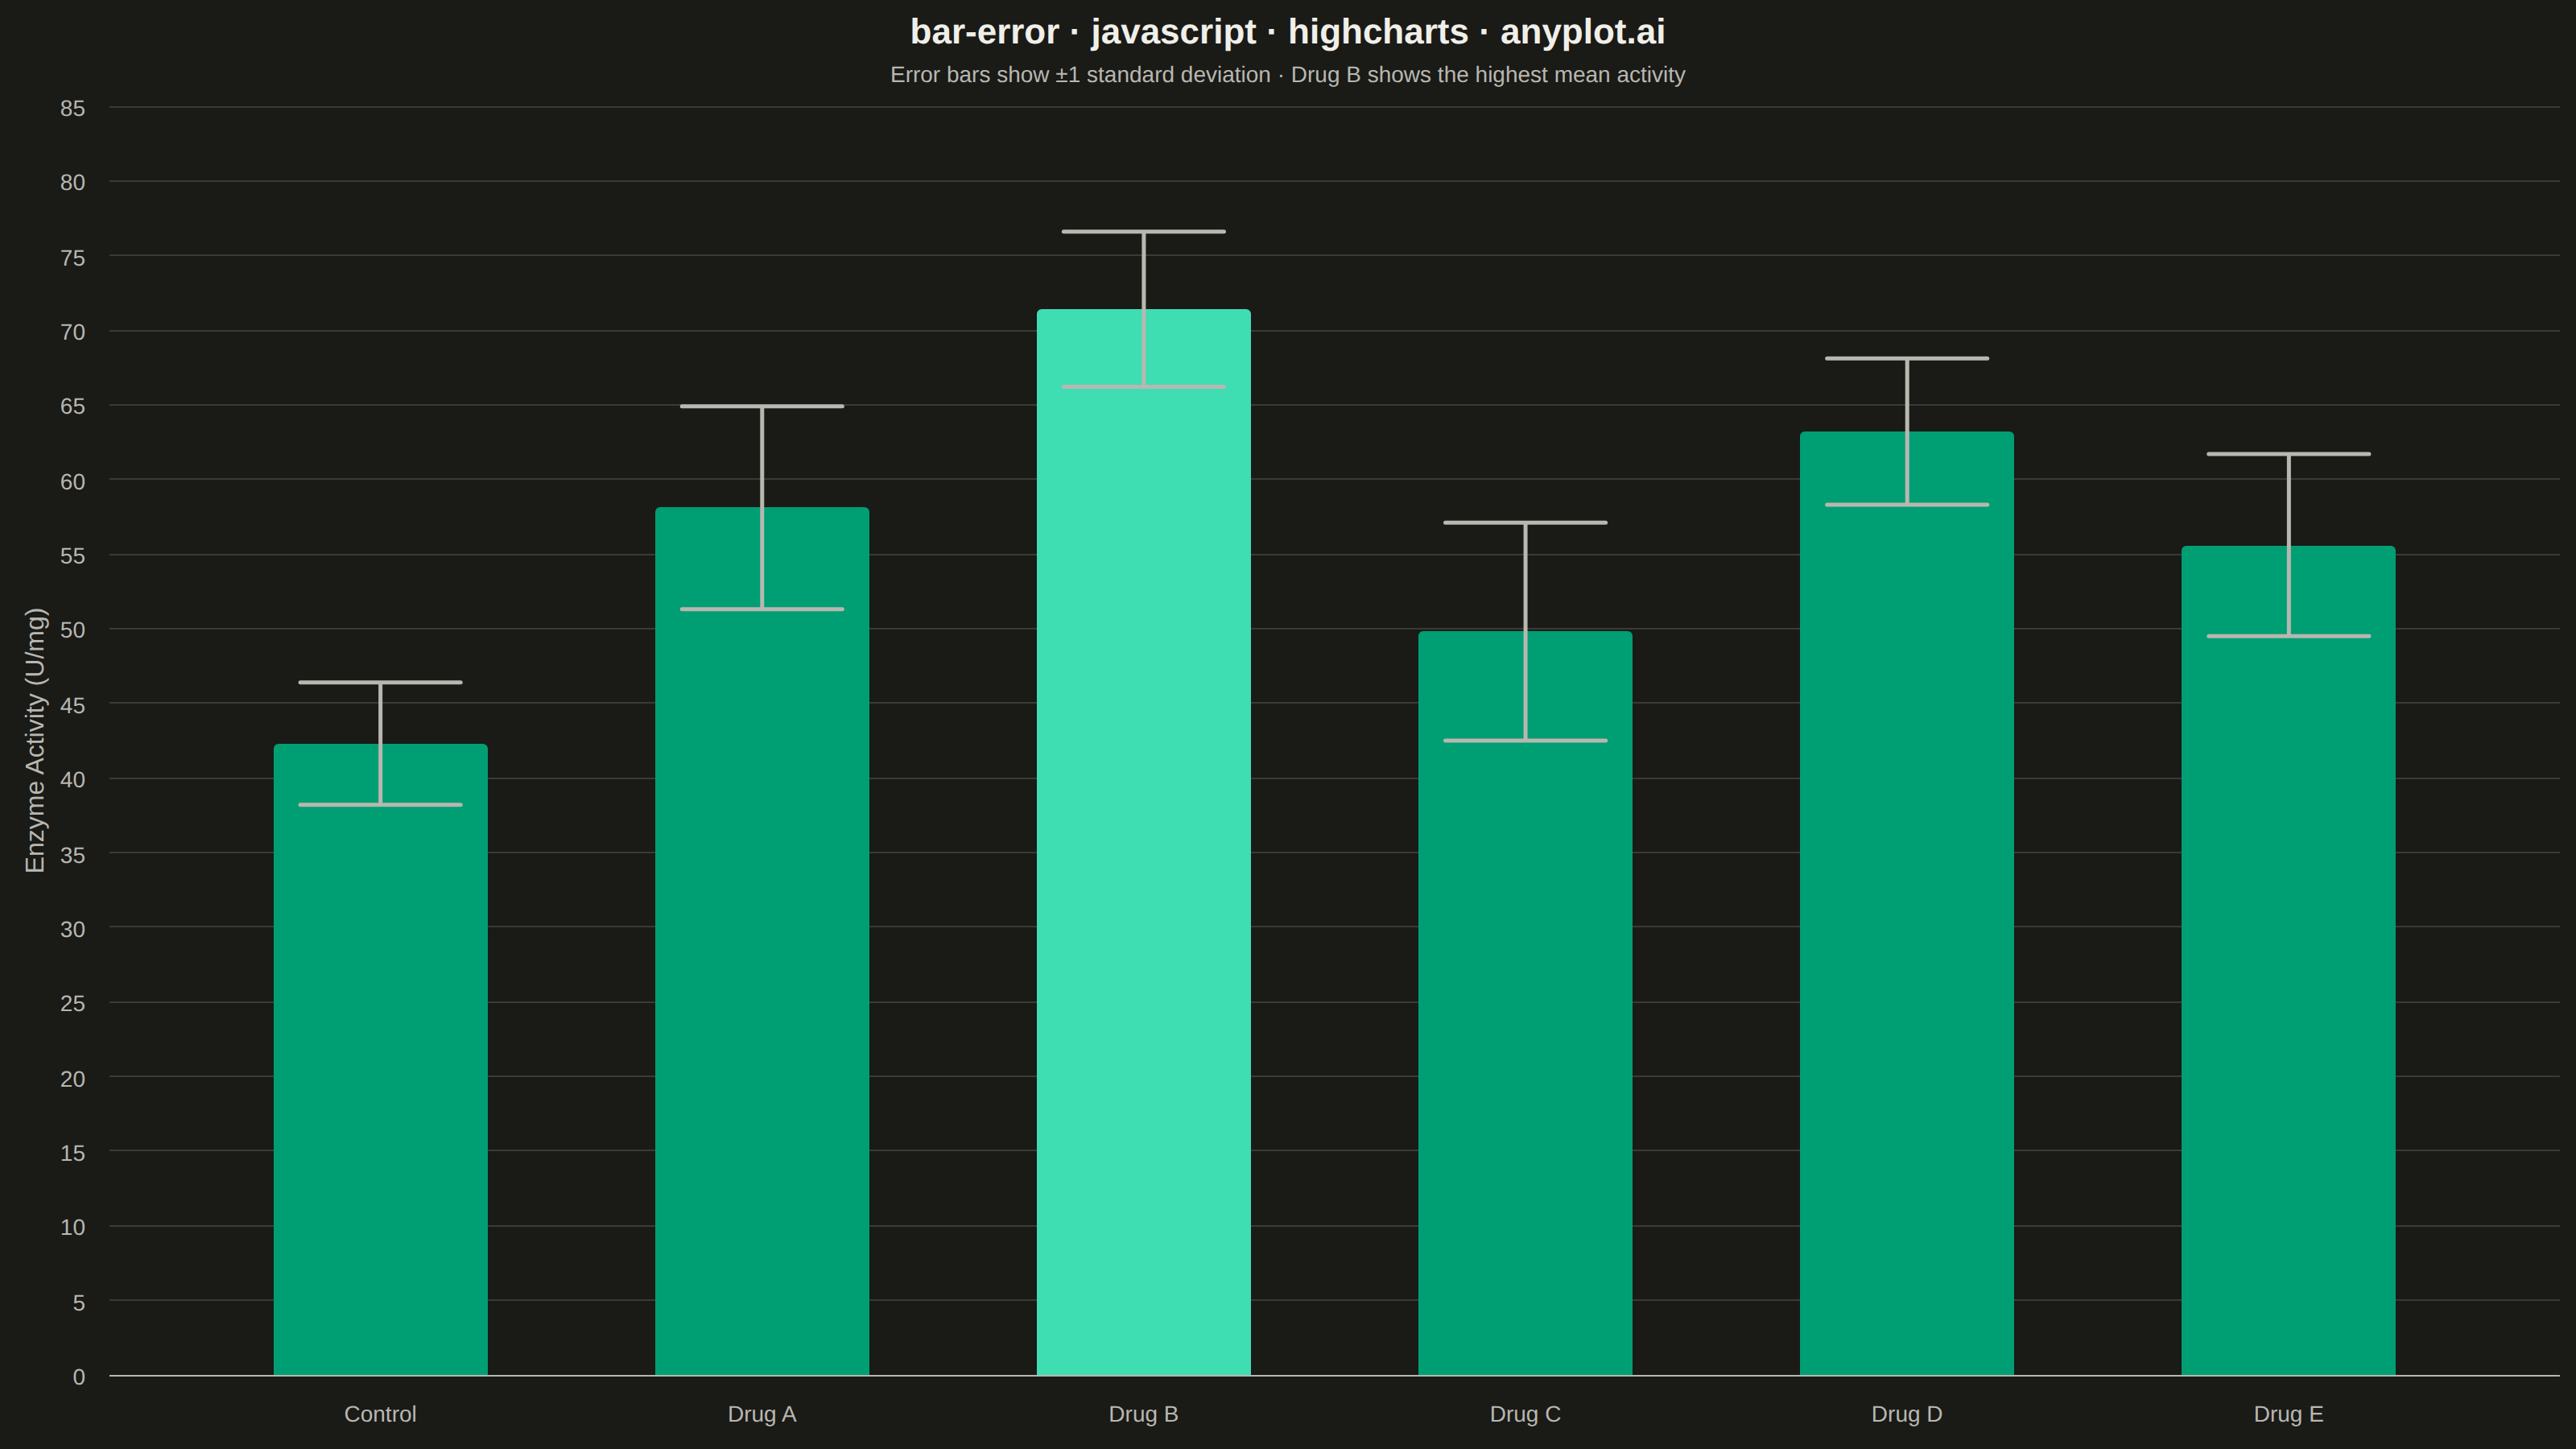
A bar chart with error bars displays categorical data as rectangular bars with vertical (or horizontal) lines extending from each bar to indicate uncertainty or variability. Error bars typically represent standard deviation, standard error, confidence intervals, or min/max ranges. This visualization is essential for comparing group means while communicating the reliability and precision of each measurement.
// anyplot.ai
// bar-error: Bar Chart with Error Bars
// Library: highcharts 12.6.0 | JavaScript 22.23.2
// Quality: 91/100 | Created: 2026-09-02

const t = window.ANYPLOT_TOKENS;

// --- Data (in-memory, deterministic) ----------------------------------------
const categories = ["Control", "Drug A", "Drug B", "Drug C", "Drug D", "Drug E"];
const meanActivity = [42.3, 58.1, 71.4, 49.8, 63.2, 55.6];
const stdDev = [4.1, 6.8, 5.2, 7.3, 4.9, 6.1];

const peakIndex = meanActivity.indexOf(Math.max(...meanActivity));
const peakColor = Highcharts.color(t.palette[0]).brighten(0.25).get();
const columnData = meanActivity.map((y, i) => ({
  y,
  color: i === peakIndex ? peakColor : t.palette[0],
}));

// Only the core Highcharts bundle is loaded (no highcharts-more), so the
// errorbar series type isn't available. Error bars are composed instead from
// a plain "line" series: a vertical whisker plus top/bottom caps per category,
// each segment separated by a null-y gap point so they don't connect to each
// other. The gap points still carry an explicit `x` — a bare `null` array
// entry has no x, and Highcharts then auto-indexes it sequentially, which
// silently stretches the category axis with phantom trailing categories.
//
// Cap width is derived from the column's own geometry (point/group padding)
// rather than a hand-picked constant, so the caps stay visually proportioned
// to the bar beneath them at ~75% of the column's rendered width.
const POINT_PADDING = 0.15;
const GROUP_PADDING = 0.1;
const BAR_HALF_WIDTH = ((1 - 2 * GROUP_PADDING) * (1 - 2 * POINT_PADDING)) / 2;
const CAP_HALF_WIDTH = BAR_HALF_WIDTH * 0.75;
const errorBarData = [];
categories.forEach((_, i) => {
  const low = meanActivity[i] - stdDev[i];
  const high = meanActivity[i] + stdDev[i];
  errorBarData.push(
    { x: i - CAP_HALF_WIDTH, y: high },
    { x: i + CAP_HALF_WIDTH, y: high },
    { x: i, y: null },
    { x: i, y: high },
    { x: i, y: low },
    { x: i, y: null },
    { x: i - CAP_HALF_WIDTH, y: low },
    { x: i + CAP_HALF_WIDTH, y: low },
    { x: i, y: null },
  );
});

// --- Chart -------------------------------------------------------------------
Highcharts.chart("container", {
  chart: {
    type: "column",
    backgroundColor: "transparent",
    animation: false,
    style: { fontFamily: "inherit" },
  },
  credits: { enabled: false },
  colors: t.palette,
  title: {
    text: "bar-error · javascript · highcharts · anyplot.ai",
    style: { color: t.ink, fontSize: "22px", fontWeight: "600" },
  },
  subtitle: {
    text: `Error bars show ±1 standard deviation · ${categories[peakIndex]} shows the highest mean activity`,
    style: { color: t.inkSoft, fontSize: "14px" },
  },
  xAxis: {
    categories,
    lineColor: t.inkSoft,
    tickColor: t.inkSoft,
    labels: { style: { color: t.inkSoft, fontSize: "14px" } },
  },
  yAxis: {
    title: { text: "Enzyme Activity (U/mg)", style: { color: t.inkSoft, fontSize: "16px" } },
    gridLineColor: t.grid,
    labels: { style: { color: t.inkSoft, fontSize: "14px" } },
  },
  legend: { enabled: false },
  plotOptions: {
    series: { animation: false },
    column: {
      borderWidth: 0,
      borderRadius: 3,
      pointPadding: POINT_PADDING,
      groupPadding: GROUP_PADDING,
    },
  },
  series: [
    {
      name: "Enzyme activity",
      type: "column",
      data: columnData,
      showInLegend: false,
    },
    {
      name: "±1 SD",
      type: "line",
      data: errorBarData,
      color: t.inkSoft,
      lineWidth: 2.5,
      marker: { enabled: false },
      enableMouseTracking: false,
      showInLegend: false,
    },
  ],
});
Runnable source as JSON, for any HTTP client: https://api.anyplot.ai/specs/bar-error/highcharts/code. Any spec id and library id listed in llms-full.txt fit the same URL shape; every URL below is complete and callable.
{
  "spec_id": "bar-error",
  "language": "javascript",
  "library": "highcharts",
  "page": "https://anyplot.ai/bar-error/javascript/highcharts",
  "hub": "https://anyplot.ai/bar-error",
  "code_json": "https://api.anyplot.ai/specs/bar-error/highcharts/code",
  "spec_json": "https://api.anyplot.ai/specs/bar-error",
  "render_light_png": "https://storage.googleapis.com/anyplot-images/plots/bar-error/javascript/highcharts/plot-light.png",
  "render_dark_png": "https://storage.googleapis.com/anyplot-images/plots/bar-error/javascript/highcharts/plot-dark.png",
  "interactive_light_html": "https://storage.googleapis.com/anyplot-images/plots/bar-error/javascript/highcharts/plot-light.html",
  "interactive_dark_html": "https://storage.googleapis.com/anyplot-images/plots/bar-error/javascript/highcharts/plot-dark.html",
  "quality_score": 91.0,
  "license": "MIT",
  "guide": "https://anyplot.ai/llms.txt"
}
Part of Bar Chart with Error Bars on anyplot.ai.