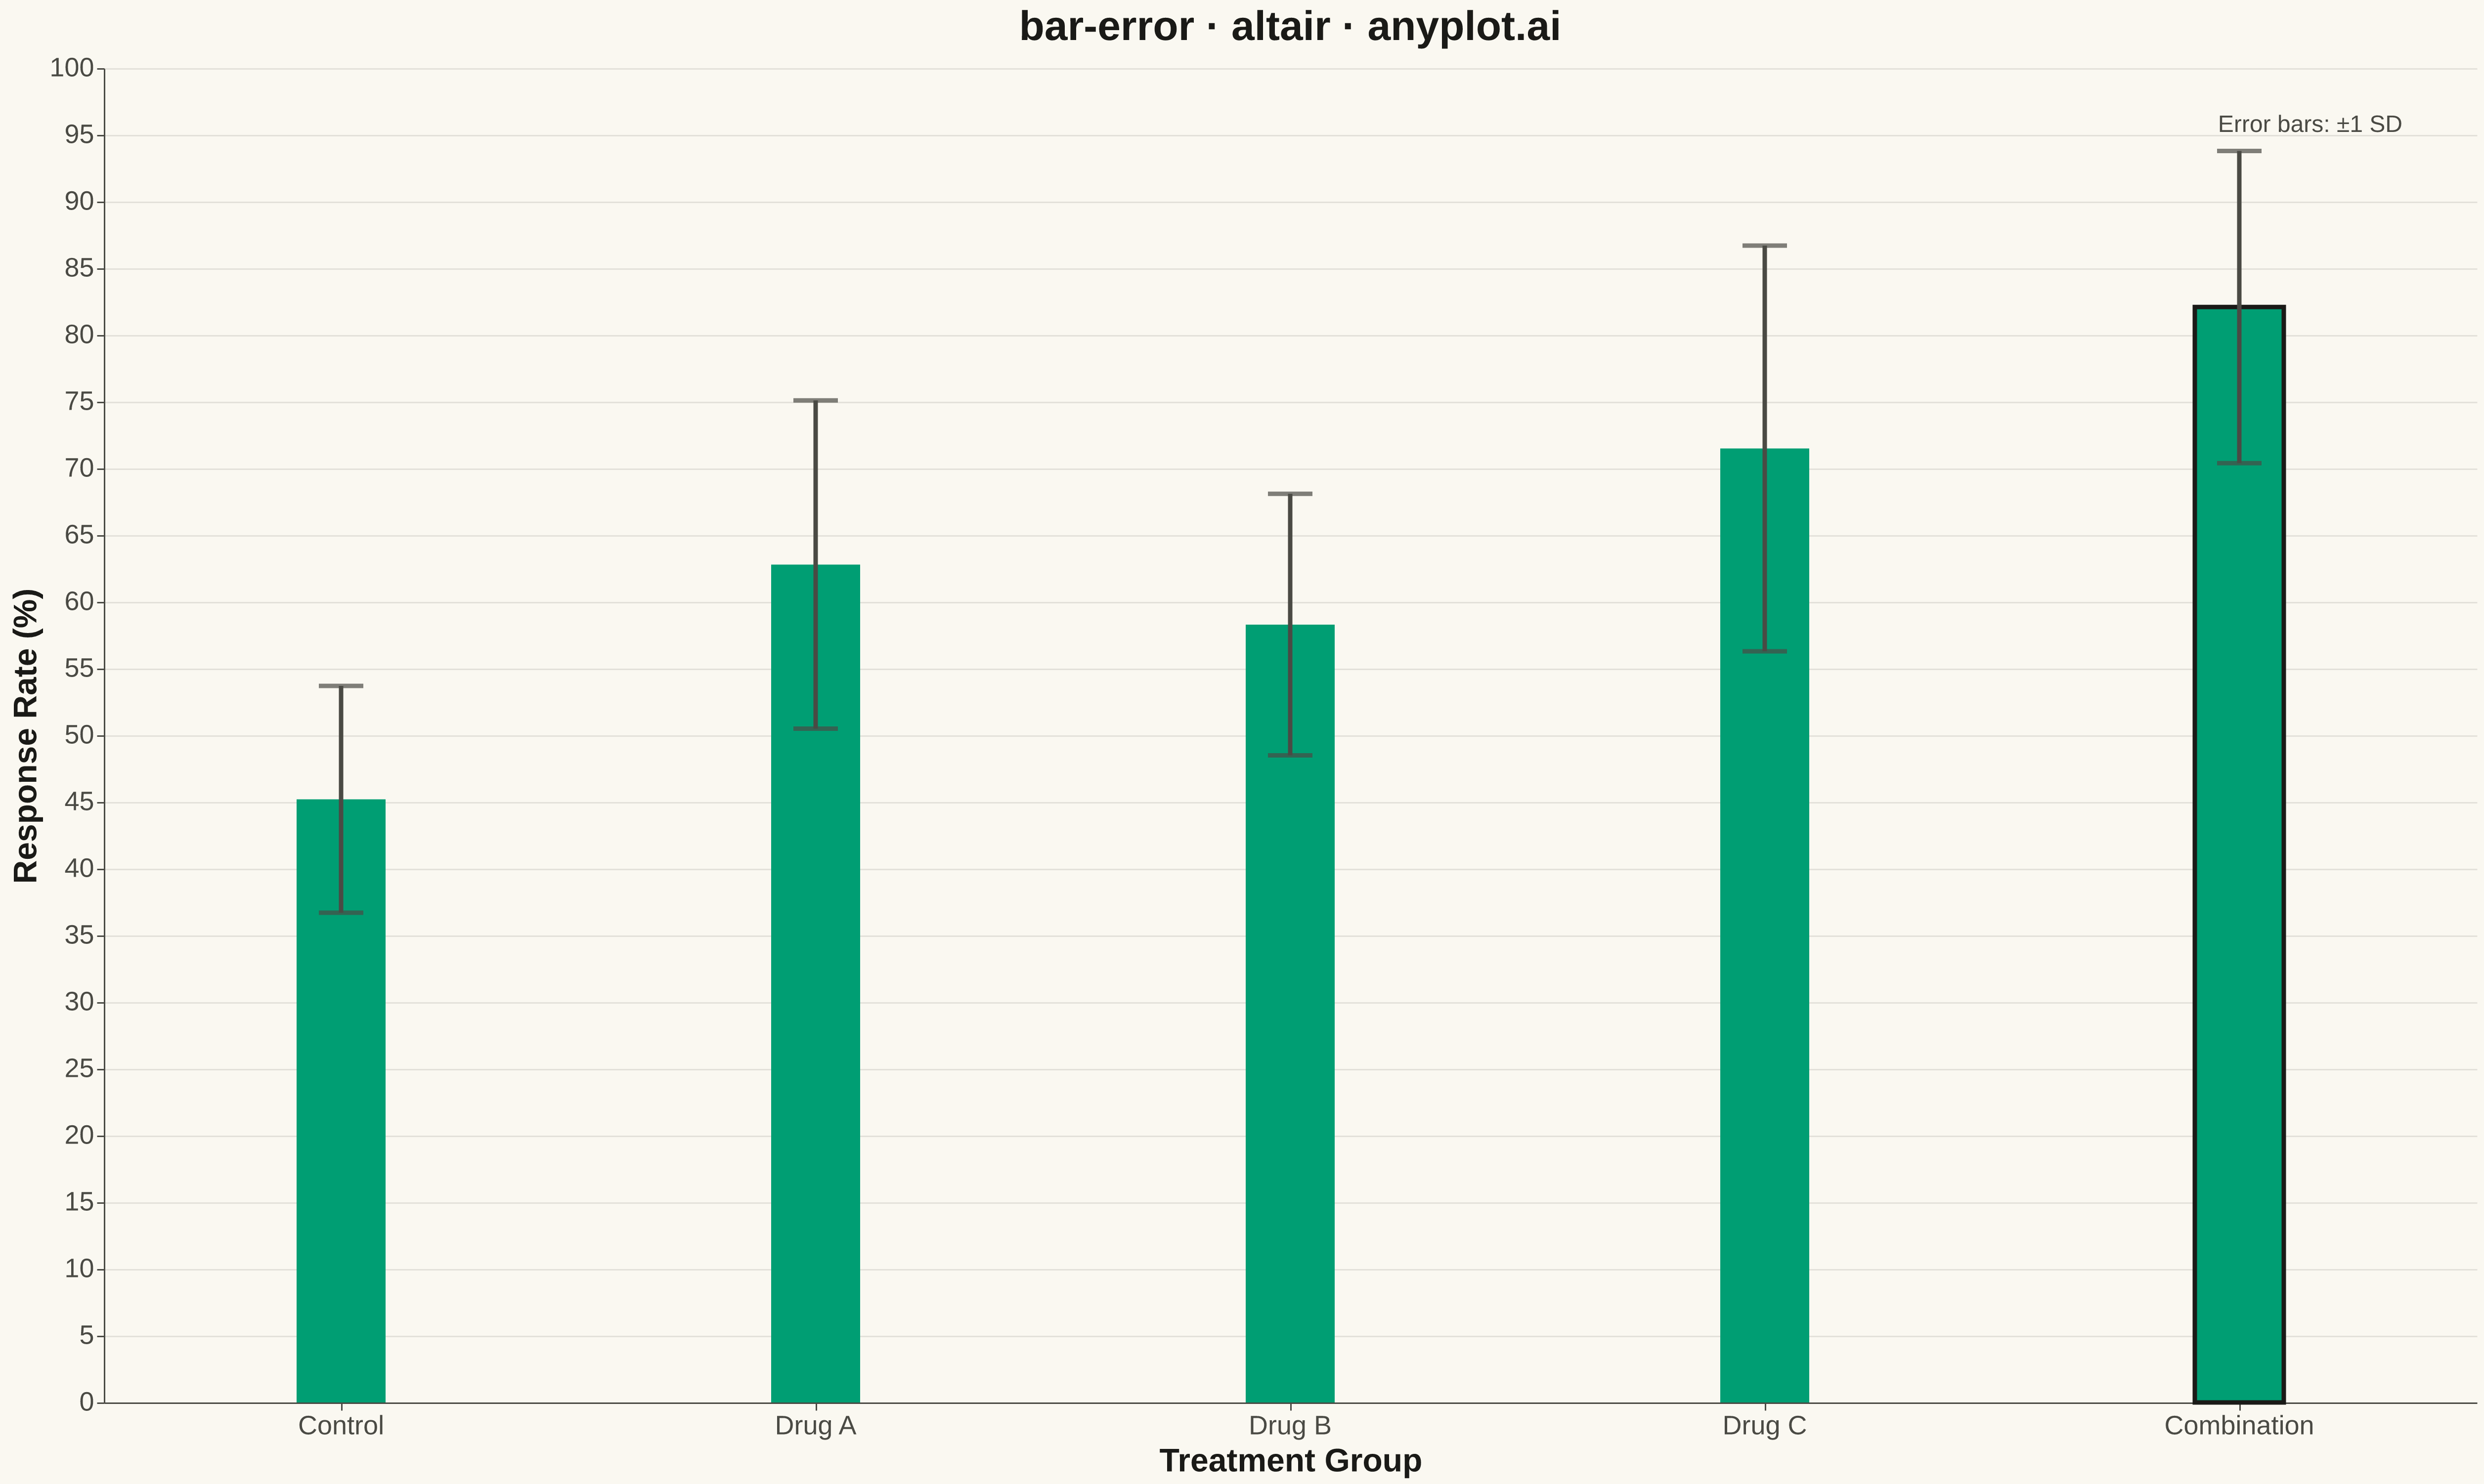
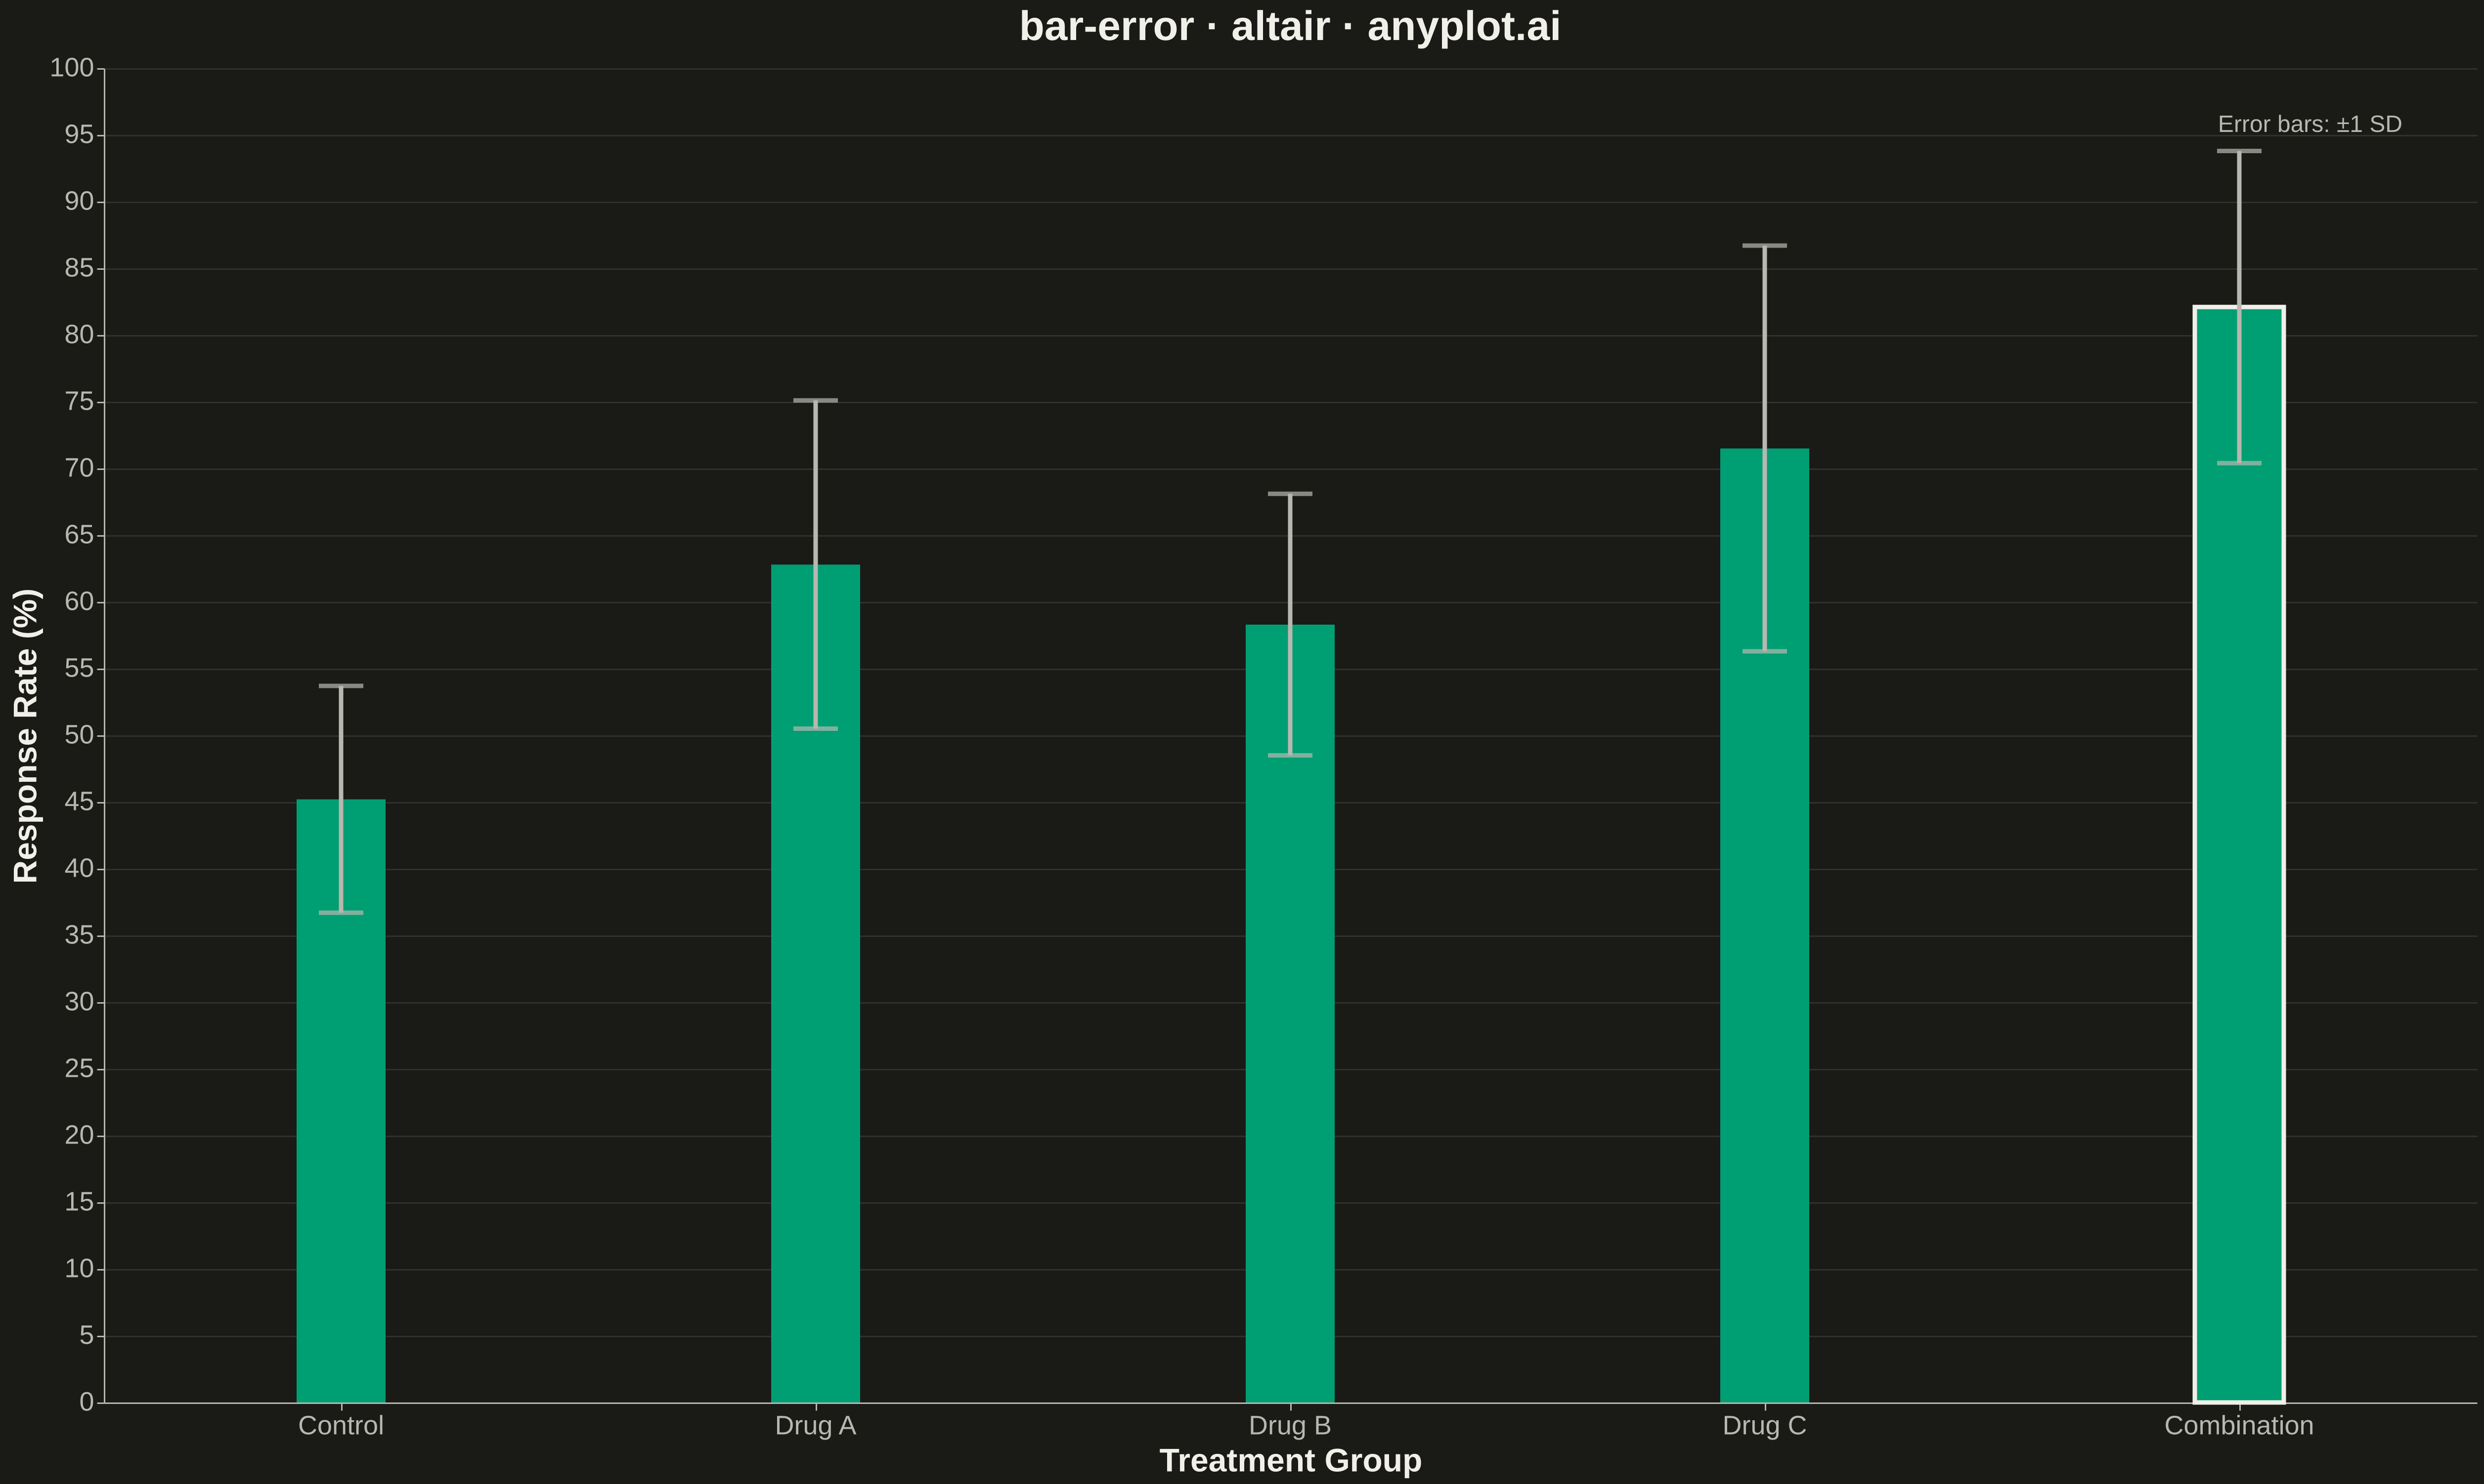
A bar chart with error bars displays categorical data as rectangular bars with vertical (or horizontal) lines extending from each bar to indicate uncertainty or variability. Error bars typically represent standard deviation, standard error, confidence intervals, or min/max ranges. This visualization is essential for comparing group means while communicating the reliability and precision of each measurement.
""" anyplot.ai
bar-error: Bar Chart with Error Bars
Library: altair 6.1.0 | Python 3.13.13
Quality: 91/100 | Updated: 2026-05-10
"""

import os
import sys


sys.path.insert(0, "/home/runner/work/anyplot/anyplot/.venv/lib/python3.13/site-packages")

import altair as alt
import pandas as pd


THEME = os.getenv("ANYPLOT_THEME", "light")
PAGE_BG = "#FAF8F1" if THEME == "light" else "#1A1A17"
ELEVATED_BG = "#FFFDF6" if THEME == "light" else "#242420"
INK = "#1A1A17" if THEME == "light" else "#F0EFE8"
INK_SOFT = "#4A4A44" if THEME == "light" else "#B8B7B0"
BRAND = "#009E73"

# Data - Treatment comparison with measurement variability (±1 SD)
treatment_order = ["Control", "Drug A", "Drug B", "Drug C", "Combination"]
data = pd.DataFrame(
    {"treatment": treatment_order, "response": [45.2, 62.8, 58.3, 71.5, 82.1], "error": [8.5, 12.3, 9.8, 15.2, 11.7]}
)

# Calculate error bar bounds
data["lower"] = data["response"] - data["error"]
data["upper"] = data["response"] + data["error"]

# Create bars with brand color
bars = (
    alt.Chart(data)
    .mark_bar(size=60, color=BRAND)
    .encode(
        x=alt.X(
            "treatment:N",
            title="Treatment Group",
            sort=treatment_order,
            axis=alt.Axis(labelFontSize=18, titleFontSize=22, labelAngle=0),
        ),
        y=alt.Y(
            "response:Q",
            title="Response Rate (%)",
            scale=alt.Scale(domain=[0, 100]),
            axis=alt.Axis(labelFontSize=18, titleFontSize=22),
        ),
        tooltip=[
            "treatment:N",
            alt.Tooltip("response:Q", format=".1f"),
            alt.Tooltip("error:Q", format=".1f", title="±SD"),
        ],
    )
)

# Create error bars with caps using rule marks
error_bars = (
    alt.Chart(data)
    .mark_rule(strokeWidth=3, color=INK_SOFT)
    .encode(x=alt.X("treatment:N", sort=treatment_order), y="lower:Q", y2="upper:Q")
)

# Error bar caps (top)
caps_top = (
    alt.Chart(data)
    .mark_tick(size=30, thickness=3, color=INK_SOFT)
    .encode(x=alt.X("treatment:N", sort=treatment_order), y="upper:Q")
)

# Error bar caps (bottom)
caps_bottom = (
    alt.Chart(data)
    .mark_tick(size=30, thickness=3, color=INK_SOFT)
    .encode(x=alt.X("treatment:N", sort=treatment_order), y="lower:Q")
)

# Annotation for error bar meaning
annotation = (
    alt.Chart(pd.DataFrame({"text": ["Error bars: ±1 SD"]}))
    .mark_text(align="right", baseline="top", fontSize=16, color=INK_SOFT)
    .encode(x=alt.value(1550), y=alt.value(30), text="text:N")
)

# Combine all layers
chart = (
    alt.layer(bars, error_bars, caps_top, caps_bottom, annotation)
    .properties(
        width=1600,
        height=900,
        background=PAGE_BG,
        title=alt.Title("bar-error · altair · anyplot.ai", fontSize=28, anchor="middle", color=INK),
    )
    .configure_view(fill=PAGE_BG, stroke=None)
    .configure_axis(
        domainColor=INK_SOFT, tickColor=INK_SOFT, gridColor=INK, gridOpacity=0.10, labelColor=INK_SOFT, titleColor=INK
    )
    .configure_legend(fillColor=ELEVATED_BG, strokeColor=INK_SOFT, labelColor=INK_SOFT, titleColor=INK)
)

# Save as PNG (1600 × 900 × 3 = 4800 × 2700)
chart.save(f"plot-{THEME}.png", scale_factor=3.0)

# Save as HTML for interactivity
chart.save(f"plot-{THEME}.html")
Runnable source as JSON, for any HTTP client: https://api.anyplot.ai/specs/bar-error/altair/code. Any spec id and library id listed in llms-full.txt fit the same URL shape; every URL below is complete and callable.
{
  "spec_id": "bar-error",
  "language": "python",
  "library": "altair",
  "page": "https://anyplot.ai/bar-error/python/altair",
  "hub": "https://anyplot.ai/bar-error",
  "code_json": "https://api.anyplot.ai/specs/bar-error/altair/code",
  "spec_json": "https://api.anyplot.ai/specs/bar-error",
  "render_light_png": "https://storage.googleapis.com/anyplot-images/plots/bar-error/python/altair/plot-light.png",
  "render_dark_png": "https://storage.googleapis.com/anyplot-images/plots/bar-error/python/altair/plot-dark.png",
  "interactive_light_html": "https://storage.googleapis.com/anyplot-images/plots/bar-error/python/altair/plot-light.html",
  "interactive_dark_html": "https://storage.googleapis.com/anyplot-images/plots/bar-error/python/altair/plot-dark.html",
  "quality_score": 91.0,
  "license": "MIT",
  "guide": "https://anyplot.ai/llms.txt"
}
Part of Bar Chart with Error Bars on anyplot.ai.