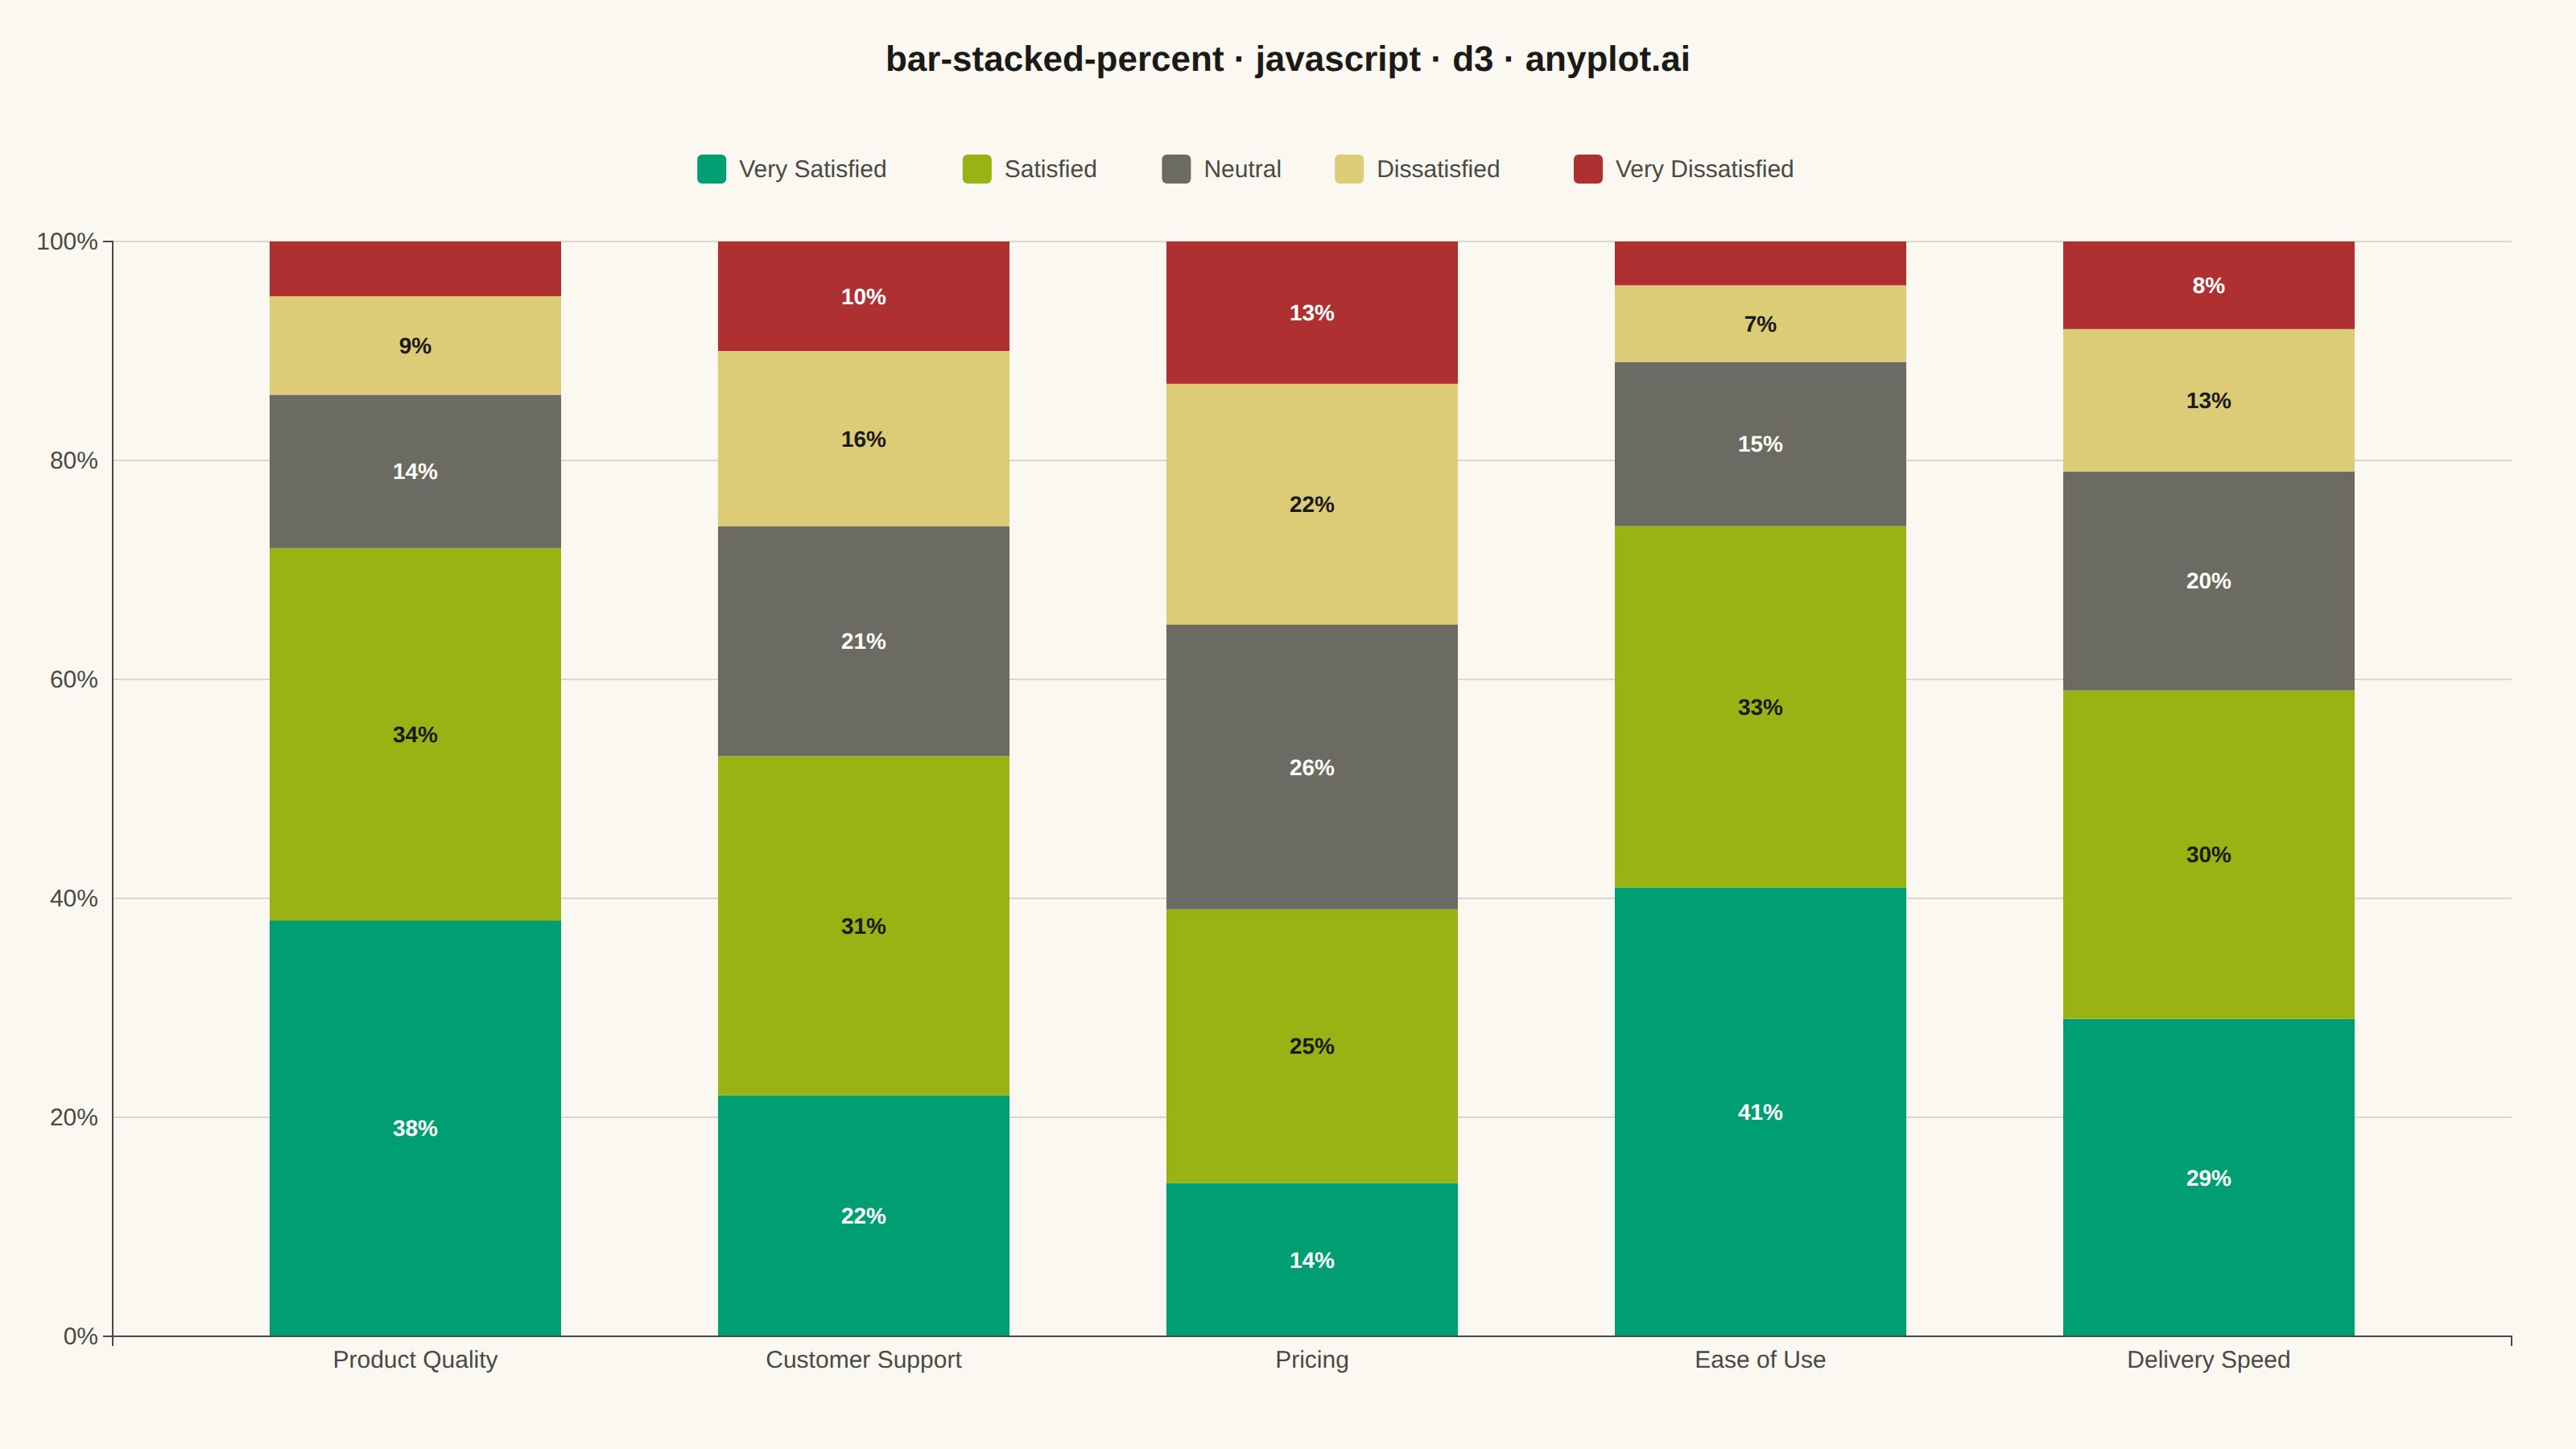
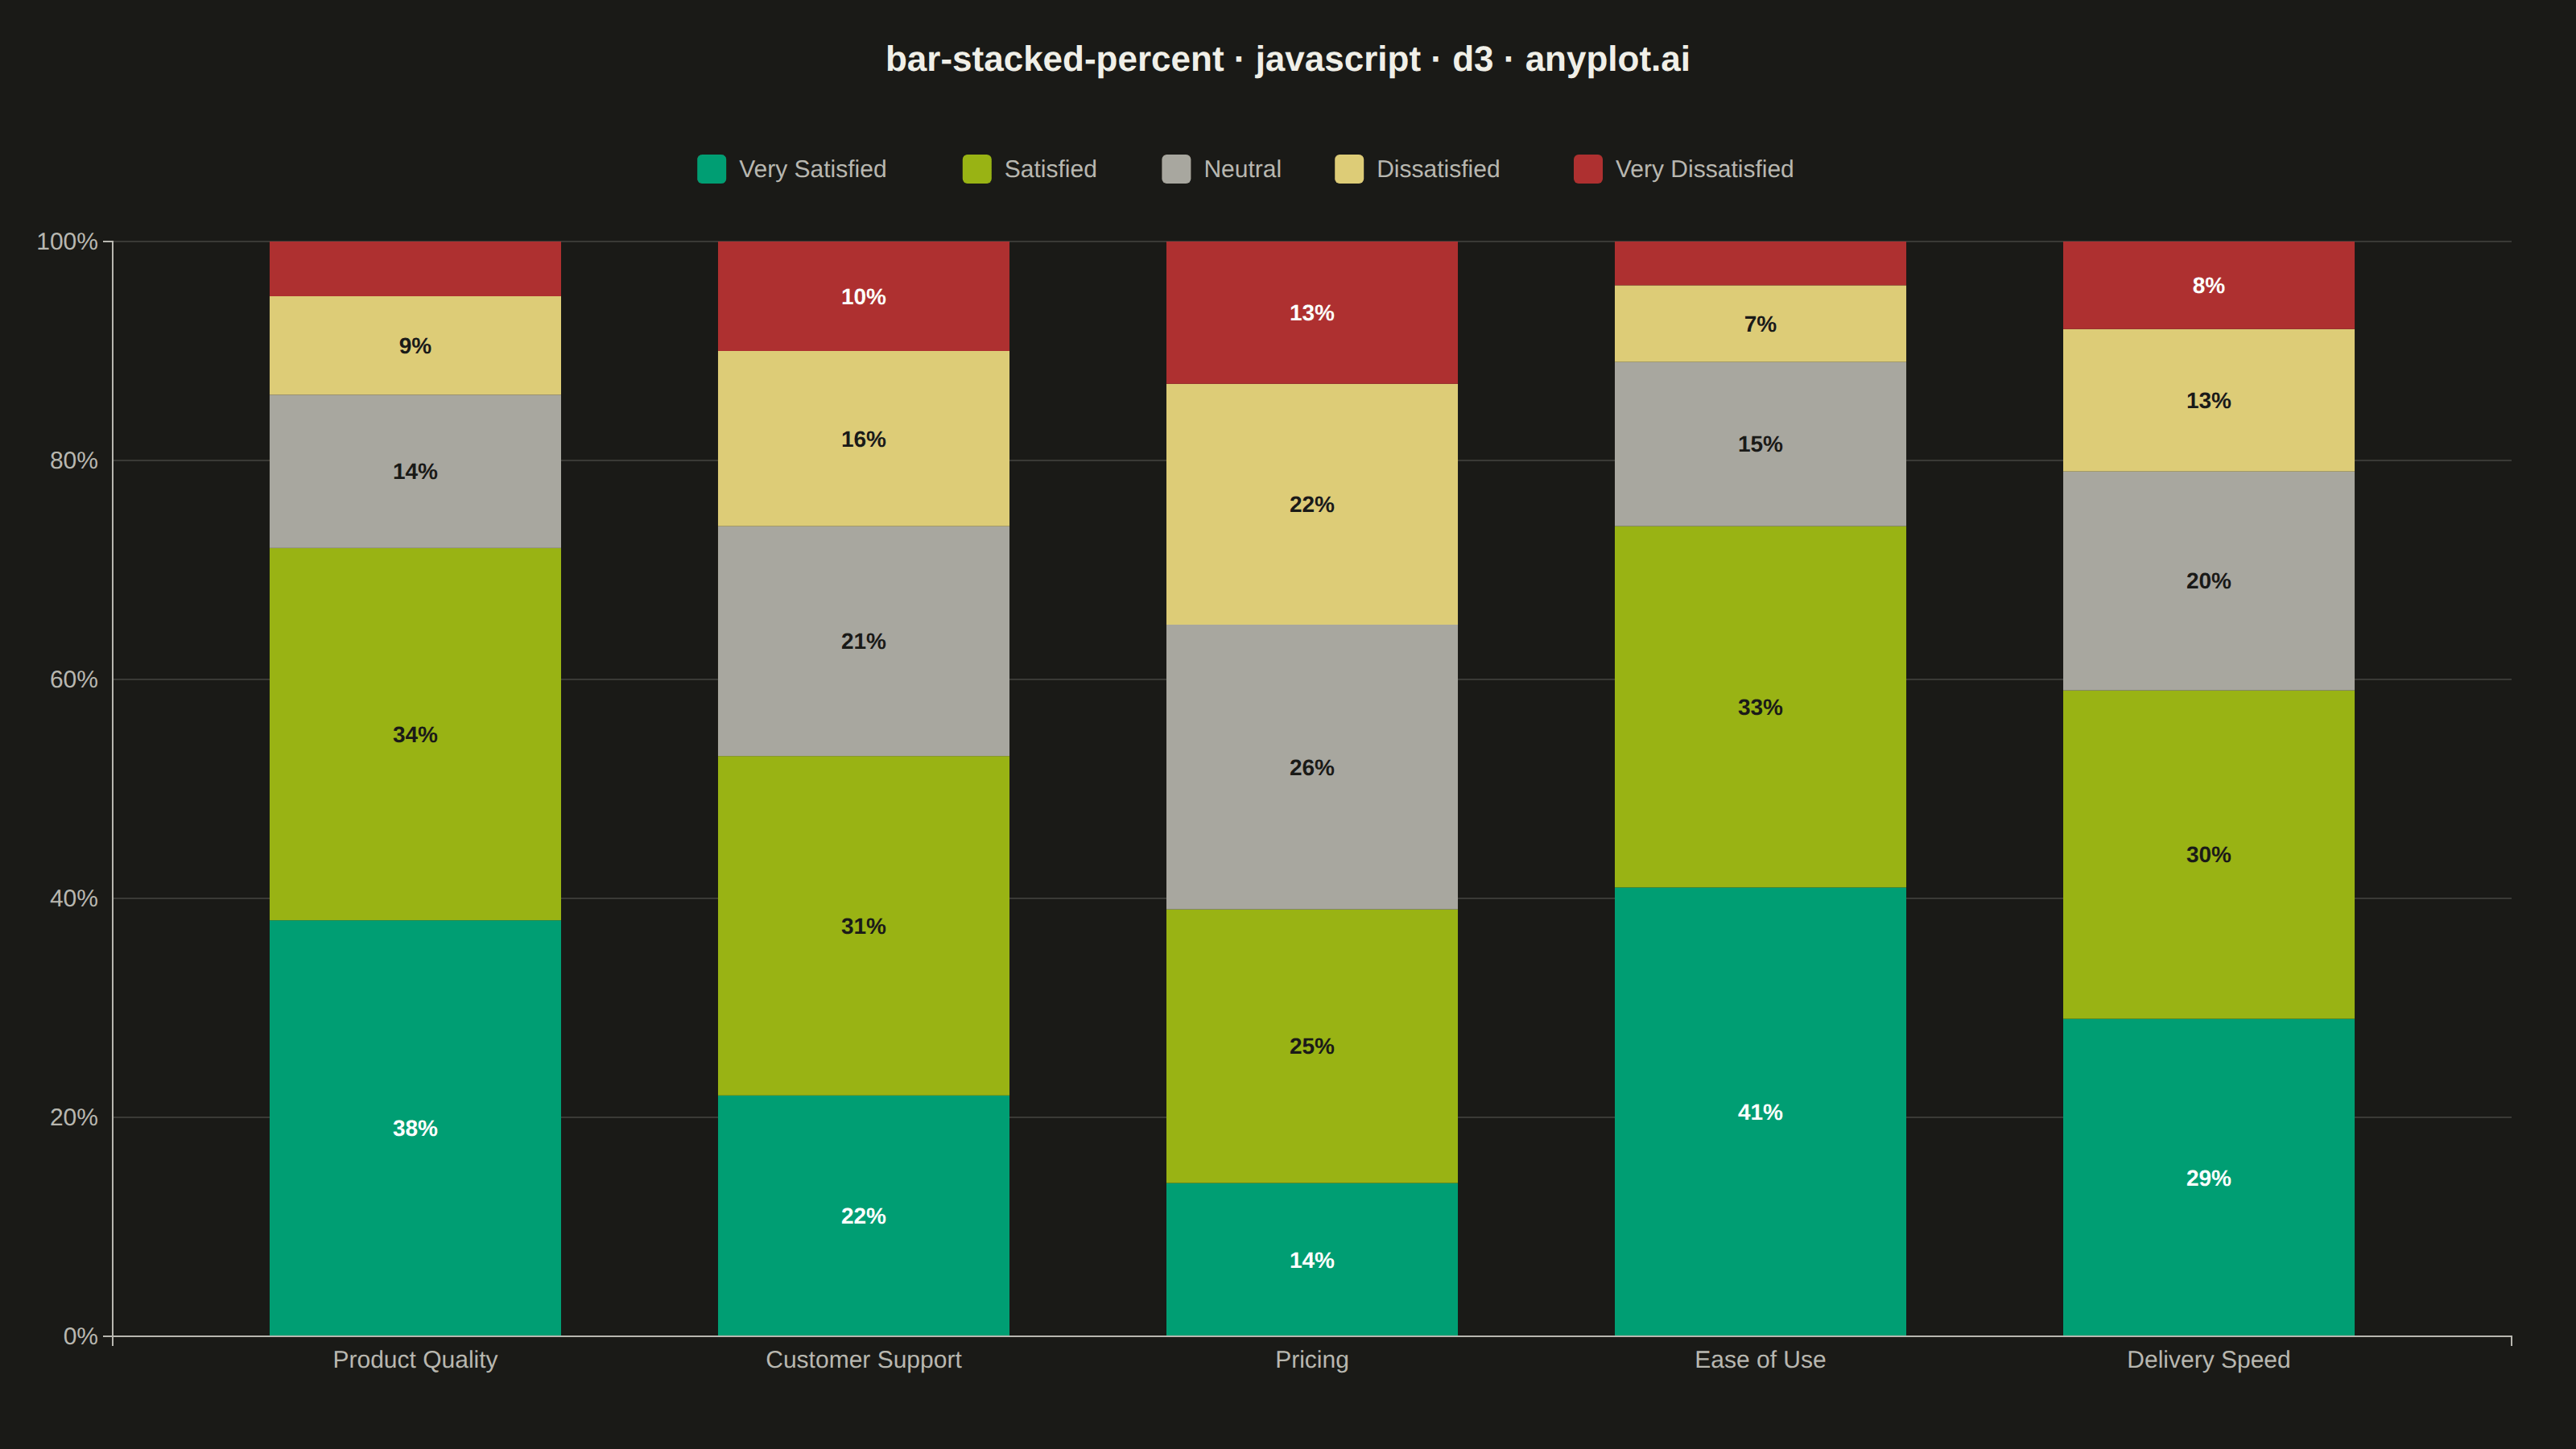
The same plot in 14 other libraries — JavaScript: Chart.js, Apache ECharts, Highcharts, MUI X Charts; Python: Altair, Bokeh, lets-plot, Matplotlib, Plotly, plotnine, Pygal, Seaborn; R: ggplot2; Julia: Makie.jl. Compare all 15 side by side: 100% Stacked Bar Chart in Python, R, Julia and JavaScript.
A 100% stacked bar chart displays multiple data series as proportional segments within each bar, where every bar is normalized to sum to 100%. This visualization emphasizes composition and relative proportions rather than absolute values, making it ideal for comparing how different components contribute to a whole across categories. It reveals patterns in distribution and share that might be obscured when absolute values vary significantly between categories.
// anyplot.ai
// bar-stacked-percent: 100% Stacked Bar Chart
// Library: d3 7.9.0 | JavaScript 22.23.2
// Quality: 92/100 | Created: 2026-08-18

const t = window.ANYPLOT_TOKENS;
const { width, height } = window.ANYPLOT_SIZE;
const muted = t.theme === "light" ? "#6B6A63" : "#A8A79F";

// --- Data (in-memory, deterministic) ----------------------------------------
// Product-survey satisfaction breakdown per question, raw response counts.
const components = [
  "Very Satisfied",
  "Satisfied",
  "Neutral",
  "Dissatisfied",
  "Very Dissatisfied",
];
const data = [
  {
    category: "Product Quality",
    "Very Satisfied": 38,
    Satisfied: 34,
    Neutral: 14,
    Dissatisfied: 9,
    "Very Dissatisfied": 5,
  },
  {
    category: "Customer Support",
    "Very Satisfied": 22,
    Satisfied: 31,
    Neutral: 21,
    Dissatisfied: 16,
    "Very Dissatisfied": 10,
  },
  {
    category: "Pricing",
    "Very Satisfied": 14,
    Satisfied: 25,
    Neutral: 26,
    Dissatisfied: 22,
    "Very Dissatisfied": 13,
  },
  {
    category: "Ease of Use",
    "Very Satisfied": 41,
    Satisfied: 33,
    Neutral: 15,
    Dissatisfied: 7,
    "Very Dissatisfied": 4,
  },
  {
    category: "Delivery Speed",
    "Very Satisfied": 29,
    Satisfied: 30,
    Neutral: 20,
    Dissatisfied: 13,
    "Very Dissatisfied": 8,
  },
];

// Sentiment colors: positive -> green family, neutral -> muted, negative -> amber/red.
const color = d3
  .scaleOrdinal()
  .domain(components)
  .range([t.palette[0], t.palette[7], muted, t.amber, t.palette[4]]);

// Text color per segment stays legible against its own fill in both themes.
const labelColor = {
  "Very Satisfied": "#FFFFFF",
  Satisfied: "#1A1A17",
  Neutral: t.theme === "light" ? "#FFFDF6" : "#1A1A17",
  Dissatisfied: "#1A1A17",
  "Very Dissatisfied": "#FFFFFF",
};

const stacked = d3.stack().keys(components).offset(d3.stackOffsetExpand)(data);

// --- Layout -------------------------------------------------------------------
const margin = { top: 150, right: 40, bottom: 70, left: 70 };
const iw = width - margin.left - margin.right;
const ih = height - margin.top - margin.bottom;

// --- SVG mount ----------------------------------------------------------------
const svg = d3
  .select("#container")
  .append("svg")
  .attr("width", width)
  .attr("height", height);
const g = svg
  .append("g")
  .attr("transform", `translate(${margin.left},${margin.top})`);

// --- Scales ---------------------------------------------------------------
const x = d3
  .scaleBand()
  .domain(data.map((d) => d.category))
  .range([0, iw])
  .padding(0.35);
const y = d3.scaleLinear().domain([0, 1]).range([ih, 0]);

// --- Gridlines (y-axis only) ------------------------------------------------
g.append("g")
  .selectAll("line")
  .data(y.ticks(4))
  .join("line")
  .attr("x1", 0)
  .attr("x2", iw)
  .attr("y1", (d) => y(d))
  .attr("y2", (d) => y(d))
  .attr("stroke", t.grid)
  .attr("stroke-width", 1);

// --- Stacked bars ------------------------------------------------------------
const layers = g
  .selectAll(".layer")
  .data(stacked)
  .join("g")
  .attr("fill", (d) => color(d.key));

layers
  .selectAll("rect")
  .data((d) => d)
  .join("rect")
  .attr("x", (d) => x(d.data.category))
  .attr("y", (d) => y(d[1]))
  .attr("width", x.bandwidth())
  .attr("height", (d) => y(d[0]) - y(d[1]));

// --- Percentage labels (only where a segment has room) ----------------------
layers.each(function (series) {
  d3.select(this)
    .selectAll("text")
    .data(series.filter((d) => d[1] - d[0] >= 0.06))
    .join("text")
    .attr("x", (d) => x(d.data.category) + x.bandwidth() / 2)
    .attr("y", (d) => (y(d[0]) + y(d[1])) / 2)
    .attr("dy", "0.35em")
    .attr("text-anchor", "middle")
    .attr("fill", labelColor[series.key])
    .style("font-size", "14px")
    .style("font-weight", "600")
    .text((d) => `${Math.round((d[1] - d[0]) * 100)}%`);
});

// --- Axes ---------------------------------------------------------------------
const xAxis = g
  .append("g")
  .attr("transform", `translate(0,${ih})`)
  .call(d3.axisBottom(x));
const yAxis = g
  .append("g")
  .call(d3.axisLeft(y).ticks(4).tickFormat(d3.format(".0%")));
for (const ax of [xAxis, yAxis]) {
  ax.selectAll("text").attr("fill", t.inkSoft).style("font-size", "15px");
  ax.selectAll("line").attr("stroke", t.grid);
  ax.select(".domain").attr("stroke", t.inkSoft);
}
g.selectAll(".tick line").remove();

// --- Legend ---------------------------------------------------------------
const legend = svg.append("g").attr("text-anchor", "start");
const legendItemWidths = components.map((k) => 22 + k.length * 8.2 + 28);
const legendTotalWidth = legendItemWidths.reduce((a, b) => a + b, 0);
let legendX = (width - legendTotalWidth) / 2;
components.forEach((key, i) => {
  const item = legend.append("g").attr("transform", `translate(${legendX},96)`);
  item
    .append("rect")
    .attr("width", 18)
    .attr("height", 18)
    .attr("rx", 3)
    .attr("fill", color(key));
  item
    .append("text")
    .attr("x", 26)
    .attr("y", 14)
    .attr("fill", t.inkSoft)
    .style("font-size", "15px")
    .text(key);
  legendX += legendItemWidths[i];
});

// --- Title ------------------------------------------------------------------
svg
  .append("text")
  .attr("x", width / 2)
  .attr("y", 44)
  .attr("text-anchor", "middle")
  .attr("fill", t.ink)
  .style("font-size", "22px")
  .style("font-weight", "600")
  .text("bar-stacked-percent · javascript · d3 · anyplot.ai");
Runnable source as JSON, for any HTTP client: https://api.anyplot.ai/specs/bar-stacked-percent/d3/code. Any spec id and library id listed in llms-full.txt fit the same URL shape; every URL below is complete and callable.
{
  "spec_id": "bar-stacked-percent",
  "language": "javascript",
  "library": "d3",
  "page": "https://anyplot.ai/bar-stacked-percent/javascript/d3",
  "hub": "https://anyplot.ai/bar-stacked-percent",
  "code_json": "https://api.anyplot.ai/specs/bar-stacked-percent/d3/code",
  "spec_json": "https://api.anyplot.ai/specs/bar-stacked-percent",
  "render_light_png": "https://storage.googleapis.com/anyplot-images/plots/bar-stacked-percent/javascript/d3/plot-light.png",
  "render_dark_png": "https://storage.googleapis.com/anyplot-images/plots/bar-stacked-percent/javascript/d3/plot-dark.png",
  "interactive_light_html": "https://storage.googleapis.com/anyplot-images/plots/bar-stacked-percent/javascript/d3/plot-light.html",
  "interactive_dark_html": "https://storage.googleapis.com/anyplot-images/plots/bar-stacked-percent/javascript/d3/plot-dark.html",
  "quality_score": 92.0,
  "license": "MIT",
  "guide": "https://anyplot.ai/llms.txt"
}
Part of 100% Stacked Bar Chart on anyplot.ai.