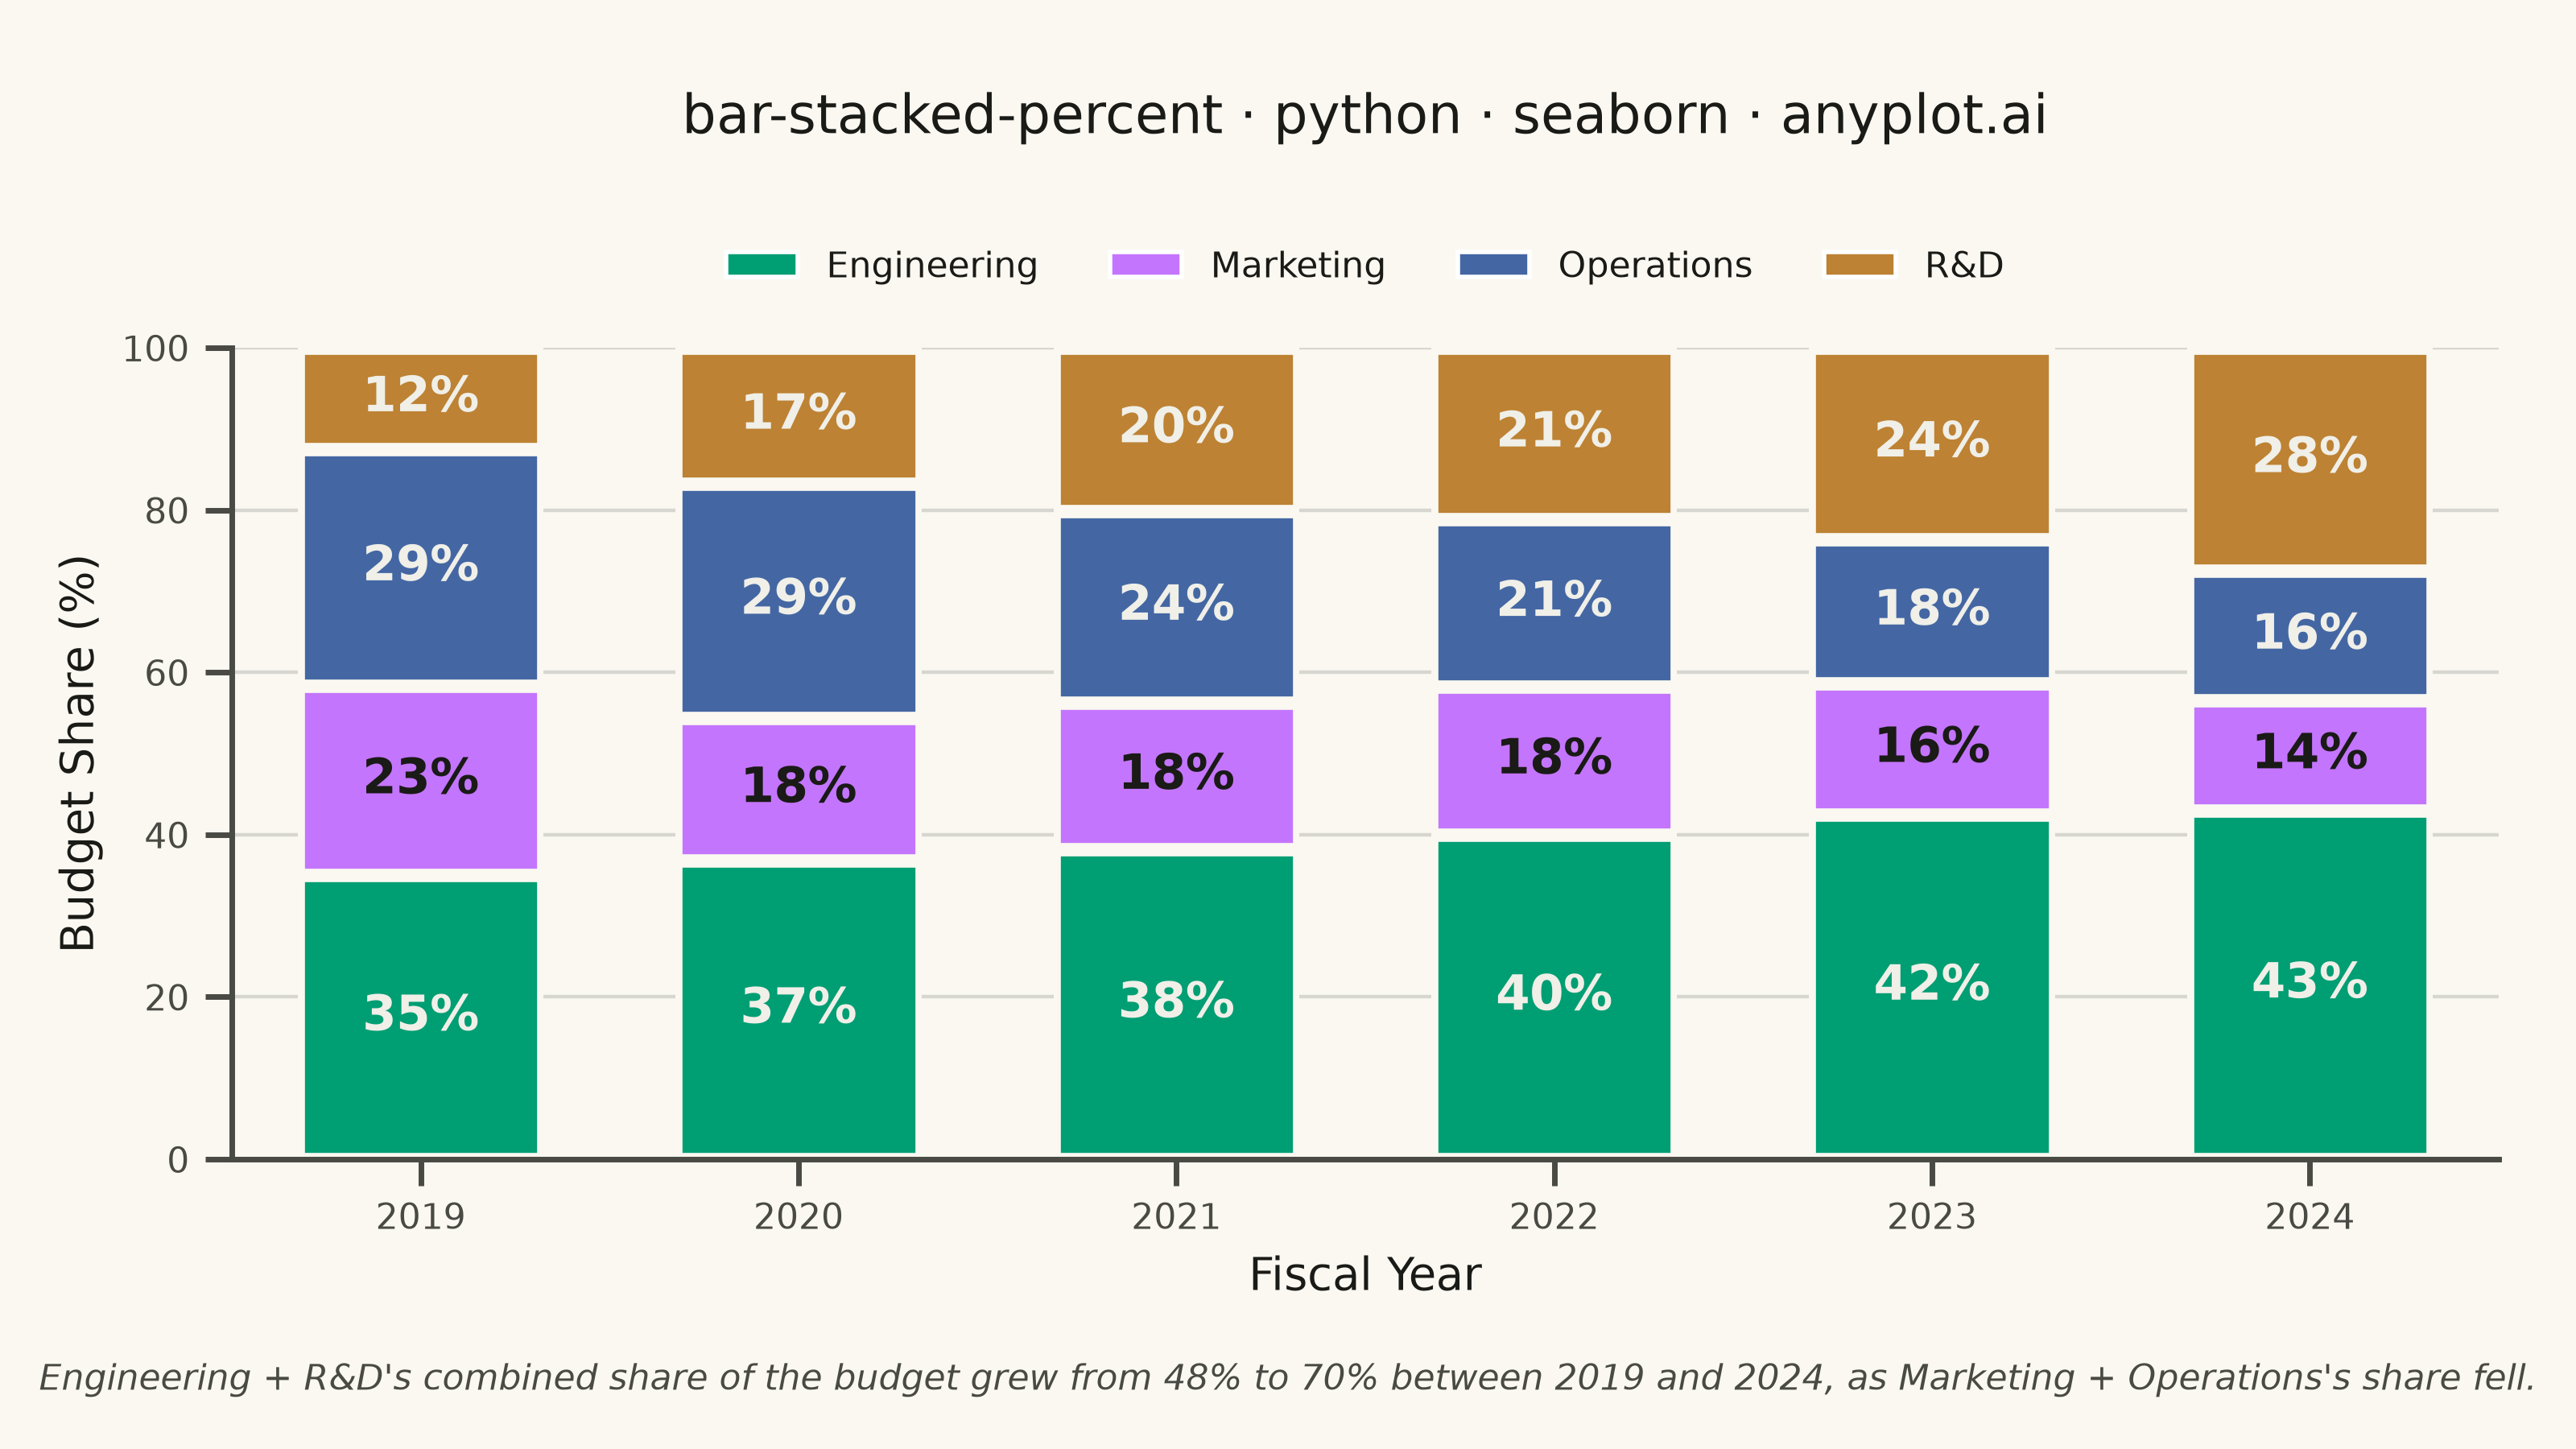
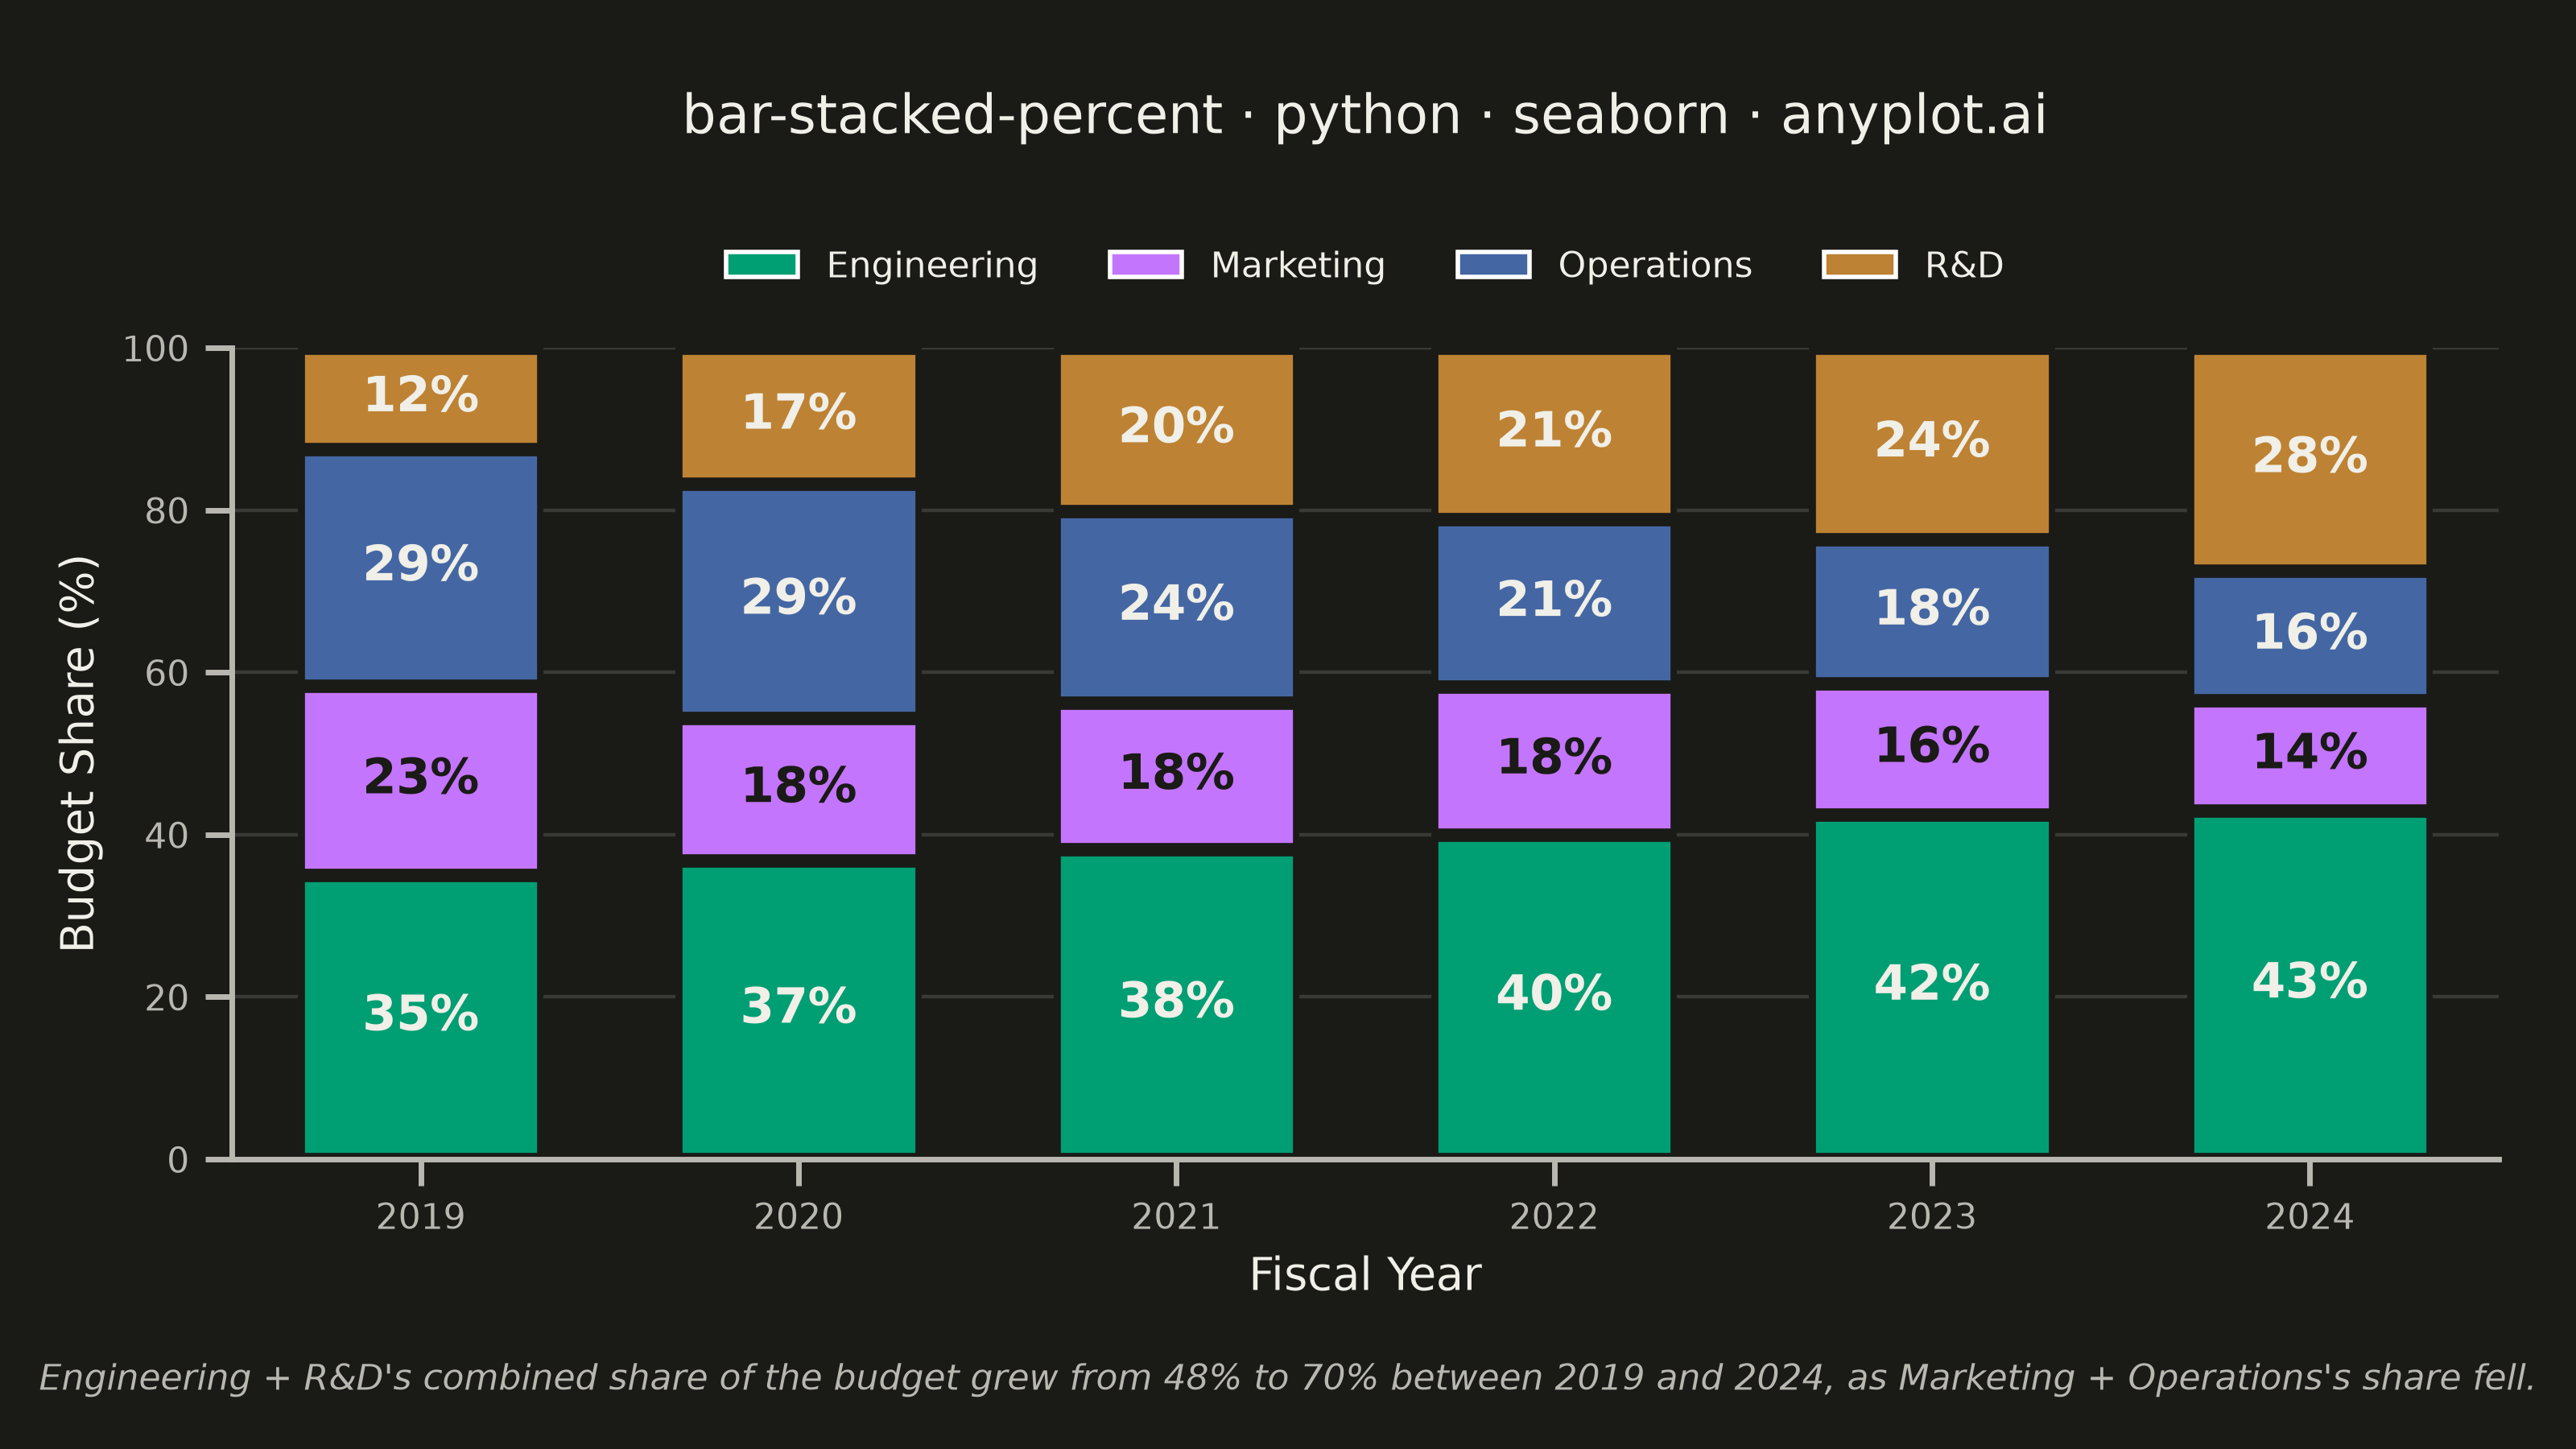
A 100% stacked bar chart displays multiple data series as proportional segments within each bar, where every bar is normalized to sum to 100%. This visualization emphasizes composition and relative proportions rather than absolute values, making it ideal for comparing how different components contribute to a whole across categories. It reveals patterns in distribution and share that might be obscured when absolute values vary significantly between categories.
""" anyplot.ai
bar-stacked-percent: 100% Stacked Bar Chart
Library: seaborn 0.13.2 | Python 3.13.15
Quality: 94/100 | Updated: 2026-08-18
"""

import os

import matplotlib.pyplot as plt
import numpy as np
import pandas as pd
import seaborn as sns
import seaborn.objects as so
from matplotlib.patches import Patch


# Theme tokens
THEME = os.getenv("ANYPLOT_THEME", "light")
PAGE_BG = "#FAF8F1" if THEME == "light" else "#1A1A17"
ELEVATED_BG = "#FFFDF6" if THEME == "light" else "#242420"
INK = "#1A1A17" if THEME == "light" else "#F0EFE8"
INK_SOFT = "#4A4A44" if THEME == "light" else "#B8B7B0"

# Imprint palette — canonical order, first series always #009E73
IMPRINT = ["#009E73", "#C475FD", "#4467A3", "#BD8233"]

# Configure seaborn with theme-adaptive colors
sns.set_theme(
    style="ticks",
    rc={
        "figure.facecolor": PAGE_BG,
        "axes.facecolor": PAGE_BG,
        "axes.edgecolor": INK_SOFT,
        "axes.labelcolor": INK,
        "text.color": INK,
        "xtick.color": INK_SOFT,
        "ytick.color": INK_SOFT,
        "grid.color": INK,
        "grid.alpha": 0.15,
        "legend.facecolor": ELEVATED_BG,
        "legend.edgecolor": INK_SOFT,
    },
)

# Data: annual operating budget allocation by department
years = ["2019", "2020", "2021", "2022", "2023", "2024"]
departments = ["Engineering", "Marketing", "Operations", "R&D"]

budget_millions = pd.DataFrame(
    {
        "Engineering": [4.2, 4.6, 5.5, 6.8, 7.9, 8.6],
        "Marketing": [2.8, 2.2, 2.6, 3.1, 3.0, 2.7],
        "Operations": [3.5, 3.6, 3.4, 3.5, 3.3, 3.2],
        "R&D": [1.5, 2.1, 2.9, 3.6, 4.4, 5.5],
    },
    index=years,
)

# Normalize to a 100% stacked share per year
budget_share = budget_millions.div(budget_millions.sum(axis=1), axis=0) * 100
long_form = budget_share.reset_index(names="year").melt(id_vars="year", var_name="department", value_name="share_pct")
long_form["department"] = pd.Categorical(long_form["department"], categories=departments, ordered=True)

# Plot — seaborn's objects interface applies the percent-stacking transform natively
fig, ax = plt.subplots(figsize=(8, 4.5), dpi=400, facecolor=PAGE_BG)

(
    so.Plot(long_form, x="year", y="share_pct", color="department")
    .add(so.Bar(alpha=1, edgewidth=1.5, edgecolor=PAGE_BG, width=0.65), so.Stack())
    .scale(color=so.Nominal(IMPRINT))
    .on(ax)
    .plot()
)
fig.legends[0].set_visible(False)  # hide the objects-interface default legend, replaced below

# Percentage labels inside segments large enough to hold text.
# Text color is chosen per segment's own luminance (data colors stay fixed across
# themes), not per page theme, so contrast holds against every Imprint hue.
cumulative_share = budget_share.cumsum(axis=1)
segment_luminance = [
    0.299 * int(hex_color[1:3], 16) + 0.587 * int(hex_color[3:5], 16) + 0.114 * int(hex_color[5:7], 16)
    for hex_color in IMPRINT
]
label_colors = ["#1A1A17" if lum > 140 else "#F0EFE8" for lum in segment_luminance]

for i, department in enumerate(departments):
    bottom = cumulative_share.iloc[:, i - 1].to_numpy() if i > 0 else np.zeros(len(years))
    heights = budget_share[department].to_numpy()
    for x_pos, (height, base) in enumerate(zip(heights, bottom, strict=True)):
        if height > 8:  # skip labels on slivers too thin to hold text
            ax.text(
                x_pos,
                base + height / 2,
                f"{height:.0f}%",
                ha="center",
                va="center",
                fontsize=11,
                fontweight="bold",
                color=label_colors[i],
            )

# Styling — reserve headroom above the axes for the title + legend stack, and
# footroom below for the data-storytelling footnote
fig.subplots_adjust(top=0.76, bottom=0.20, left=0.09, right=0.97)
title = "bar-stacked-percent · python · seaborn · anyplot.ai"
ax.set_title(title, fontsize=12, fontweight="medium", color=INK, pad=48)
ax.set_xlabel("Fiscal Year", fontsize=10, color=INK)
ax.set_ylabel("Budget Share (%)", fontsize=10, color=INK)
ax.tick_params(axis="both", labelsize=8, colors=INK_SOFT)
ax.set_ylim(0, 100)
ax.set_yticks([0, 20, 40, 60, 80, 100])

# Legend — left-to-right order mirrors bottom-to-top stacking order for easy
# reading; frameless per the style guide's decoration-removal guidance
legend_handles = [
    Patch(facecolor=color, label=department) for department, color in zip(departments, IMPRINT, strict=True)
]
ax.legend(handles=legend_handles, loc="upper center", bbox_to_anchor=(0.5, 1.16), ncol=4, fontsize=8, frameon=False)

# Grid
ax.yaxis.grid(True, alpha=0.15, linewidth=0.8)
ax.set_axisbelow(True)
sns.despine(ax=ax)

# Data-storytelling footnote — calls out the compositional shift the stack
# alone doesn't narrate: Engineering + R&D's combined share of the budget
# rising steadily while Marketing + Operations's share falls.
eng_rd_start = budget_share.loc["2019", ["Engineering", "R&D"]].sum()
eng_rd_end = budget_share.loc["2024", ["Engineering", "R&D"]].sum()
footnote = (
    f"Engineering + R&D's combined share of the budget grew from {eng_rd_start:.0f}% to "
    f"{eng_rd_end:.0f}% between 2019 and 2024, as Marketing + Operations's share fell."
)
fig.text(0.5, 0.035, footnote, ha="center", va="bottom", fontsize=8, style="italic", color=INK_SOFT)

plt.savefig(f"plot-{THEME}.png", dpi=400, facecolor=PAGE_BG)
Runnable source as JSON, for any HTTP client: https://api.anyplot.ai/specs/bar-stacked-percent/seaborn/code. Any spec id and library id listed in llms-full.txt fit the same URL shape; every URL below is complete and callable.
{
  "spec_id": "bar-stacked-percent",
  "language": "python",
  "library": "seaborn",
  "page": "https://anyplot.ai/bar-stacked-percent/python/seaborn",
  "hub": "https://anyplot.ai/bar-stacked-percent",
  "code_json": "https://api.anyplot.ai/specs/bar-stacked-percent/seaborn/code",
  "spec_json": "https://api.anyplot.ai/specs/bar-stacked-percent",
  "render_light_png": "https://storage.googleapis.com/anyplot-images/plots/bar-stacked-percent/python/seaborn/plot-light.png",
  "render_dark_png": "https://storage.googleapis.com/anyplot-images/plots/bar-stacked-percent/python/seaborn/plot-dark.png",
  "quality_score": 94.0,
  "license": "MIT",
  "guide": "https://anyplot.ai/llms.txt"
}
Part of 100% Stacked Bar Chart on anyplot.ai.