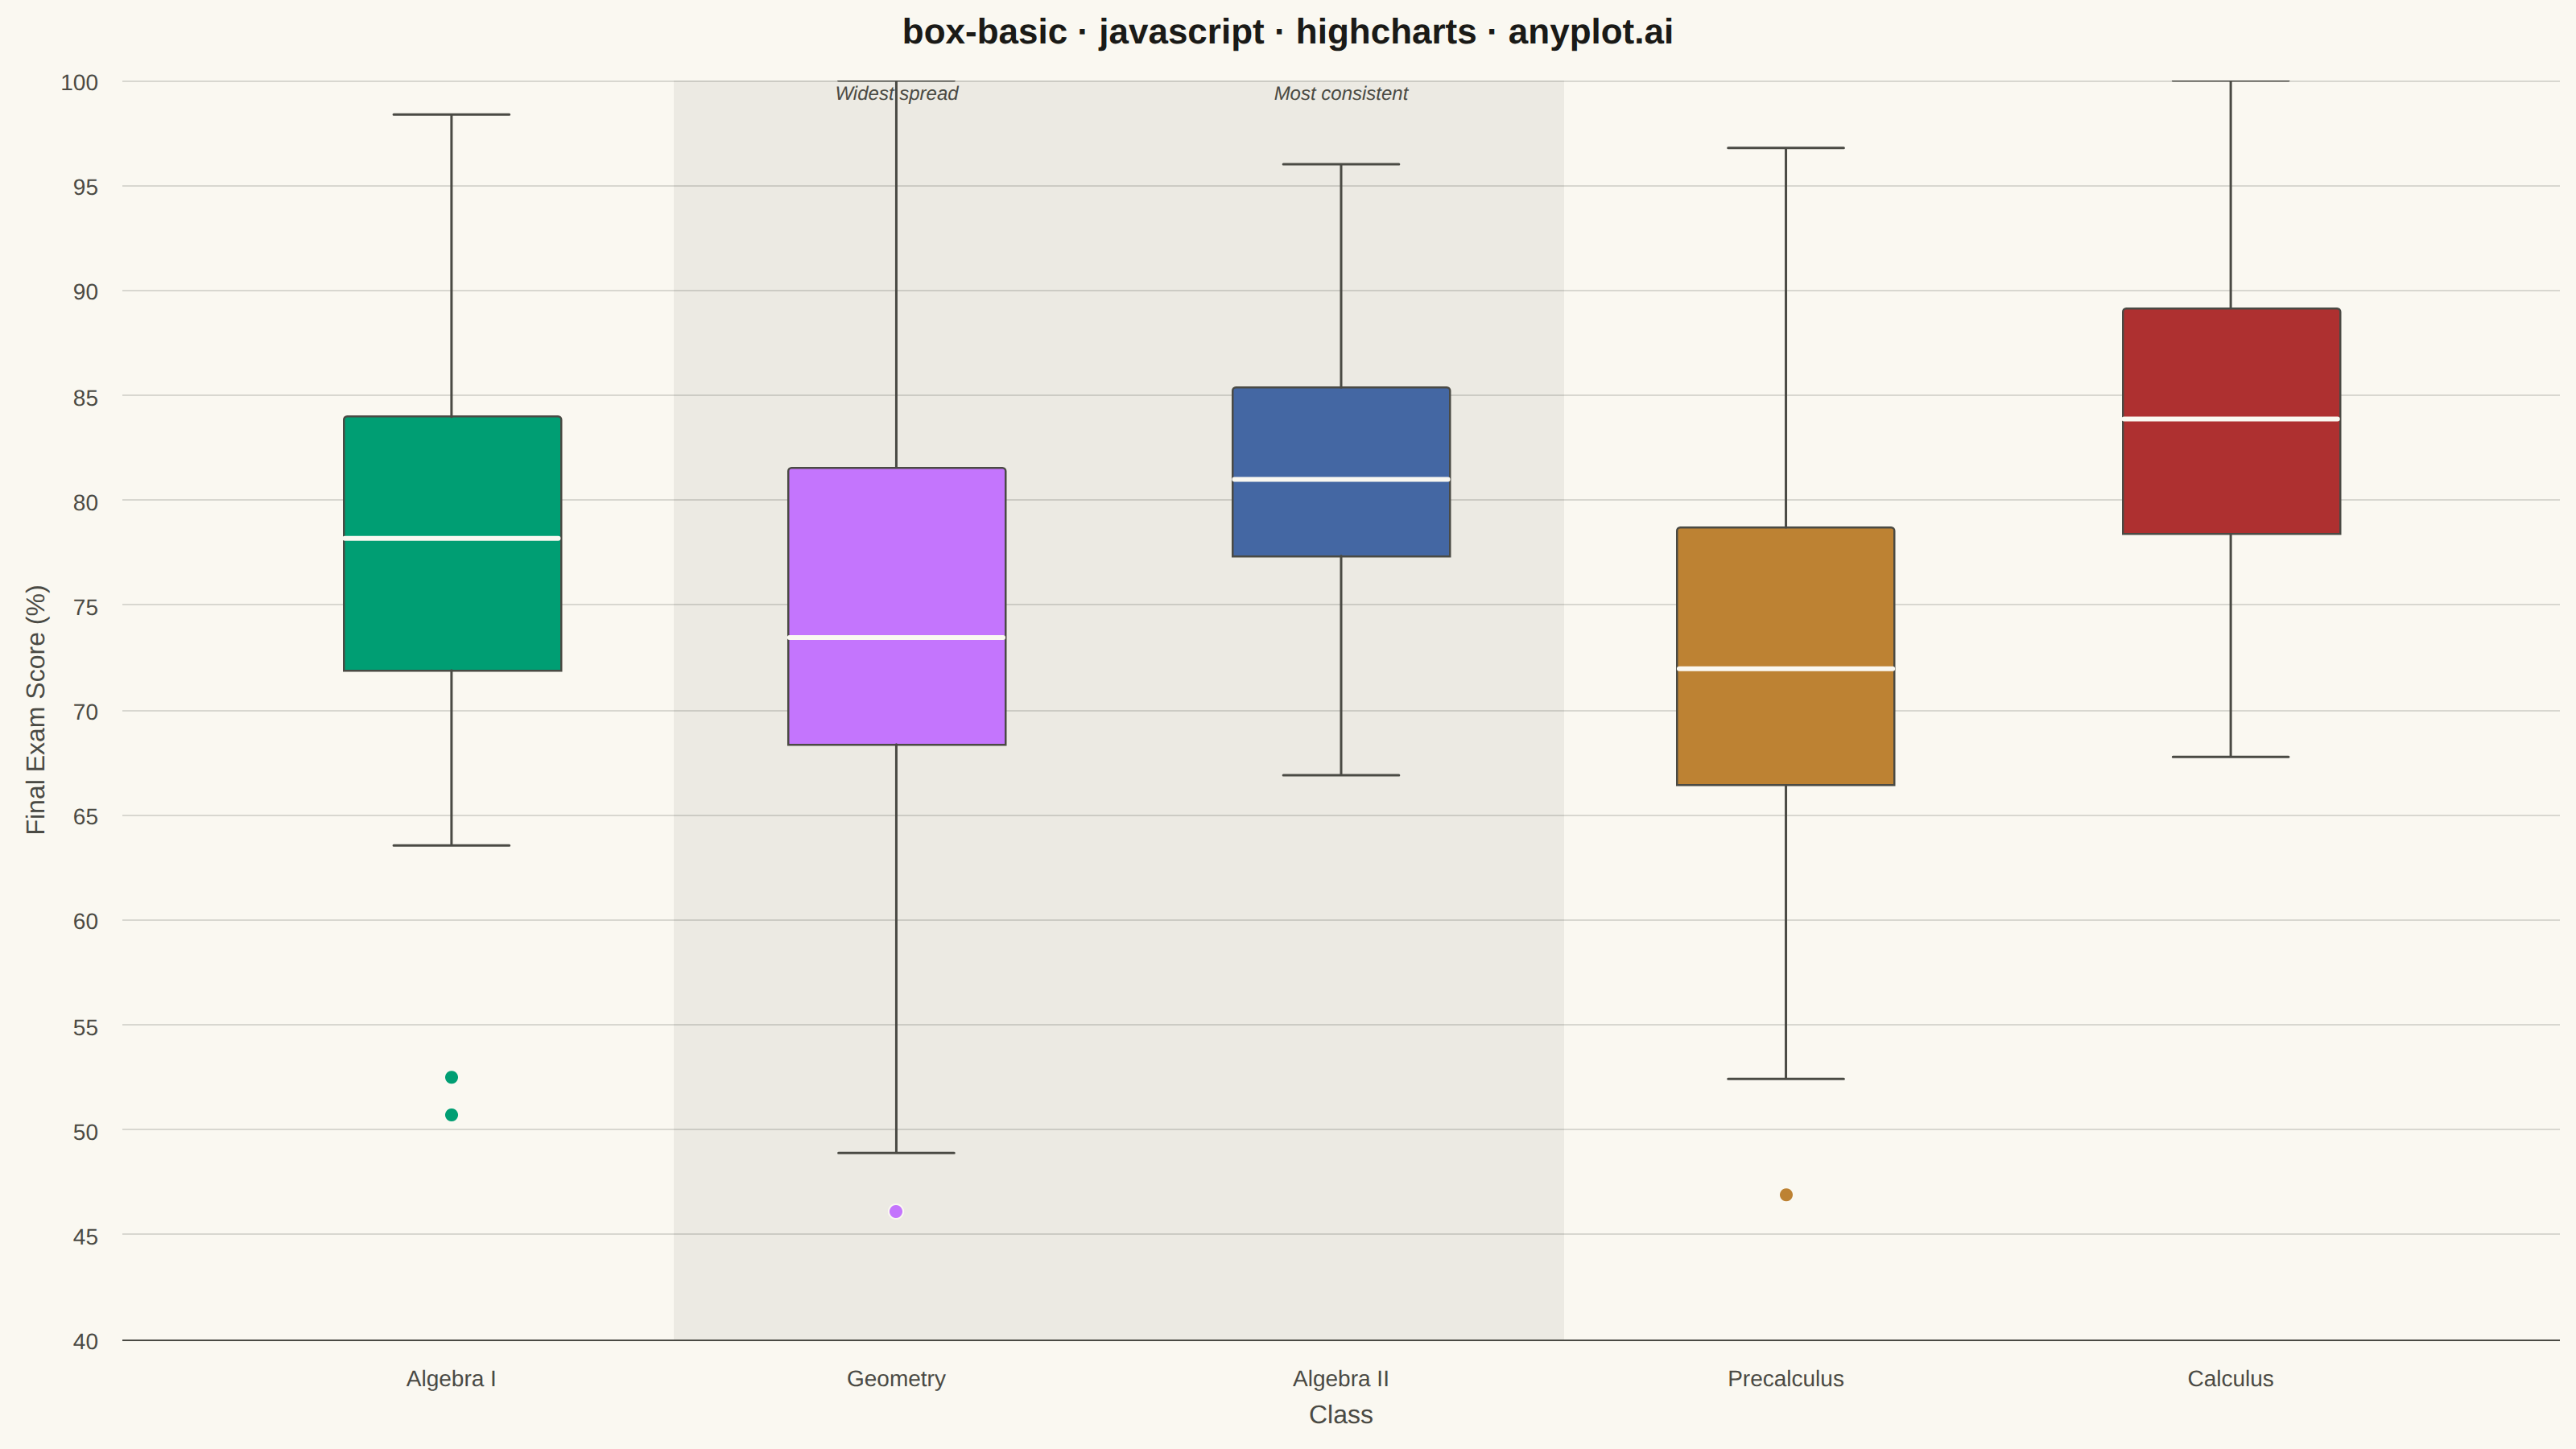
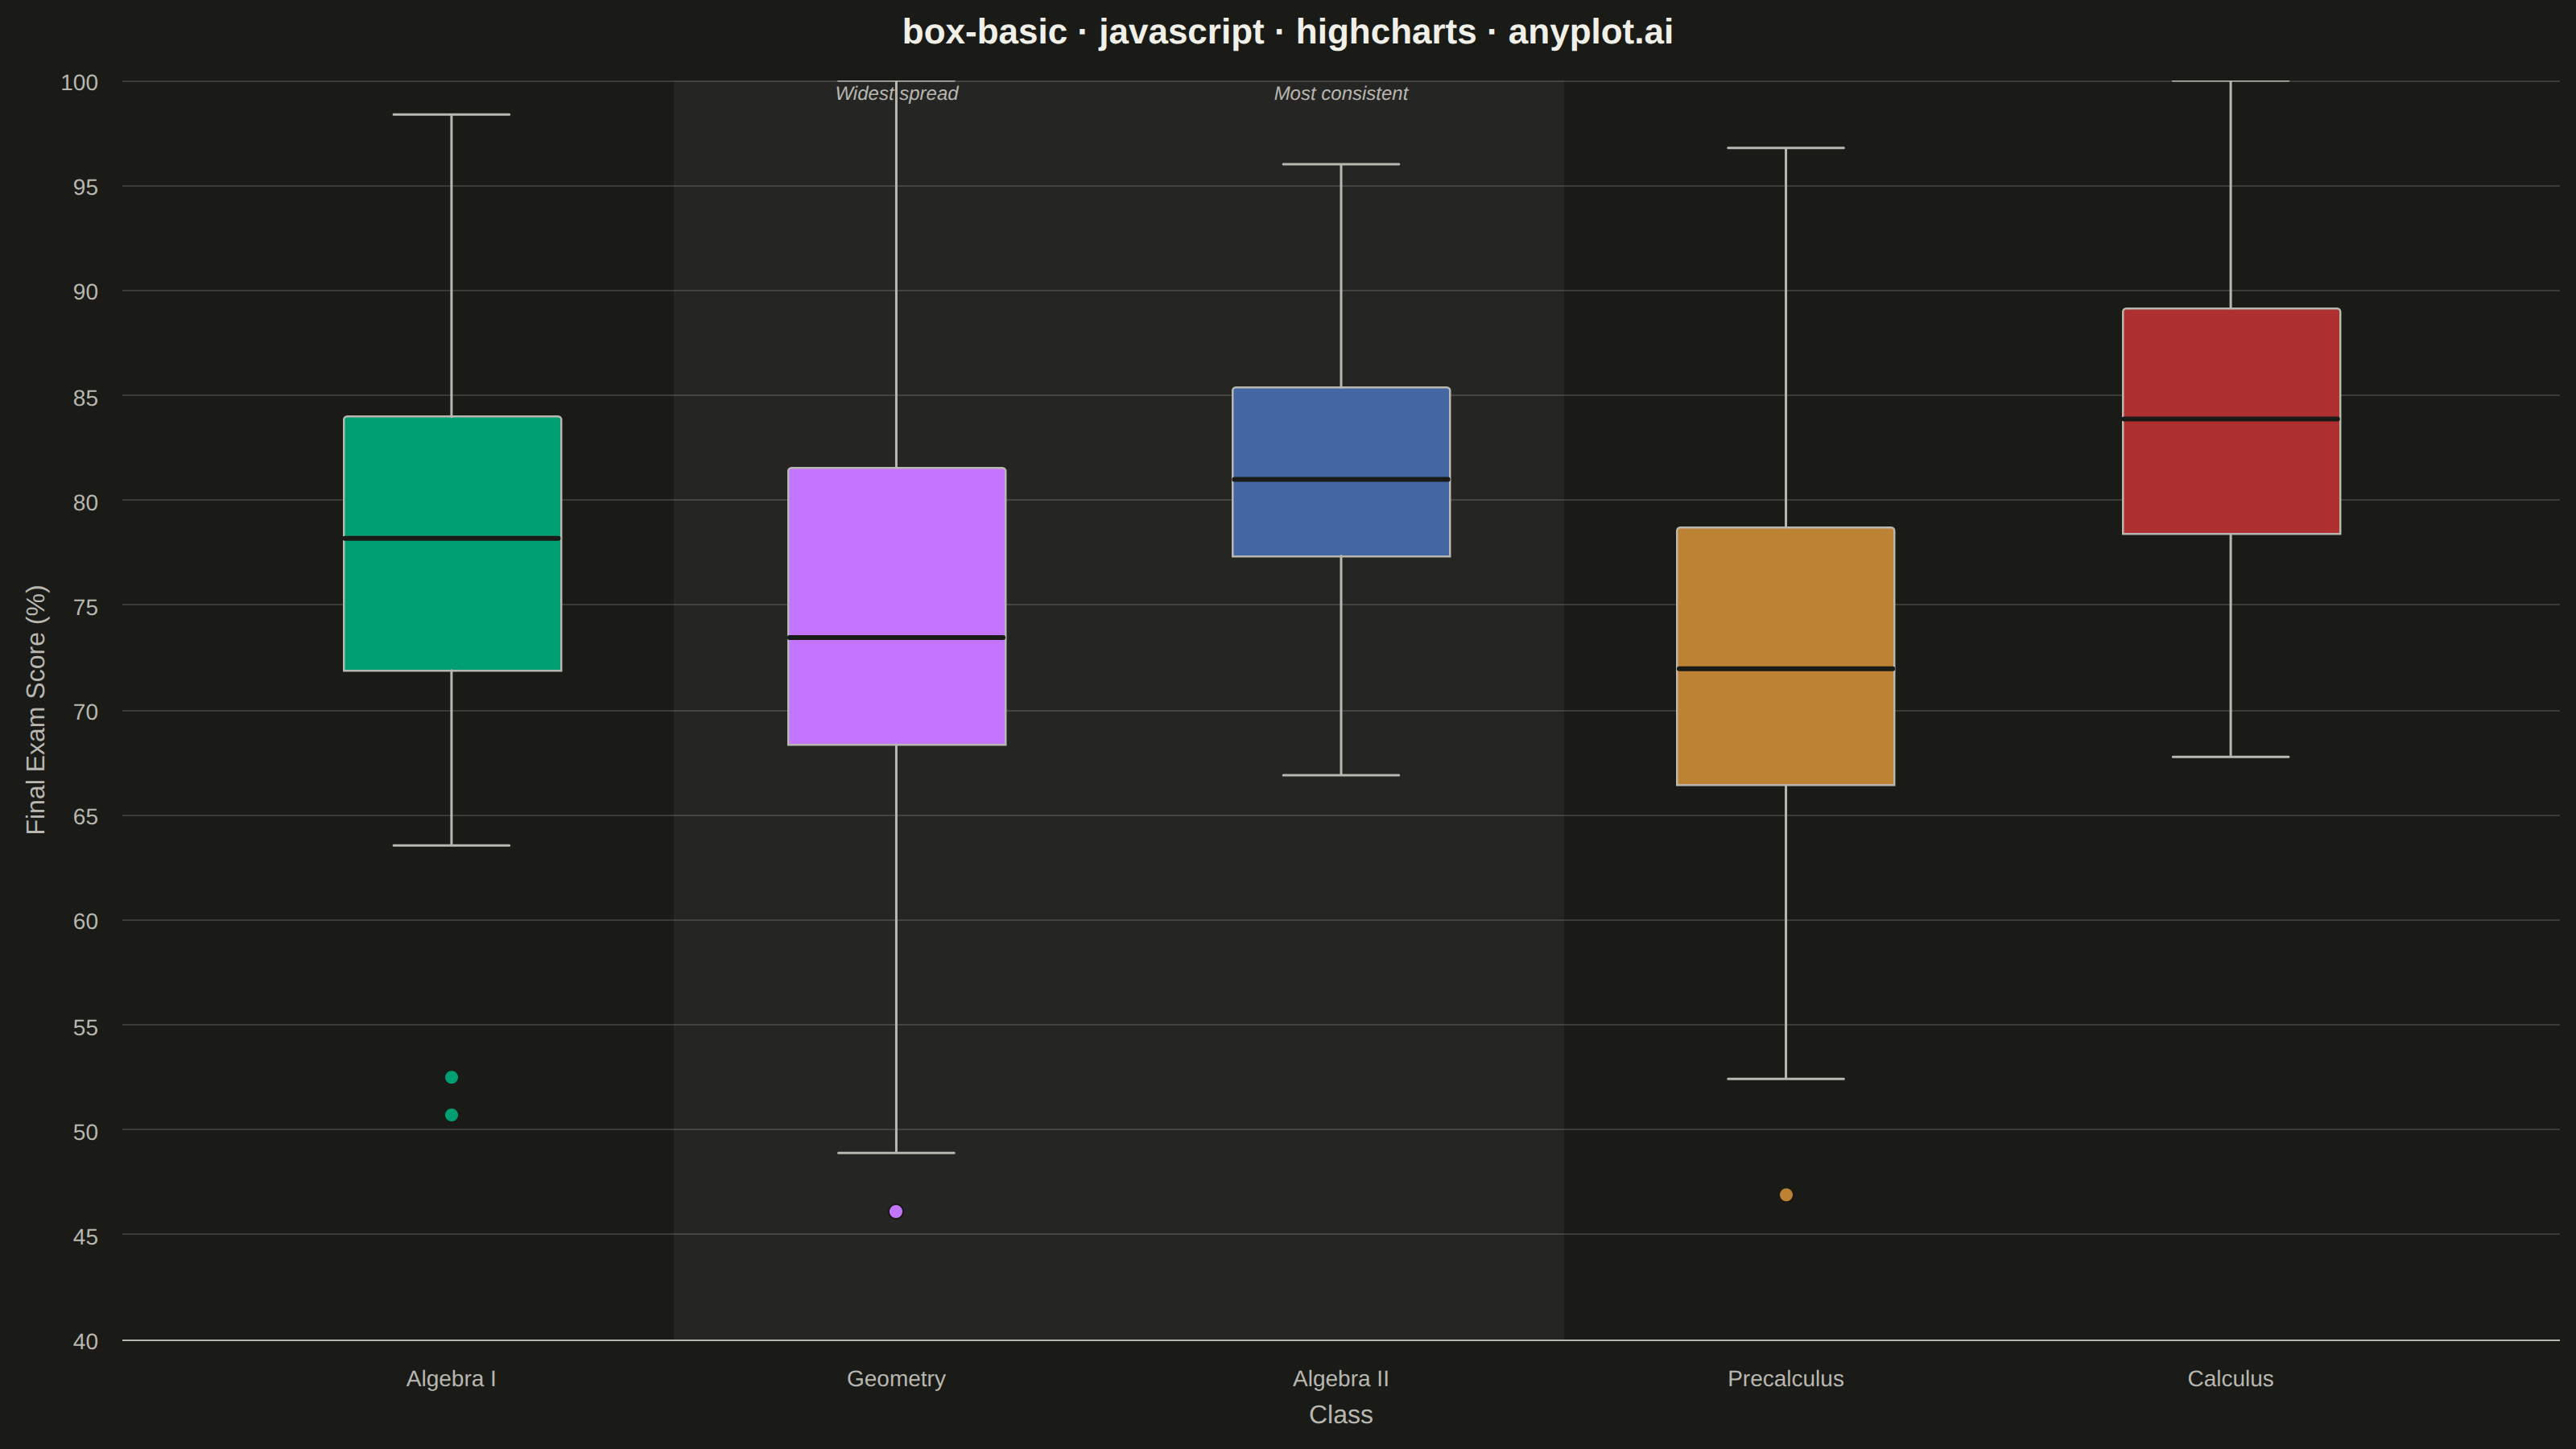
A box plot (box-and-whisker plot) showing the distribution of numerical data through quartiles. Displays the median, first and third quartiles as a box, with whiskers extending to show the data range. Essential for comparing distributions across categories and identifying outliers.
Preview render from the Highcharts implementation.