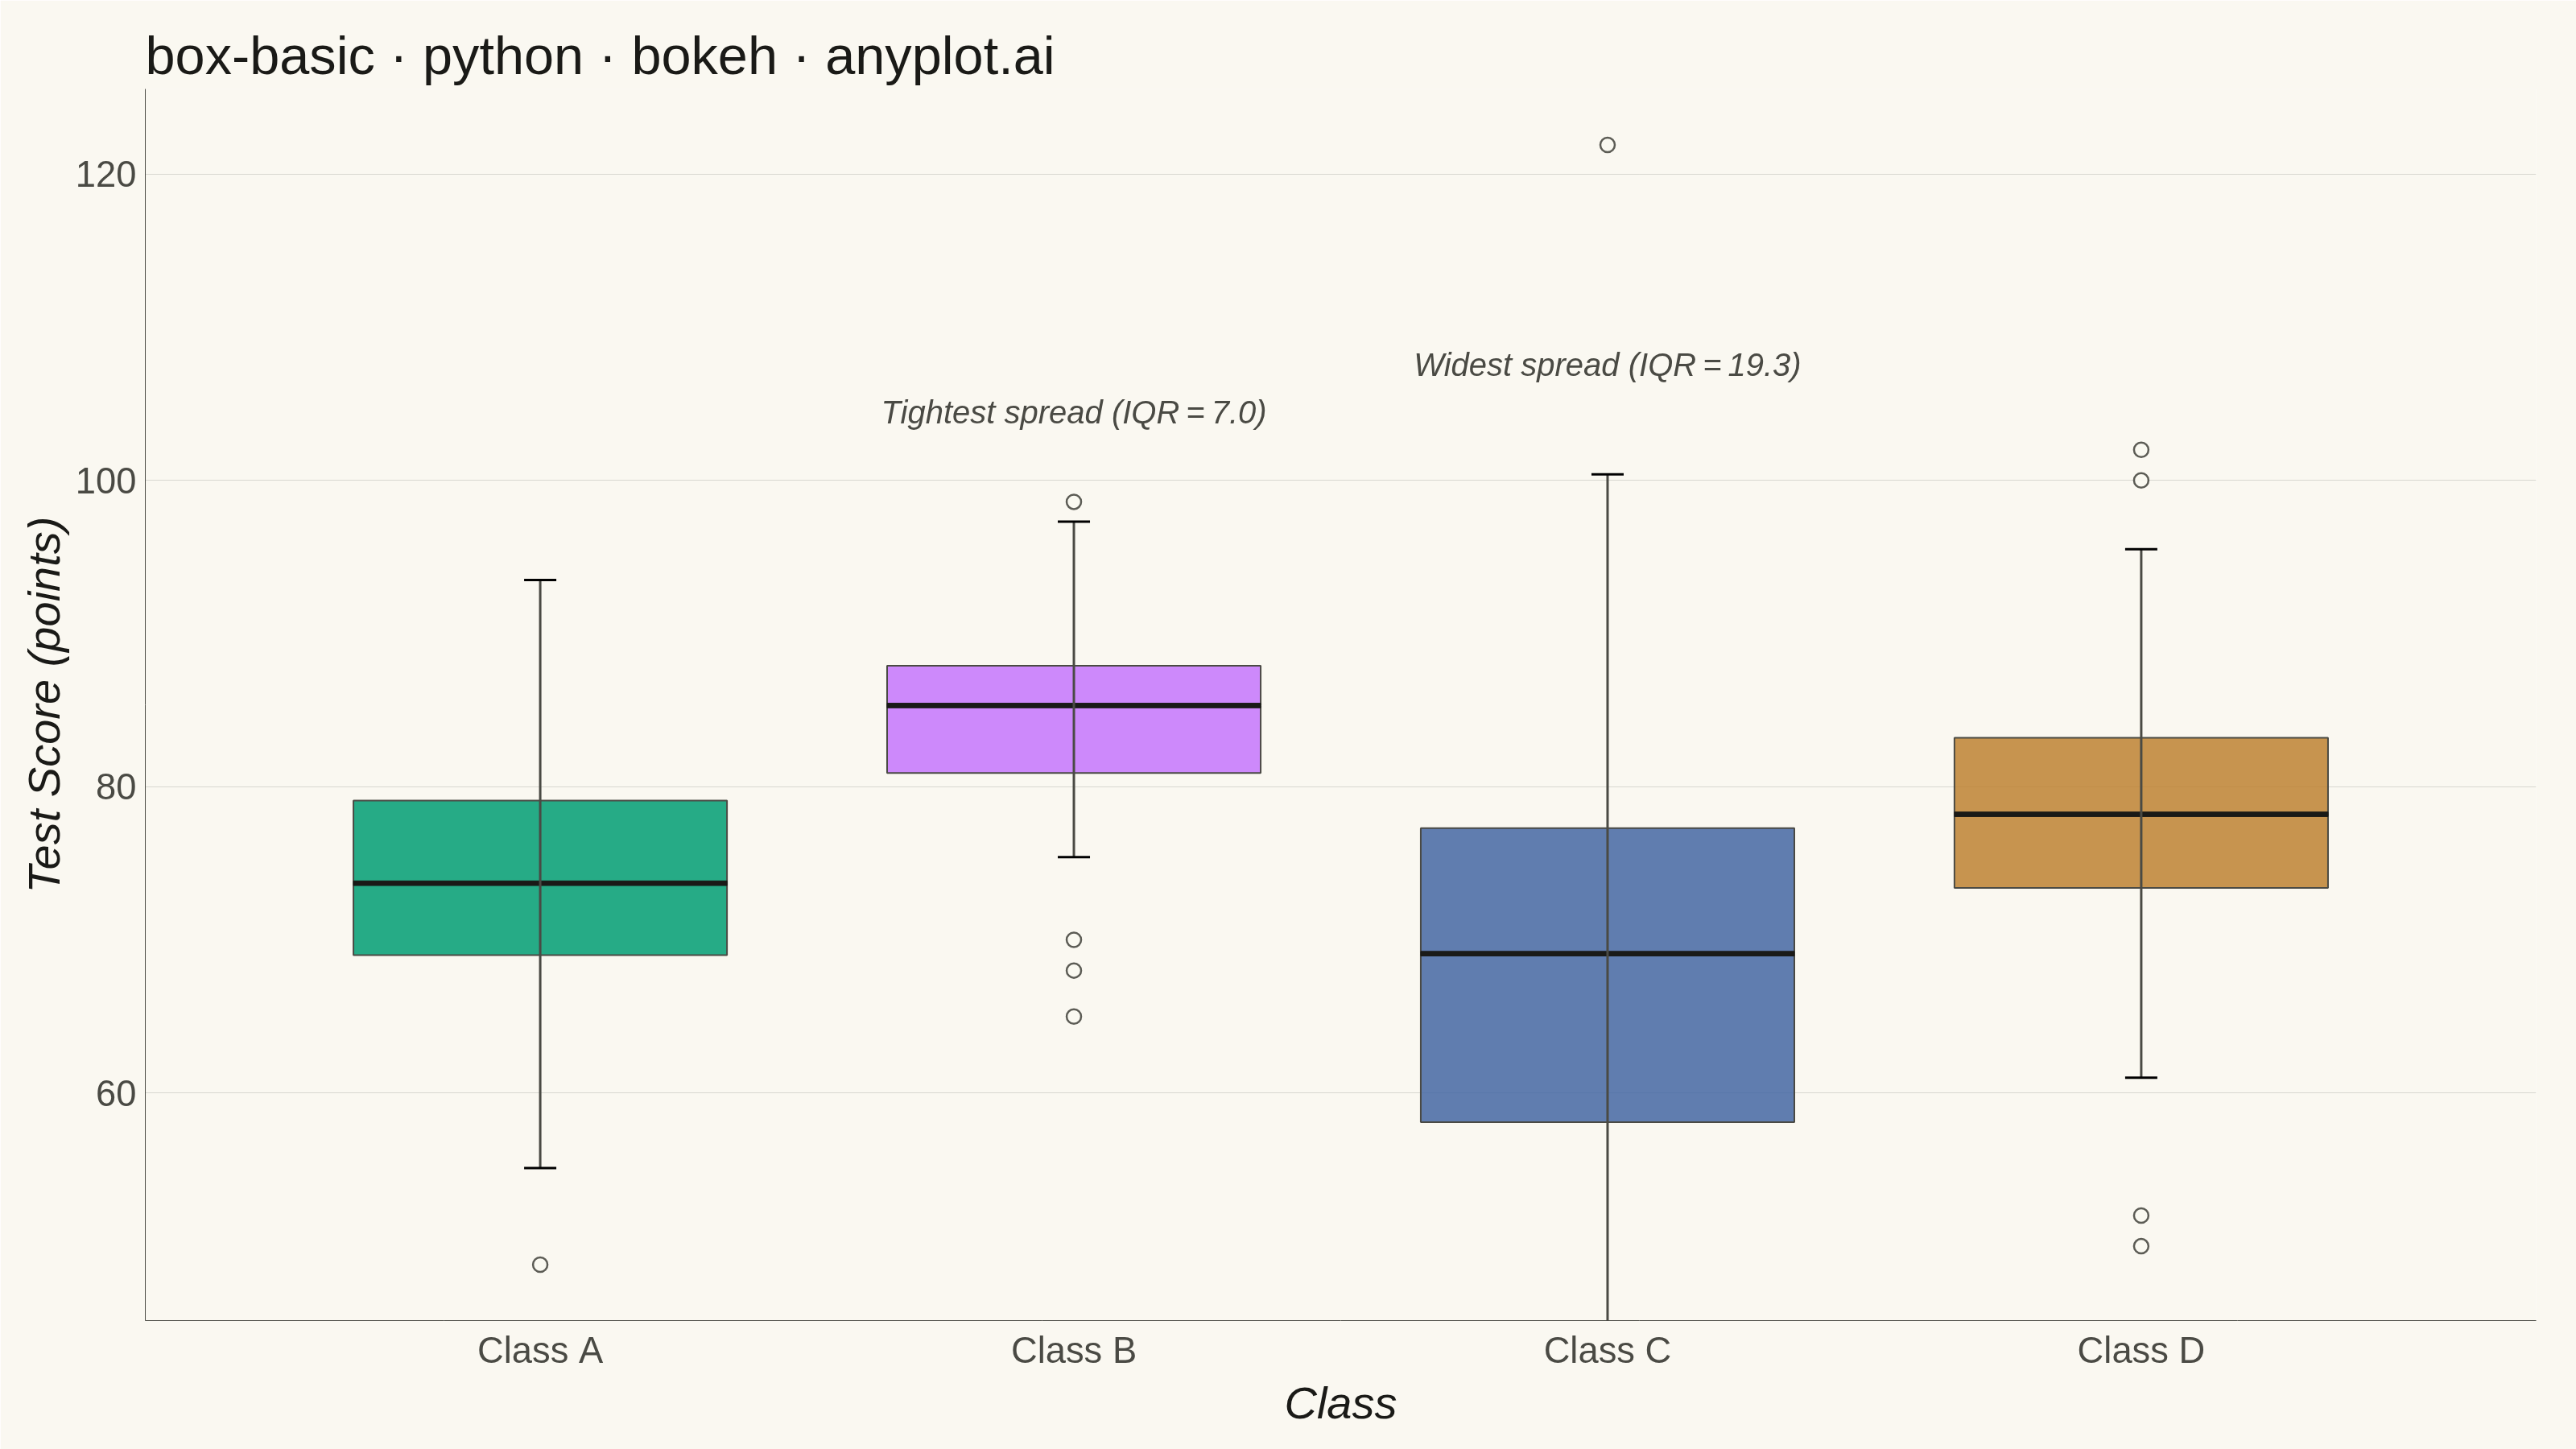
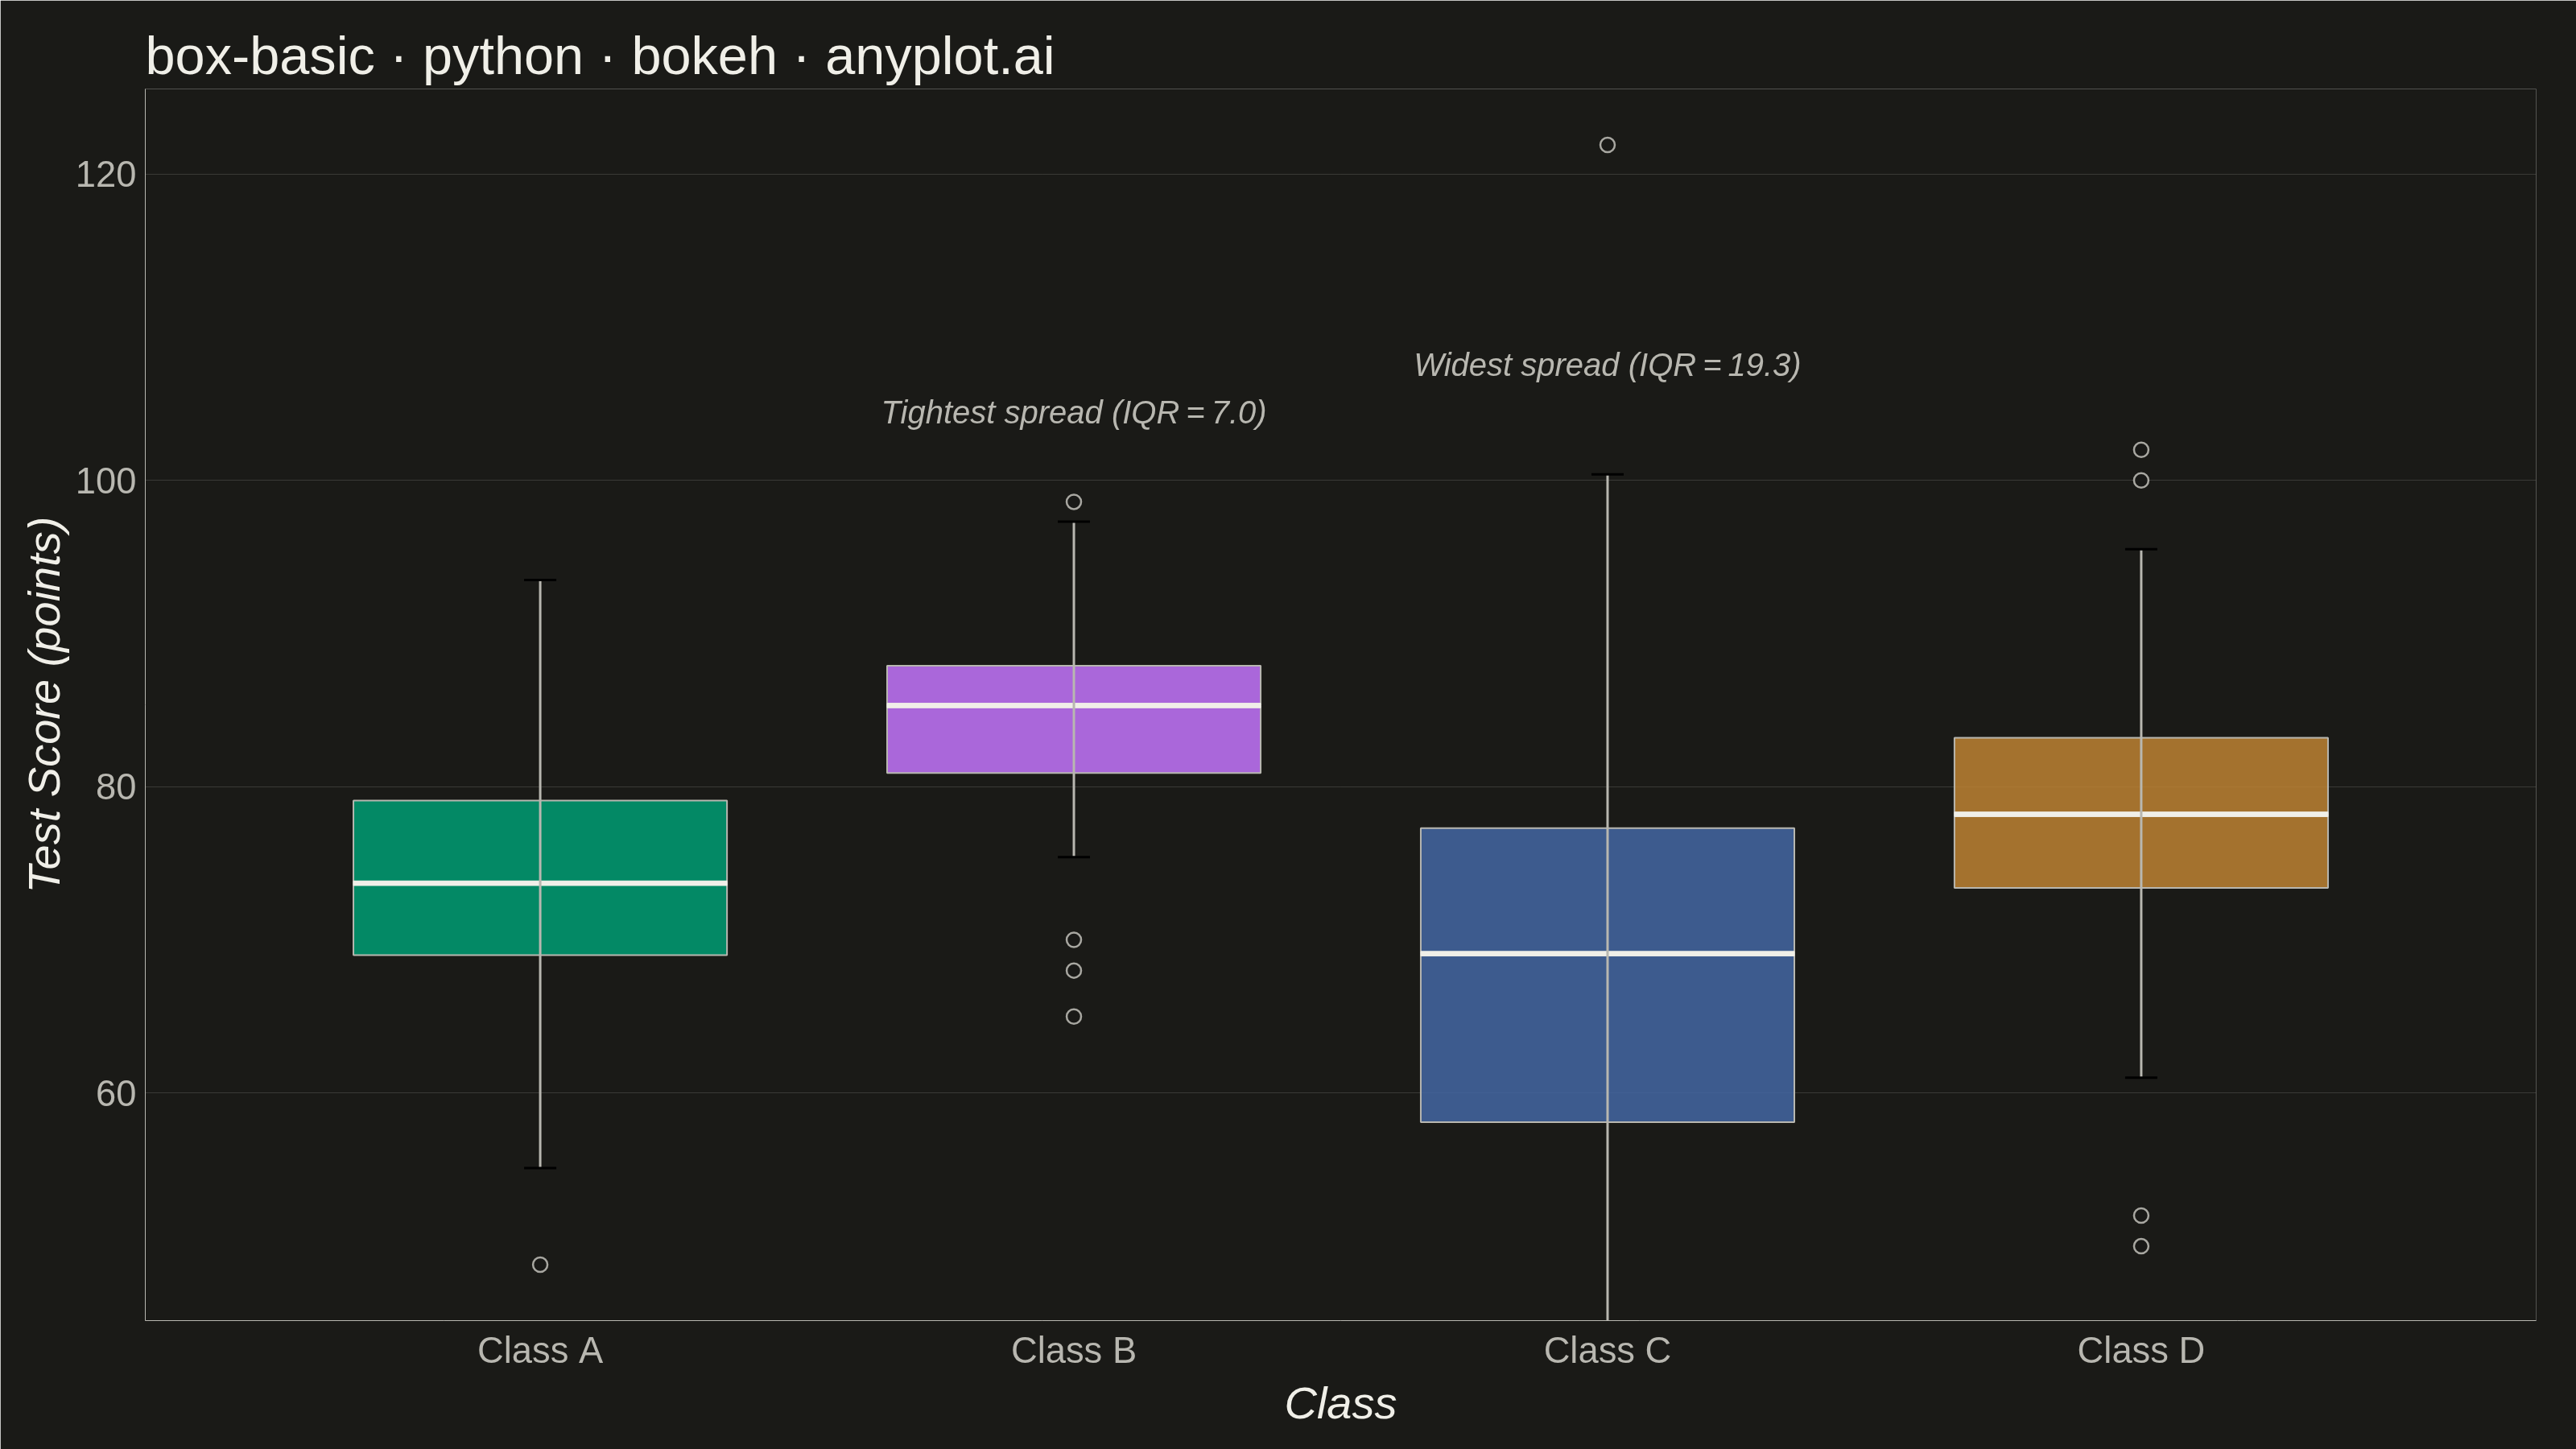
A box plot (box-and-whisker plot) showing the distribution of numerical data through quartiles. Displays the median, first and third quartiles as a box, with whiskers extending to show the data range. Essential for comparing distributions across categories and identifying outliers.
""" anyplot.ai
box-basic: Basic Box Plot
Library: bokeh 3.9.0 | Python 3.13.13
Quality: 89/100 | Updated: 2026-05-28
"""

import io
import os
import sys
import time
from pathlib import Path

from PIL import Image


# Remove this script's own directory from sys.path so the installed
# bokeh package is found instead of this file (also named bokeh.py).
_own_dir = os.path.dirname(os.path.realpath(__file__))
sys.path = [p for p in sys.path if os.path.realpath(p or ".") != _own_dir]

import numpy as np
from bokeh.io import output_file, save
from bokeh.models import ColumnDataSource, LabelSet, Whisker
from bokeh.plotting import figure
from bokeh.transform import factor_cmap
from selenium import webdriver
from selenium.webdriver.chrome.options import Options


# Theme tokens
THEME = os.getenv("ANYPLOT_THEME", "light")
PAGE_BG = "#FAF8F1" if THEME == "light" else "#1A1A17"
INK = "#1A1A17" if THEME == "light" else "#F0EFE8"
INK_SOFT = "#4A4A44" if THEME == "light" else "#B8B7B0"

IMPRINT_PALETTE = ["#009E73", "#C475FD", "#4467A3", "#BD8233", "#AE3030", "#2ABCCD", "#954477", "#99B314"]

# Data — test scores across 4 classes with varying distributions
np.random.seed(42)
categories = ["Class A", "Class B", "Class C", "Class D"]

scores = {
    "Class A": np.random.normal(75, 10, 100),
    "Class B": np.concatenate([np.random.normal(85, 5, 90), np.array([65, 68, 70])]),
    "Class C": np.clip(np.random.normal(68, 14, 100), 30, None),
    "Class D": np.concatenate([np.random.normal(78, 8, 95), np.array([100, 102, 50, 52])]),
}

# Box plot statistics
box_data = {"cat": [], "q1": [], "q2": [], "q3": [], "upper": [], "lower": [], "iqr": []}
outlier_x = []
outlier_y = []

for cat in categories:
    values = np.array(scores[cat])
    q1 = np.percentile(values, 25)
    q2 = np.percentile(values, 50)
    q3 = np.percentile(values, 75)
    iqr = q3 - q1
    upper_fence = q3 + 1.5 * iqr
    lower_fence = q1 - 1.5 * iqr
    upper_whisker = values[values <= upper_fence].max()
    lower_whisker = values[values >= lower_fence].min()

    box_data["cat"].append(cat)
    box_data["q1"].append(round(q1, 1))
    box_data["q2"].append(round(q2, 1))
    box_data["q3"].append(round(q3, 1))
    box_data["upper"].append(round(upper_whisker, 1))
    box_data["lower"].append(round(lower_whisker, 1))
    box_data["iqr"].append(round(iqr, 1))

    outliers = values[(values < lower_fence) | (values > upper_fence)]
    for o in outliers:
        outlier_x.append(cat)
        outlier_y.append(round(o, 1))

source = ColumnDataSource(data=box_data)

# Figure
title = "box-basic · python · bokeh · anyplot.ai"
W, H = 3200, 1800
p = figure(
    x_range=categories,
    width=W,
    height=H,
    title=title,
    x_axis_label="Class",
    y_axis_label="Test Score (points)",
    toolbar_location=None,
    tools="",
    min_border_bottom=160,
    min_border_left=180,
    min_border_top=110,
    min_border_right=50,
)

# Boxes (q1–q3)
cmap = factor_cmap("cat", palette=IMPRINT_PALETTE[:4], factors=categories)
box_width = 0.7

p.vbar(
    x="cat",
    top="q3",
    bottom="q2",
    source=source,
    width=box_width,
    fill_color=cmap,
    line_color=INK_SOFT,
    line_width=2,
    fill_alpha=0.85,
)
p.vbar(
    x="cat",
    top="q2",
    bottom="q1",
    source=source,
    width=box_width,
    fill_color=cmap,
    line_color=INK_SOFT,
    line_width=2,
    fill_alpha=0.85,
)

# Median line
median_source = ColumnDataSource(data={"x": box_data["cat"], "y": box_data["q2"]})
p.rect(x="x", y="y", width=box_width, height=0.3, source=median_source, fill_color=INK, line_color=INK)

# Whiskers
whisker = Whisker(
    base="cat", upper="upper", lower="lower", source=source, level="annotation", line_width=3, line_color=INK_SOFT
)
whisker.upper_head.size = 40
whisker.lower_head.size = 40
whisker.upper_head.line_width = 3
whisker.lower_head.line_width = 3
p.add_layout(whisker)

# Outliers
if outlier_x:
    outlier_source = ColumnDataSource(data={"x": outlier_x, "y": outlier_y})
    p.scatter(
        x="x",
        y="y",
        source=outlier_source,
        size=18,
        fill_color=PAGE_BG,
        line_color=INK_SOFT,
        line_width=2.5,
        marker="circle",
        alpha=0.9,
    )

# Annotations — highlight tightest and widest spread
class_b_iqr = box_data["iqr"][1]
class_c_iqr = box_data["iqr"][2]

annotation_source = ColumnDataSource(
    data={
        "x": ["Class B", "Class C"],
        "y": [box_data["upper"][1] + 6, box_data["upper"][2] + 6],
        "text": [f"Tightest spread (IQR = {class_b_iqr})", f"Widest spread (IQR = {class_c_iqr})"],
    }
)
labels = LabelSet(
    x="x",
    y="y",
    text="text",
    text_color=INK_SOFT,
    source=annotation_source,
    text_font_size="30pt",
    text_font_style="italic",
    text_align="center",
)
p.add_layout(labels)

# Styling
p.title.text_font_size = "50pt"
p.title.text_font_style = "normal"
p.title.text_color = INK
p.xaxis.axis_label_text_font_size = "42pt"
p.yaxis.axis_label_text_font_size = "42pt"
p.xaxis.major_label_text_font_size = "34pt"
p.yaxis.major_label_text_font_size = "34pt"
p.xaxis.axis_label_text_color = INK
p.yaxis.axis_label_text_color = INK
p.xaxis.major_label_text_color = INK_SOFT
p.yaxis.major_label_text_color = INK_SOFT
p.xaxis.axis_line_color = INK_SOFT
p.yaxis.axis_line_color = INK_SOFT
p.xaxis.major_tick_line_color = None
p.yaxis.major_tick_line_color = None
p.xaxis.minor_tick_line_color = None
p.yaxis.minor_tick_line_color = None

p.x_range.range_padding = 0.12

# Grid
p.xgrid.grid_line_color = None
p.ygrid.grid_line_color = INK
p.ygrid.grid_line_alpha = 0.15
p.ygrid.grid_line_width = 1

# Background
p.background_fill_color = PAGE_BG
p.border_fill_color = PAGE_BG
p.outline_line_color = None

# Save HTML
output_file(f"plot-{THEME}.html")
save(p)

# Screenshot with headless Chrome — window is H+200 tall so bokeh canvas fills
# exactly W×H; PIL crops to the target rect before saving.
opts = Options()
for arg in (
    "--headless=new",
    "--no-sandbox",
    "--disable-dev-shm-usage",
    "--disable-gpu",
    f"--window-size={W},{H + 200}",
    "--hide-scrollbars",
    "--force-device-scale-factor=1",
):
    opts.add_argument(arg)
driver = webdriver.Chrome(options=opts)
driver.set_window_size(W, H + 200)
driver.get(f"file://{Path(f'plot-{THEME}.html').resolve()}")
time.sleep(3)
raw = driver.get_screenshot_as_png()
driver.quit()
Image.open(io.BytesIO(raw)).crop((0, 0, W, H)).save(f"plot-{THEME}.png")
Runnable source as JSON, for any HTTP client: https://api.anyplot.ai/specs/box-basic/bokeh/code. Any spec id and library id listed in llms-full.txt fit the same URL shape; every URL below is complete and callable.
{
  "spec_id": "box-basic",
  "language": "python",
  "library": "bokeh",
  "page": "https://anyplot.ai/box-basic/python/bokeh",
  "hub": "https://anyplot.ai/box-basic",
  "code_json": "https://api.anyplot.ai/specs/box-basic/bokeh/code",
  "spec_json": "https://api.anyplot.ai/specs/box-basic",
  "render_light_png": "https://storage.googleapis.com/anyplot-images/plots/box-basic/python/bokeh/plot-light.png",
  "render_dark_png": "https://storage.googleapis.com/anyplot-images/plots/box-basic/python/bokeh/plot-dark.png",
  "interactive_light_html": "https://storage.googleapis.com/anyplot-images/plots/box-basic/python/bokeh/plot-light.html",
  "interactive_dark_html": "https://storage.googleapis.com/anyplot-images/plots/box-basic/python/bokeh/plot-dark.html",
  "quality_score": 89.0,
  "license": "MIT",
  "guide": "https://anyplot.ai/llms.txt"
}
Part of Basic Box Plot on anyplot.ai.