The same plot in 14 other libraries — JavaScript: Chart.js, Apache ECharts, Highcharts, MUI X Charts; Python: Altair, Bokeh, lets-plot, Matplotlib, Plotly, plotnine, Pygal, Seaborn; R: ggplot2; Julia: Makie.jl. Compare all 15 side by side: Basic Box Plot in Python, R, Julia and JavaScript.
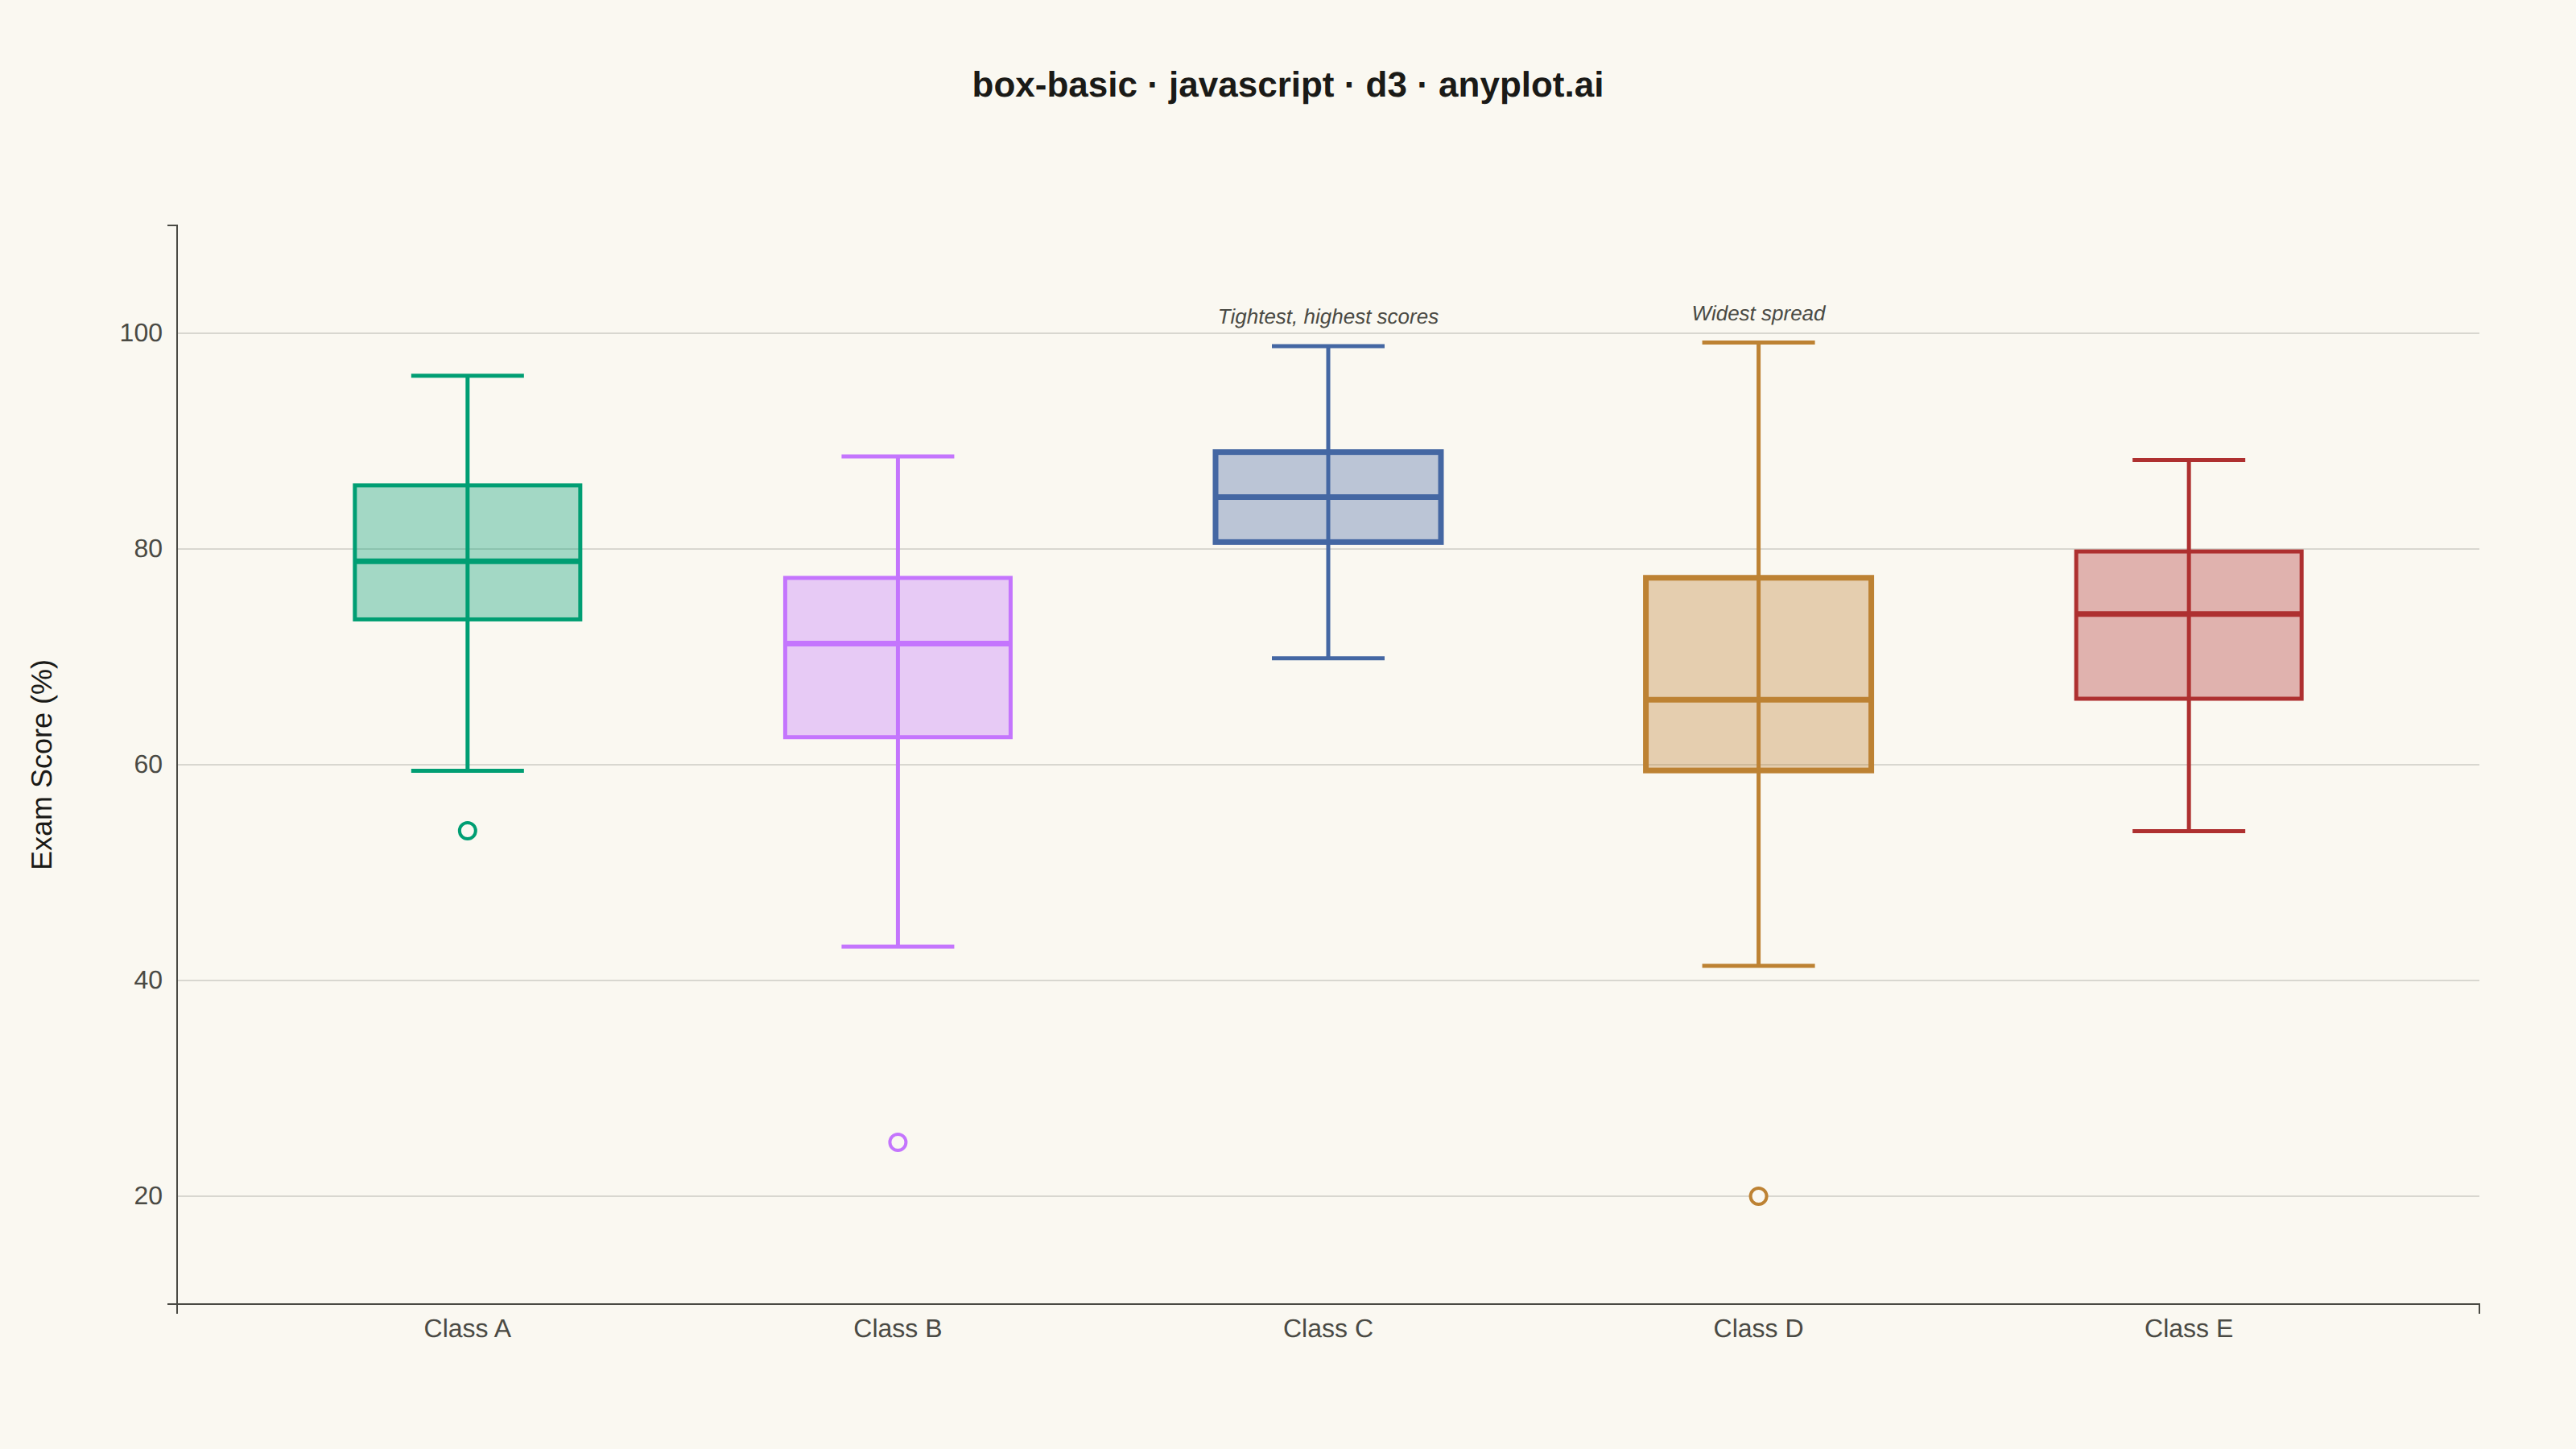
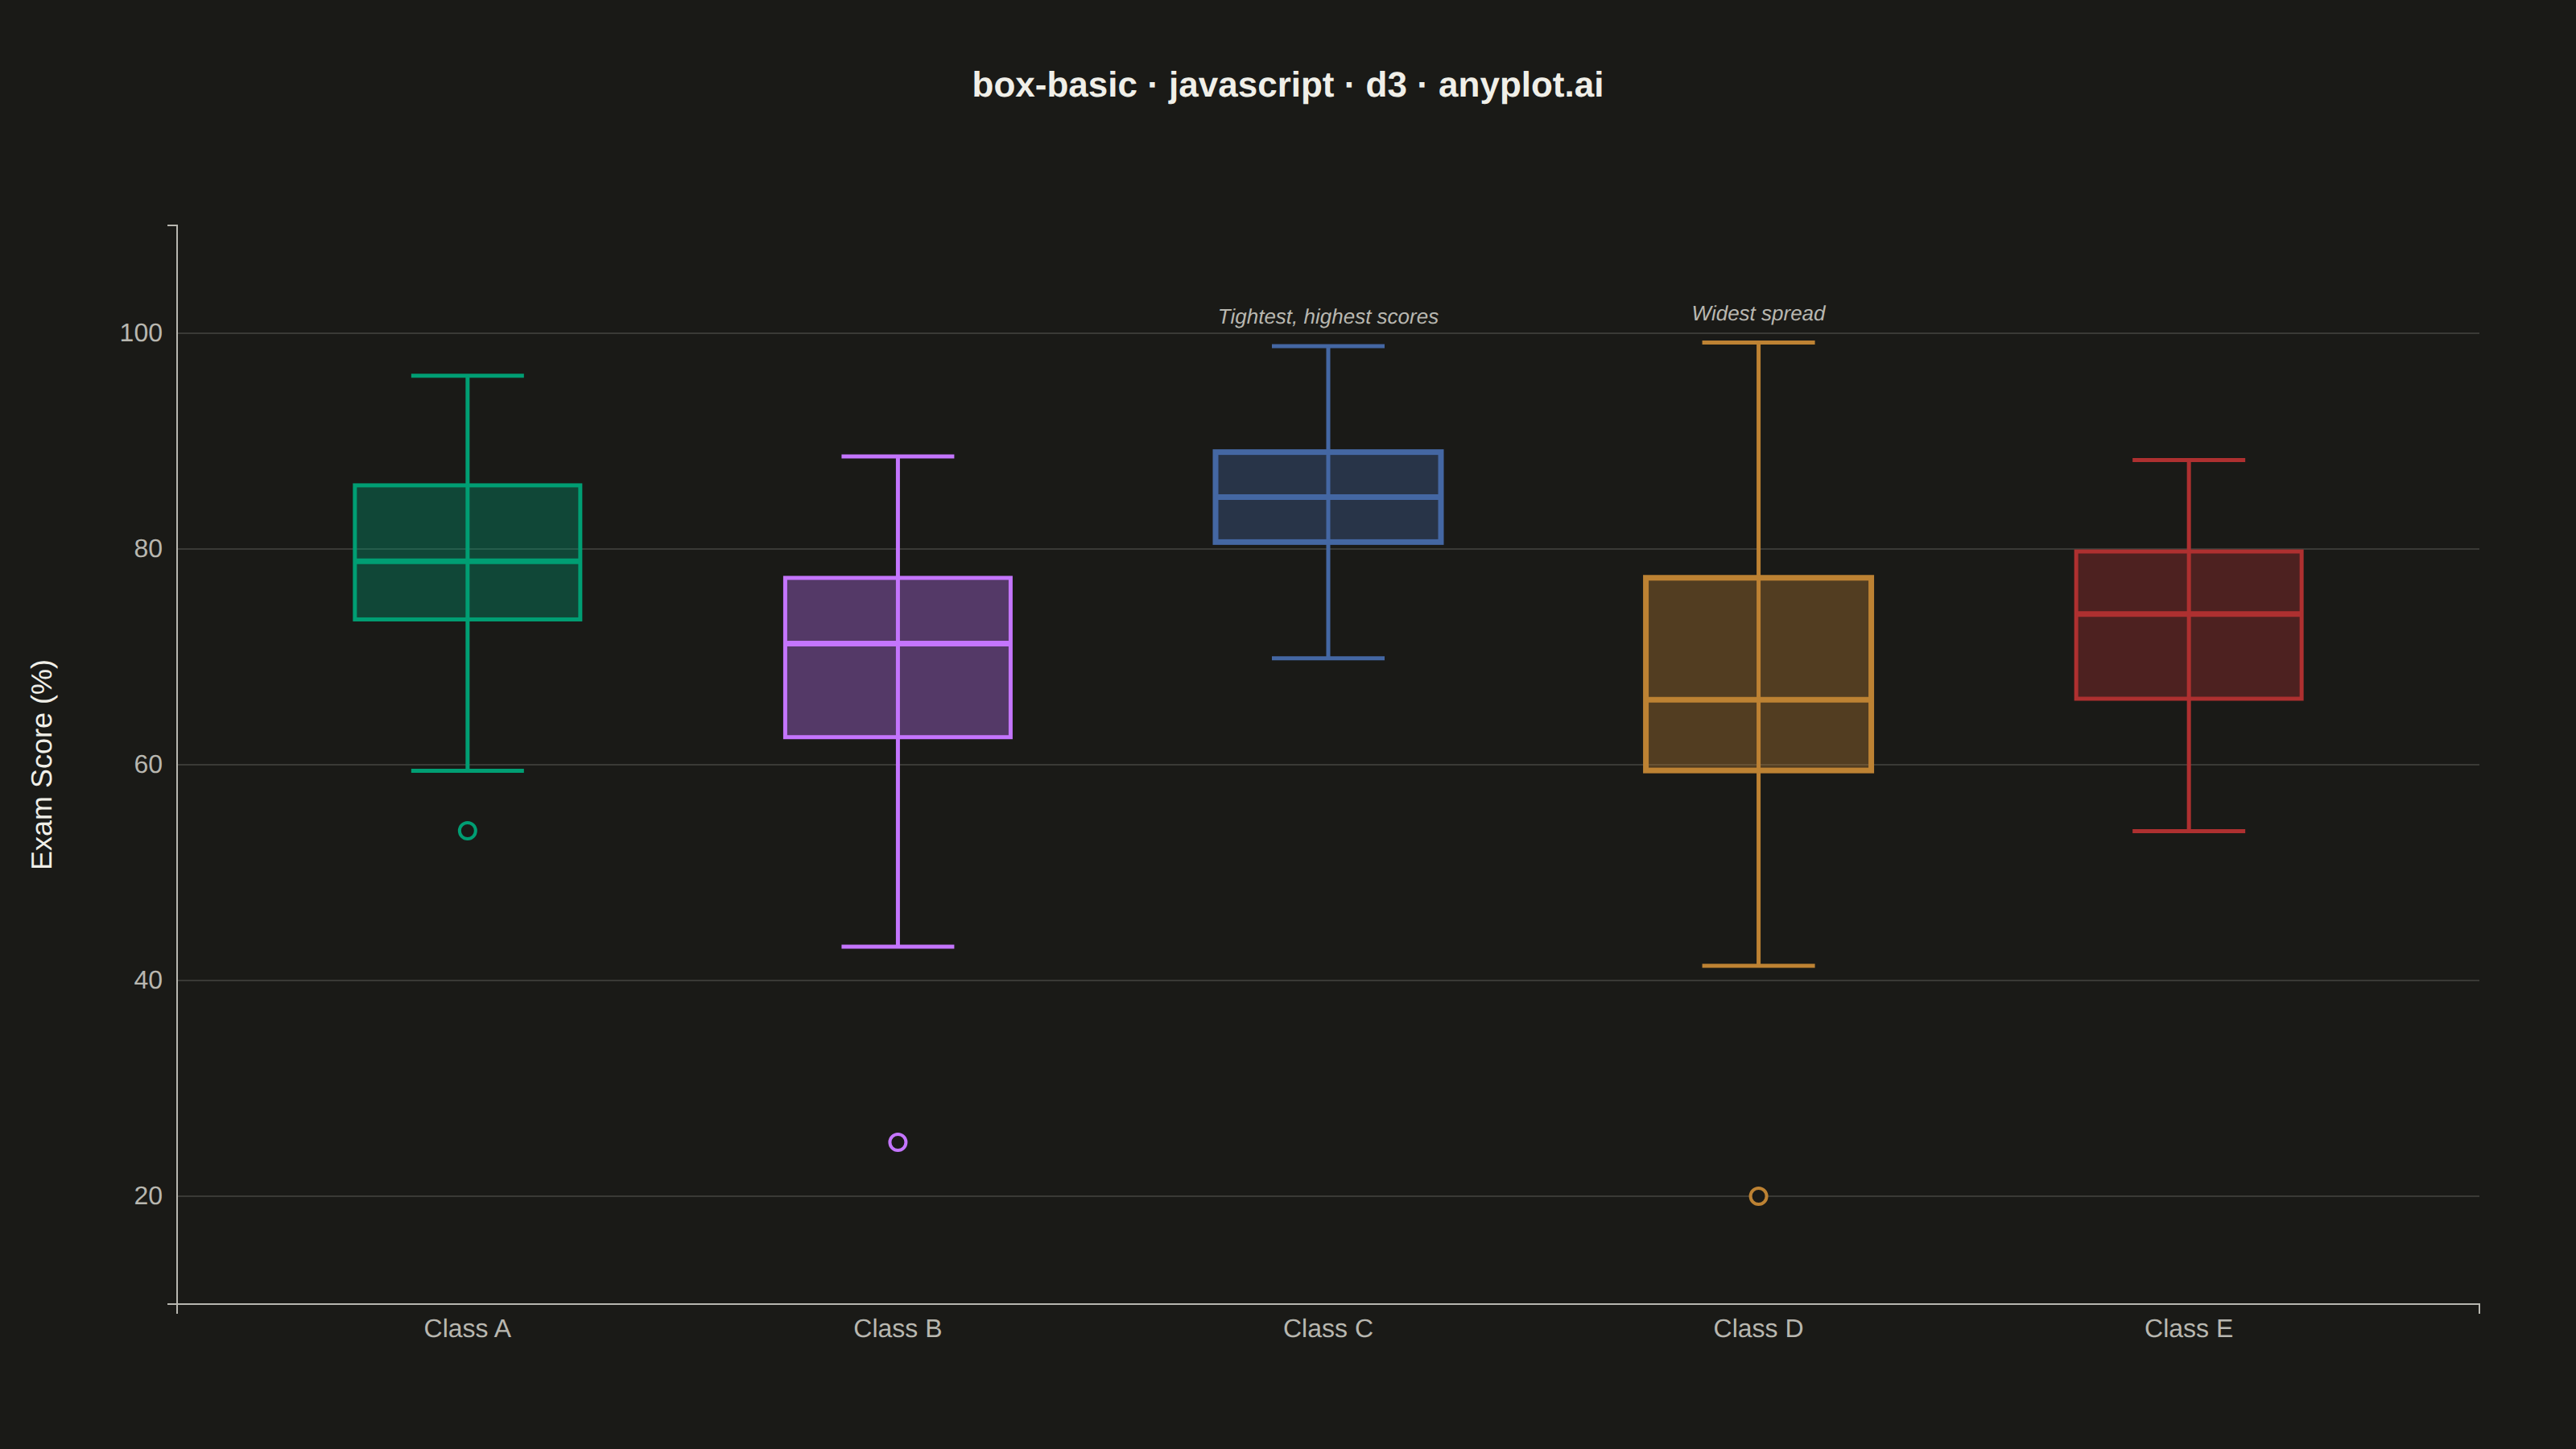
A box plot (box-and-whisker plot) showing the distribution of numerical data through quartiles. Displays the median, first and third quartiles as a box, with whiskers extending to show the data range. Essential for comparing distributions across categories and identifying outliers.
// anyplot.ai
// box-basic: Basic Box Plot
// Library: d3 7.9.0 | JavaScript 22.23.2
// Quality: 92/100 | Created: 2026-08-24
//# anyplot-orientation: landscape

const t = window.ANYPLOT_TOKENS;
const { width, height } = window.ANYPLOT_SIZE;

// --- Deterministic PRNG (LCG) + Box-Muller normal sampler -------------------
function makeRng(seed) {
  let state = seed;
  return () => {
    state = (state * 1664525 + 1013904223) % 4294967296;
    return state / 4294967296;
  };
}
const rng = makeRng(42);
function randNormal(mean, std) {
  const u1 = Math.max(rng(), 1e-9);
  const u2 = rng();
  const z = Math.sqrt(-2 * Math.log(u1)) * Math.cos(2 * Math.PI * u2);
  return mean + z * std;
}

// --- Data: exam scores across 5 classes -------------------------------------
const classConfig = [
  { label: "Class A", n: 62, mean: 78, std: 9 },
  { label: "Class B", n: 71, mean: 71, std: 12 },
  { label: "Class C", n: 55, mean: 84, std: 6 },
  { label: "Class D", n: 68, mean: 68, std: 14 },
  { label: "Class E", n: 60, mean: 74, std: 10 },
];

const dataset = classConfig.map((c) => ({
  label: c.label,
  scores: Array.from({ length: c.n }, () =>
    Math.min(100, Math.max(20, randNormal(c.mean, c.std)))
  ),
}));

// Inject a couple of deterministic low-score outliers beyond Class A's so the
// "outliers as individual points" feature reads clearly across multiple categories.
dataset[1].scores.push(25); // Class B
dataset[3].scores.push(20); // Class D

// --- Box-plot statistics (median, quartiles, 1.5*IQR whiskers, outliers) ---
const boxStats = dataset.map((d) => {
  const sorted = [...d.scores].sort((a, b) => a - b);
  const q1 = d3.quantile(sorted, 0.25);
  const median = d3.quantile(sorted, 0.5);
  const q3 = d3.quantile(sorted, 0.75);
  const iqr = q3 - q1;
  const lowerFence = q1 - 1.5 * iqr;
  const upperFence = q3 + 1.5 * iqr;
  const inliers = sorted.filter((v) => v >= lowerFence && v <= upperFence);
  const outliers = sorted.filter((v) => v < lowerFence || v > upperFence);
  return {
    label: d.label,
    q1,
    median,
    q3,
    whiskerMin: d3.min(inliers),
    whiskerMax: d3.max(inliers),
    outliers,
  };
});

// --- Layout -------------------------------------------------------------
const margin = { top: 140, right: 60, bottom: 90, left: 110 };
const iw = width - margin.left - margin.right;
const ih = height - margin.top - margin.bottom;

const svg = d3.select("#container").append("svg").attr("width", width).attr("height", height);
const g = svg.append("g").attr("transform", `translate(${margin.left},${margin.top})`);

// --- Scales ---------------------------------------------------------------
const x = d3
  .scaleBand()
  .domain(boxStats.map((d) => d.label))
  .range([0, iw])
  .padding(0.35);

const allValues = boxStats.flatMap((d) => [d.whiskerMin, d.whiskerMax, ...d.outliers]);
const y = d3
  .scaleLinear()
  .domain([d3.min(allValues) - 5, d3.max(allValues) + 5])
  .nice()
  .range([ih, 0]);

const color = d3.scaleOrdinal().domain(boxStats.map((d) => d.label)).range(t.palette);
const boxWidth = Math.min(x.bandwidth(), 140);

// Insight annotations: draw the eye to the tightest vs. the widest distribution
const insightNotes = { "Class C": "Tightest, highest scores", "Class D": "Widest spread" };

// --- Y-axis gridlines (subtle, y-only) -------------------------------------
g.append("g")
  .call(d3.axisLeft(y).ticks(6).tickSize(-iw).tickFormat(""))
  .call((sel) => sel.select(".domain").remove())
  .selectAll("line")
  .attr("stroke", t.grid);

// --- Box groups -------------------------------------------------------------
const groups = g
  .selectAll(".box-group")
  .data(boxStats)
  .join("g")
  .attr("transform", (d) => `translate(${x(d.label) + x.bandwidth() / 2 - boxWidth / 2},0)`);

// Whisker stem
groups
  .append("line")
  .attr("x1", boxWidth / 2)
  .attr("x2", boxWidth / 2)
  .attr("y1", (d) => y(d.whiskerMin))
  .attr("y2", (d) => y(d.whiskerMax))
  .attr("stroke", (d) => color(d.label))
  .attr("stroke-width", 2.5);

// Whisker caps
for (const key of ["whiskerMin", "whiskerMax"]) {
  groups
    .append("line")
    .attr("x1", boxWidth * 0.25)
    .attr("x2", boxWidth * 0.75)
    .attr("y1", (d) => y(d[key]))
    .attr("y2", (d) => y(d[key]))
    .attr("stroke", (d) => color(d.label))
    .attr("stroke-width", 2.5);
}

// Box (IQR)
groups
  .append("rect")
  .attr("x", 0)
  .attr("width", boxWidth)
  .attr("y", (d) => y(d.q3))
  .attr("height", (d) => y(d.q1) - y(d.q3))
  .attr("fill", (d) => color(d.label))
  .attr("fill-opacity", 0.35)
  .attr("stroke", (d) => color(d.label))
  .attr("stroke-width", (d) => (insightNotes[d.label] ? 3.5 : 2.5));

// Median line
groups
  .append("line")
  .attr("x1", 0)
  .attr("x2", boxWidth)
  .attr("y1", (d) => y(d.median))
  .attr("y2", (d) => y(d.median))
  .attr("stroke", (d) => color(d.label))
  .attr("stroke-width", 3.5);

groups
  .filter((d) => insightNotes[d.label])
  .append("text")
  .attr("x", boxWidth / 2)
  .attr("y", (d) => y(d.whiskerMax) - 14)
  .attr("text-anchor", "middle")
  .attr("fill", t.inkSoft)
  .style("font-size", "13px")
  .style("font-style", "italic")
  .text((d) => insightNotes[d.label]);

// Outliers
groups.each(function (d) {
  d3.select(this)
    .selectAll(".outlier")
    .data(d.outliers)
    .join("circle")
    .attr("class", "outlier")
    .attr("cx", boxWidth / 2)
    .attr("cy", (v) => y(v))
    .attr("r", 5)
    .attr("fill", t.pageBg)
    .attr("stroke", color(d.label))
    .attr("stroke-width", 2);
});

// --- Axes -------------------------------------------------------------------
const xAxis = g.append("g").attr("transform", `translate(0,${ih})`).call(d3.axisBottom(x));
const yAxis = g.append("g").call(d3.axisLeft(y).ticks(6));
for (const ax of [xAxis, yAxis]) {
  ax.selectAll("text").attr("fill", t.inkSoft).style("font-size", "16px");
  ax.selectAll("line").remove();
  ax.select(".domain").attr("stroke", t.inkSoft);
}

g.append("text")
  .attr("transform", "rotate(-90)")
  .attr("x", -ih / 2)
  .attr("y", -78)
  .attr("text-anchor", "middle")
  .attr("fill", t.ink)
  .style("font-size", "18px")
  .text("Exam Score (%)");

// --- Title --------------------------------------------------------------
svg
  .append("text")
  .attr("x", width / 2)
  .attr("y", 60)
  .attr("text-anchor", "middle")
  .attr("fill", t.ink)
  .style("font-size", "22px")
  .style("font-weight", "600")
  .text("box-basic · javascript · d3 · anyplot.ai");
Runnable source as JSON, for any HTTP client: https://api.anyplot.ai/specs/box-basic/d3/code. Any spec id and library id listed in llms-full.txt fit the same URL shape; every URL below is complete and callable.
{
  "spec_id": "box-basic",
  "language": "javascript",
  "library": "d3",
  "page": "https://anyplot.ai/box-basic/javascript/d3",
  "hub": "https://anyplot.ai/box-basic",
  "code_json": "https://api.anyplot.ai/specs/box-basic/d3/code",
  "spec_json": "https://api.anyplot.ai/specs/box-basic",
  "render_light_png": "https://storage.googleapis.com/anyplot-images/plots/box-basic/javascript/d3/plot-light.png",
  "render_dark_png": "https://storage.googleapis.com/anyplot-images/plots/box-basic/javascript/d3/plot-dark.png",
  "interactive_light_html": "https://storage.googleapis.com/anyplot-images/plots/box-basic/javascript/d3/plot-light.html",
  "interactive_dark_html": "https://storage.googleapis.com/anyplot-images/plots/box-basic/javascript/d3/plot-dark.html",
  "quality_score": 92.0,
  "license": "MIT",
  "guide": "https://anyplot.ai/llms.txt"
}
Part of Basic Box Plot on anyplot.ai.