The same plot in 14 other libraries — JavaScript: D3.js, Apache ECharts, Highcharts, MUI X Charts; Python: Altair, Bokeh, lets-plot, Matplotlib, Plotly, plotnine, Pygal, Seaborn; R: ggplot2; Julia: Makie.jl. Compare all 15 side by side: Basic Bump Chart in Python, R, Julia and JavaScript.
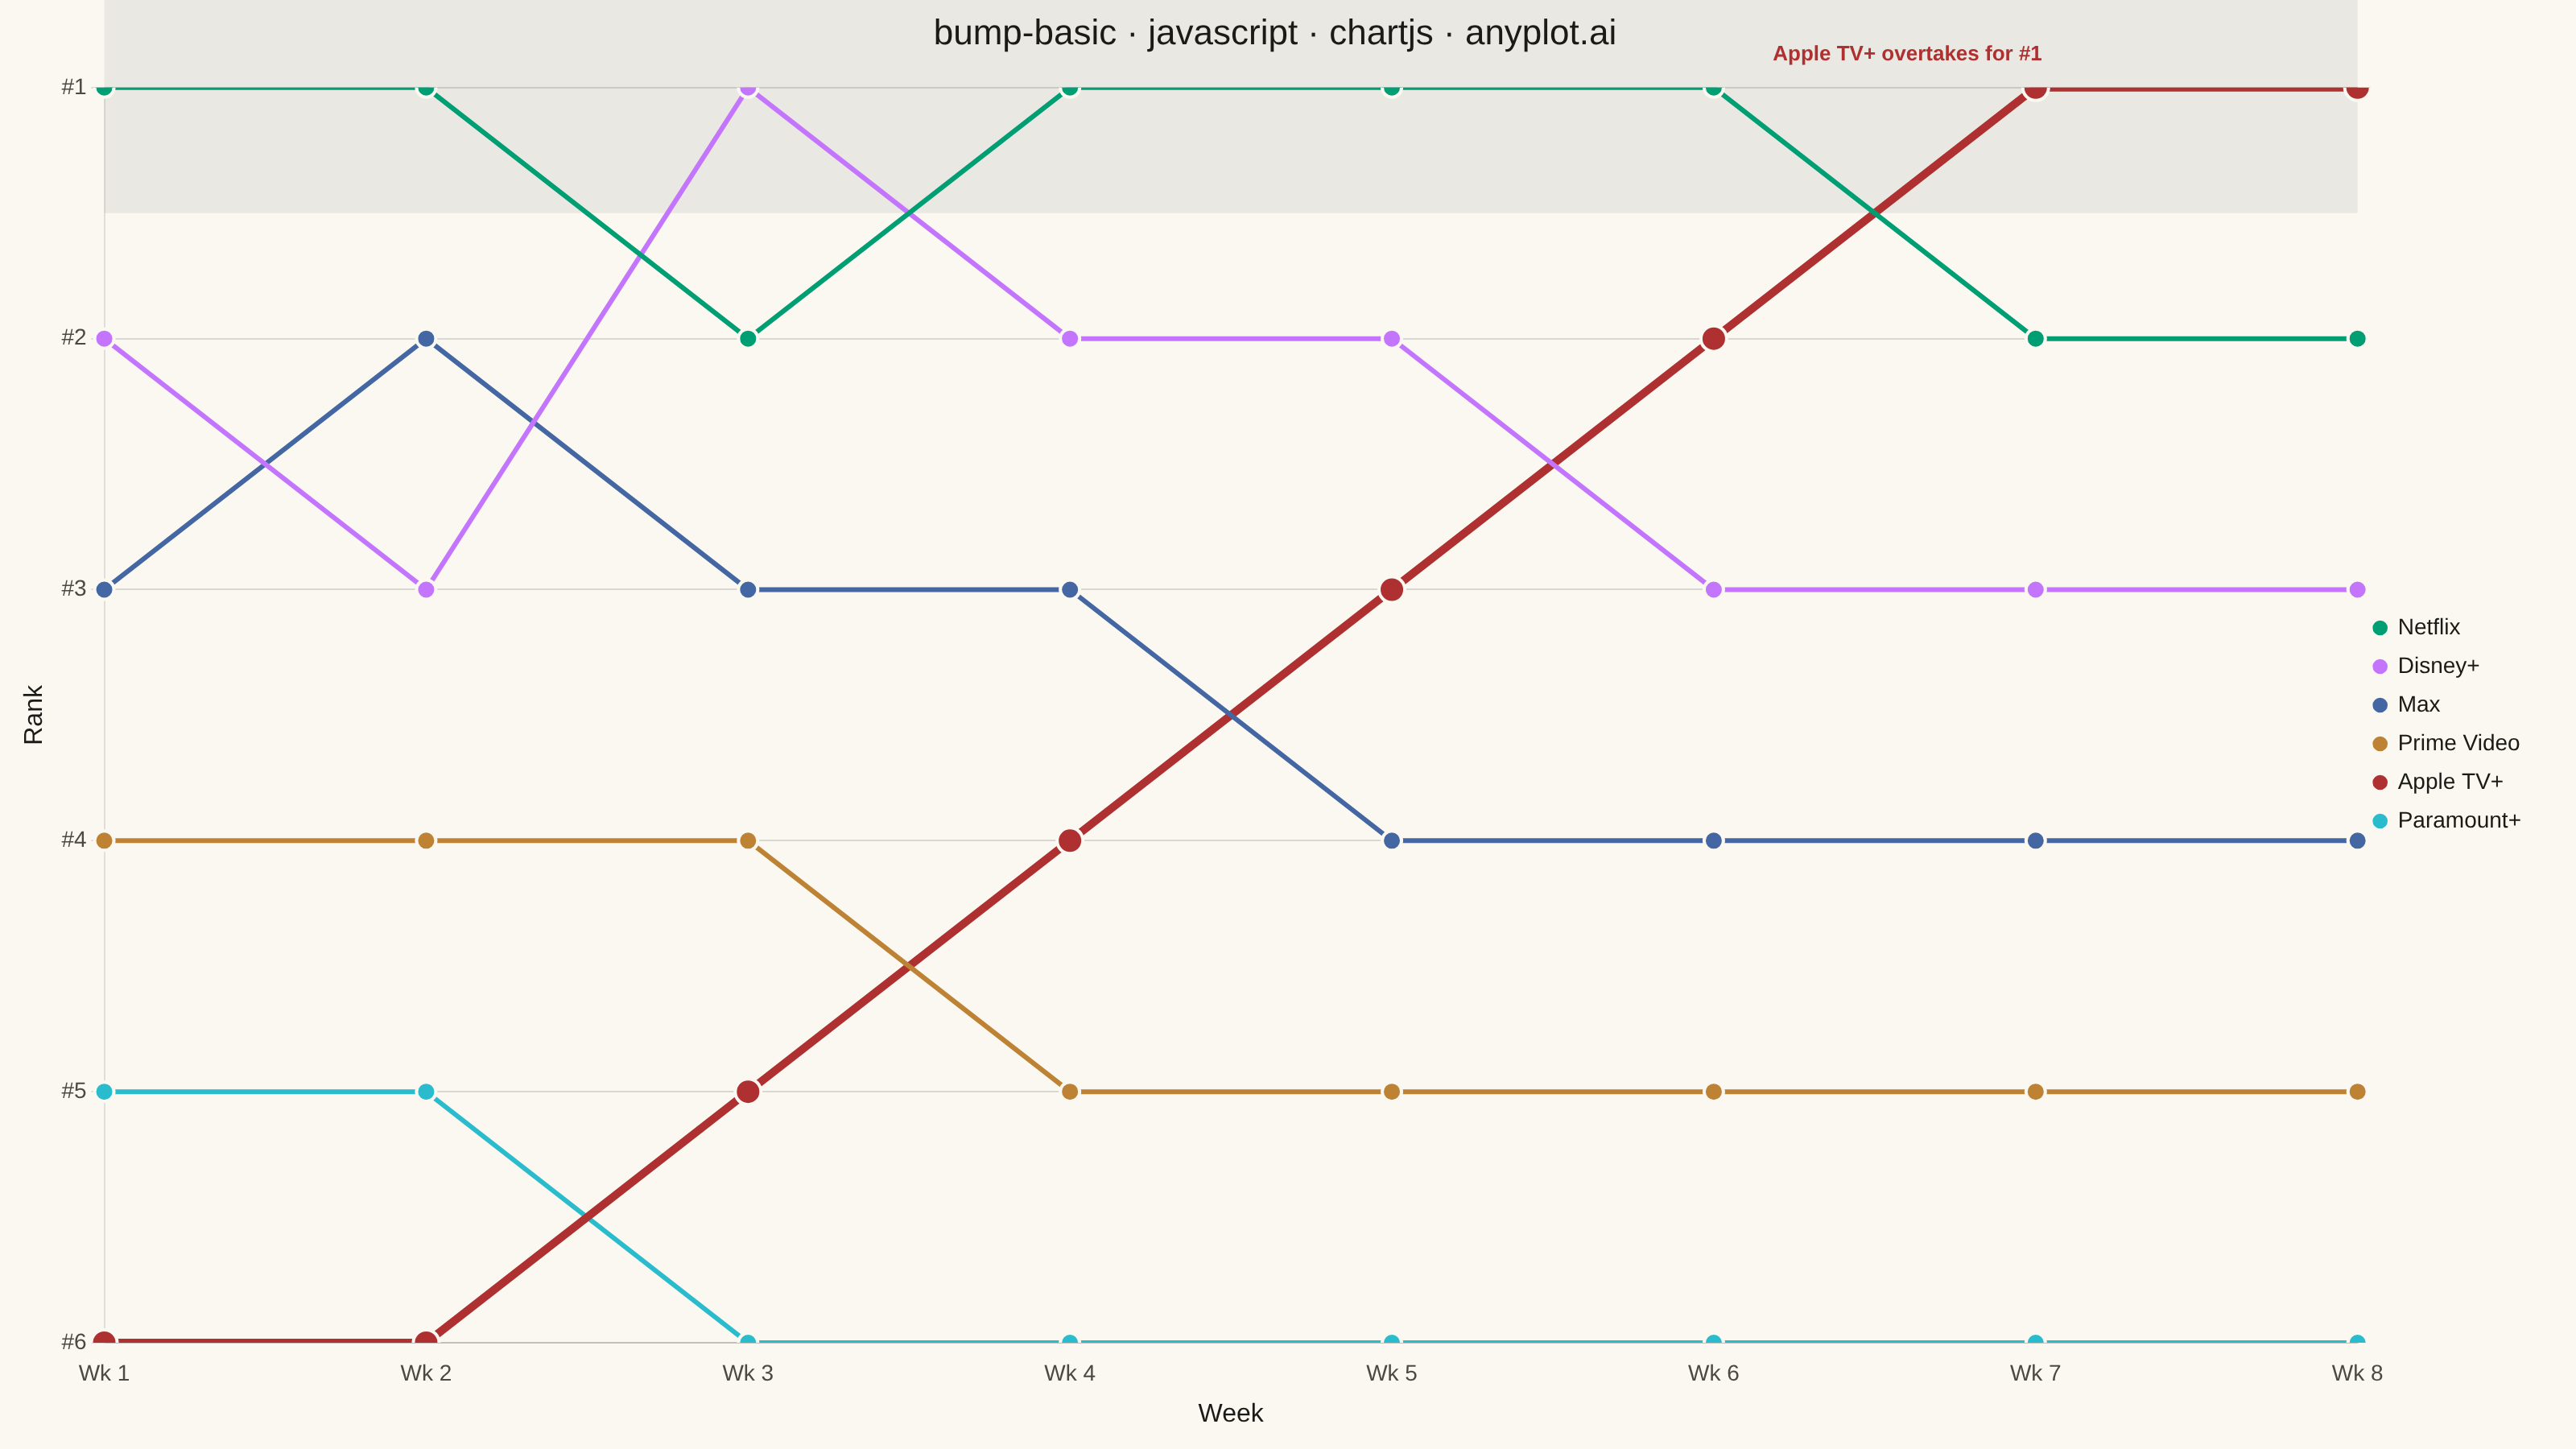
A bump chart visualizes how rankings change over time by plotting rank positions and connecting them with lines. Unlike line charts that show values, bump charts focus specifically on ordinal rankings, making it easy to track position changes, overtakes, and rank stability across time periods.
// anyplot.ai
// bump-basic: Basic Bump Chart
// Library: chartjs 4.4.7 | JavaScript 22.23.2
// Quality: 95/100 | Created: 2026-08-24

const t = window.ANYPLOT_TOKENS;

// --- Data (in-memory, deterministic) ----------------------------------------
// Streaming platform weekly top-6 popularity ranking (lower rank = more popular).
// Apple TV+ launches a hit series mid-season and climbs the full range from
// 6th to 1st, overtaking Netflix (the incumbent leader) by week 7.
const weeks = ["Wk 1", "Wk 2", "Wk 3", "Wk 4", "Wk 5", "Wk 6", "Wk 7", "Wk 8"];
const platforms = [
  { name: "Netflix", ranks: [1, 1, 2, 1, 1, 1, 2, 2] },
  { name: "Disney+", ranks: [2, 3, 1, 2, 2, 3, 3, 3] },
  { name: "Max", ranks: [3, 2, 3, 3, 4, 4, 4, 4] },
  { name: "Prime Video", ranks: [4, 4, 4, 5, 5, 5, 5, 5] },
  { name: "Apple TV+", ranks: [6, 6, 5, 4, 3, 2, 1, 1] },
  { name: "Paramount+", ranks: [5, 5, 6, 6, 6, 6, 6, 6] },
];
const leadIndex = 4; // Apple TV+ — the season's storyline, bottom tier to #1
const overtakeWeekIndex = 6; // "Wk 7", first week Apple TV+ reaches rank #1

// --- Mount -------------------------------------------------------------------
const canvas = document.createElement("canvas");
document.getElementById("container").appendChild(canvas);

// --- Plugins (native Chart.js plugin API, no external annotation package) ----
// Subtle band across the #1 row so the "race to the top" reads at a glance.
const rankOneHighlight = {
  id: "rankOneHighlight",
  beforeDatasetsDraw(chart) {
    const { ctx, chartArea, scales } = chart;
    const halfStep = Math.abs(scales.y.getPixelForValue(2) - scales.y.getPixelForValue(1)) / 2;
    const yCenter = scales.y.getPixelForValue(1);
    ctx.save();
    ctx.globalAlpha = 0.07;
    ctx.fillStyle = t.ink;
    ctx.fillRect(chartArea.left, yCenter - halfStep, chartArea.width, halfStep * 2);
    ctx.restore();
  },
};

// Callout marking the overtake, computed from the same scale the lines use.
const overtakeAnnotation = {
  id: "overtakeAnnotation",
  afterDatasetsDraw(chart) {
    const { ctx, scales } = chart;
    const x = scales.x.getPixelForValue(overtakeWeekIndex);
    const y = scales.y.getPixelForValue(1);
    ctx.save();
    ctx.font = "600 13px sans-serif";
    ctx.fillStyle = t.palette[leadIndex % t.palette.length];
    ctx.textAlign = "right";
    ctx.textBaseline = "bottom";
    ctx.fillText("Apple TV+ overtakes for #1", x + 4, y - 14);
    ctx.restore();
  },
};

// --- Chart ---------------------------------------------------------------
new Chart(canvas, {
  type: "line",
  data: {
    labels: weeks,
    datasets: platforms.map((platform, i) => ({
      label: platform.name,
      data: platform.ranks,
      borderColor: t.palette[i % t.palette.length],
      backgroundColor: t.palette[i % t.palette.length],
      borderWidth: i === leadIndex ? 5 : 3,
      pointRadius: i === leadIndex ? 8 : 6,
      pointHoverRadius: i === leadIndex ? 8 : 6,
      pointBackgroundColor: t.palette[i % t.palette.length],
      pointBorderColor: t.pageBg,
      pointBorderWidth: 2,
      tension: 0,
      fill: false,
    })),
  },
  options: {
    responsive: true,
    maintainAspectRatio: false,
    animation: false,
    layout: { padding: { top: 8, right: 24, bottom: 8, left: 8 } },
    plugins: {
      title: {
        display: true,
        text: "bump-basic · javascript · chartjs · anyplot.ai",
        color: t.ink,
        font: { size: 22, weight: "500" },
        padding: { bottom: 20 },
      },
      legend: {
        position: "right",
        labels: {
          color: t.ink,
          font: { size: 14 },
          usePointStyle: true,
          pointStyle: "circle",
          boxWidth: 8,
          boxHeight: 8,
        },
      },
    },
    scales: {
      x: {
        title: { display: true, text: "Week", color: t.ink, font: { size: 16 } },
        ticks: { color: t.inkSoft, font: { size: 14 } },
        grid: { display: false },
      },
      y: {
        reverse: true,
        min: 1,
        max: platforms.length,
        ticks: {
          stepSize: 1,
          color: t.inkSoft,
          font: { size: 14 },
          callback: (value) => `#${value}`,
        },
        title: { display: true, text: "Rank", color: t.ink, font: { size: 16 } },
        grid: { color: t.grid },
      },
    },
  },
  plugins: [rankOneHighlight, overtakeAnnotation],
});
Runnable source as JSON, for any HTTP client: https://api.anyplot.ai/specs/bump-basic/chartjs/code. Any spec id and library id listed in llms-full.txt fit the same URL shape; every URL below is complete and callable.
{
  "spec_id": "bump-basic",
  "language": "javascript",
  "library": "chartjs",
  "page": "https://anyplot.ai/bump-basic/javascript/chartjs",
  "hub": "https://anyplot.ai/bump-basic",
  "code_json": "https://api.anyplot.ai/specs/bump-basic/chartjs/code",
  "spec_json": "https://api.anyplot.ai/specs/bump-basic",
  "render_light_png": "https://storage.googleapis.com/anyplot-images/plots/bump-basic/javascript/chartjs/plot-light.png",
  "render_dark_png": "https://storage.googleapis.com/anyplot-images/plots/bump-basic/javascript/chartjs/plot-dark.png",
  "interactive_light_html": "https://storage.googleapis.com/anyplot-images/plots/bump-basic/javascript/chartjs/plot-light.html",
  "interactive_dark_html": "https://storage.googleapis.com/anyplot-images/plots/bump-basic/javascript/chartjs/plot-dark.html",
  "quality_score": 95.0,
  "license": "MIT",
  "guide": "https://anyplot.ai/llms.txt"
}
Part of Basic Bump Chart on anyplot.ai.