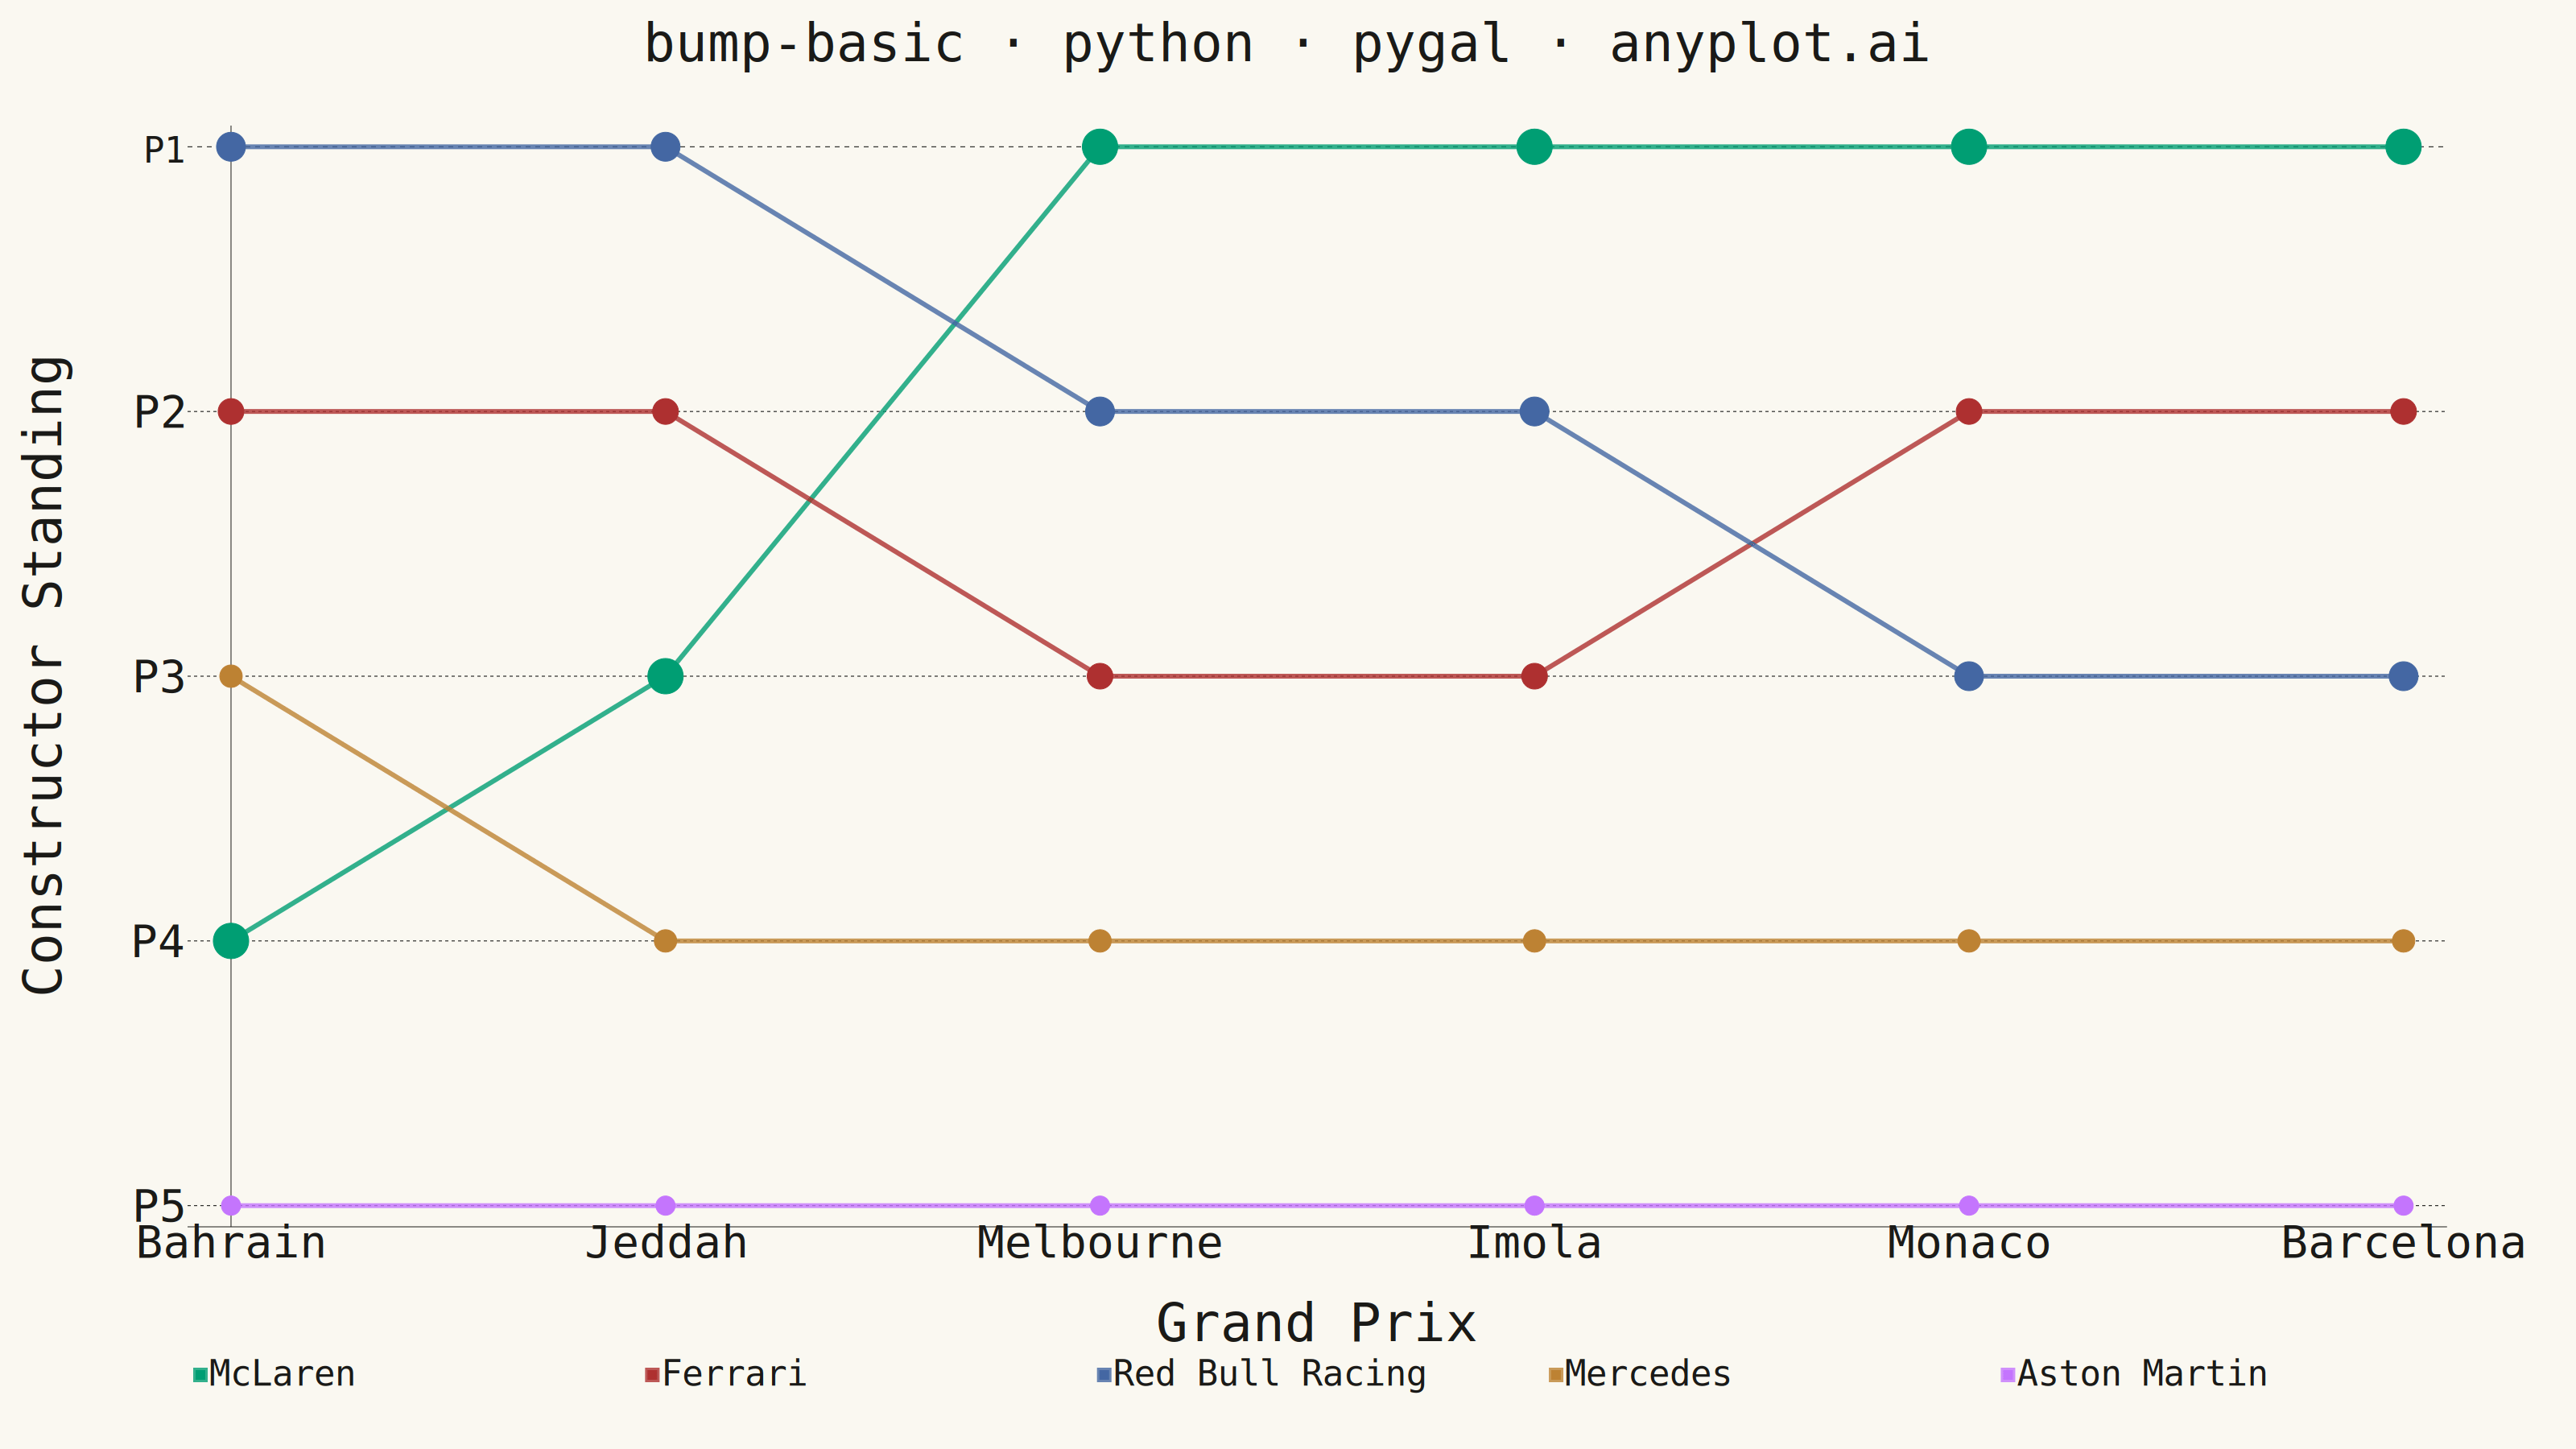
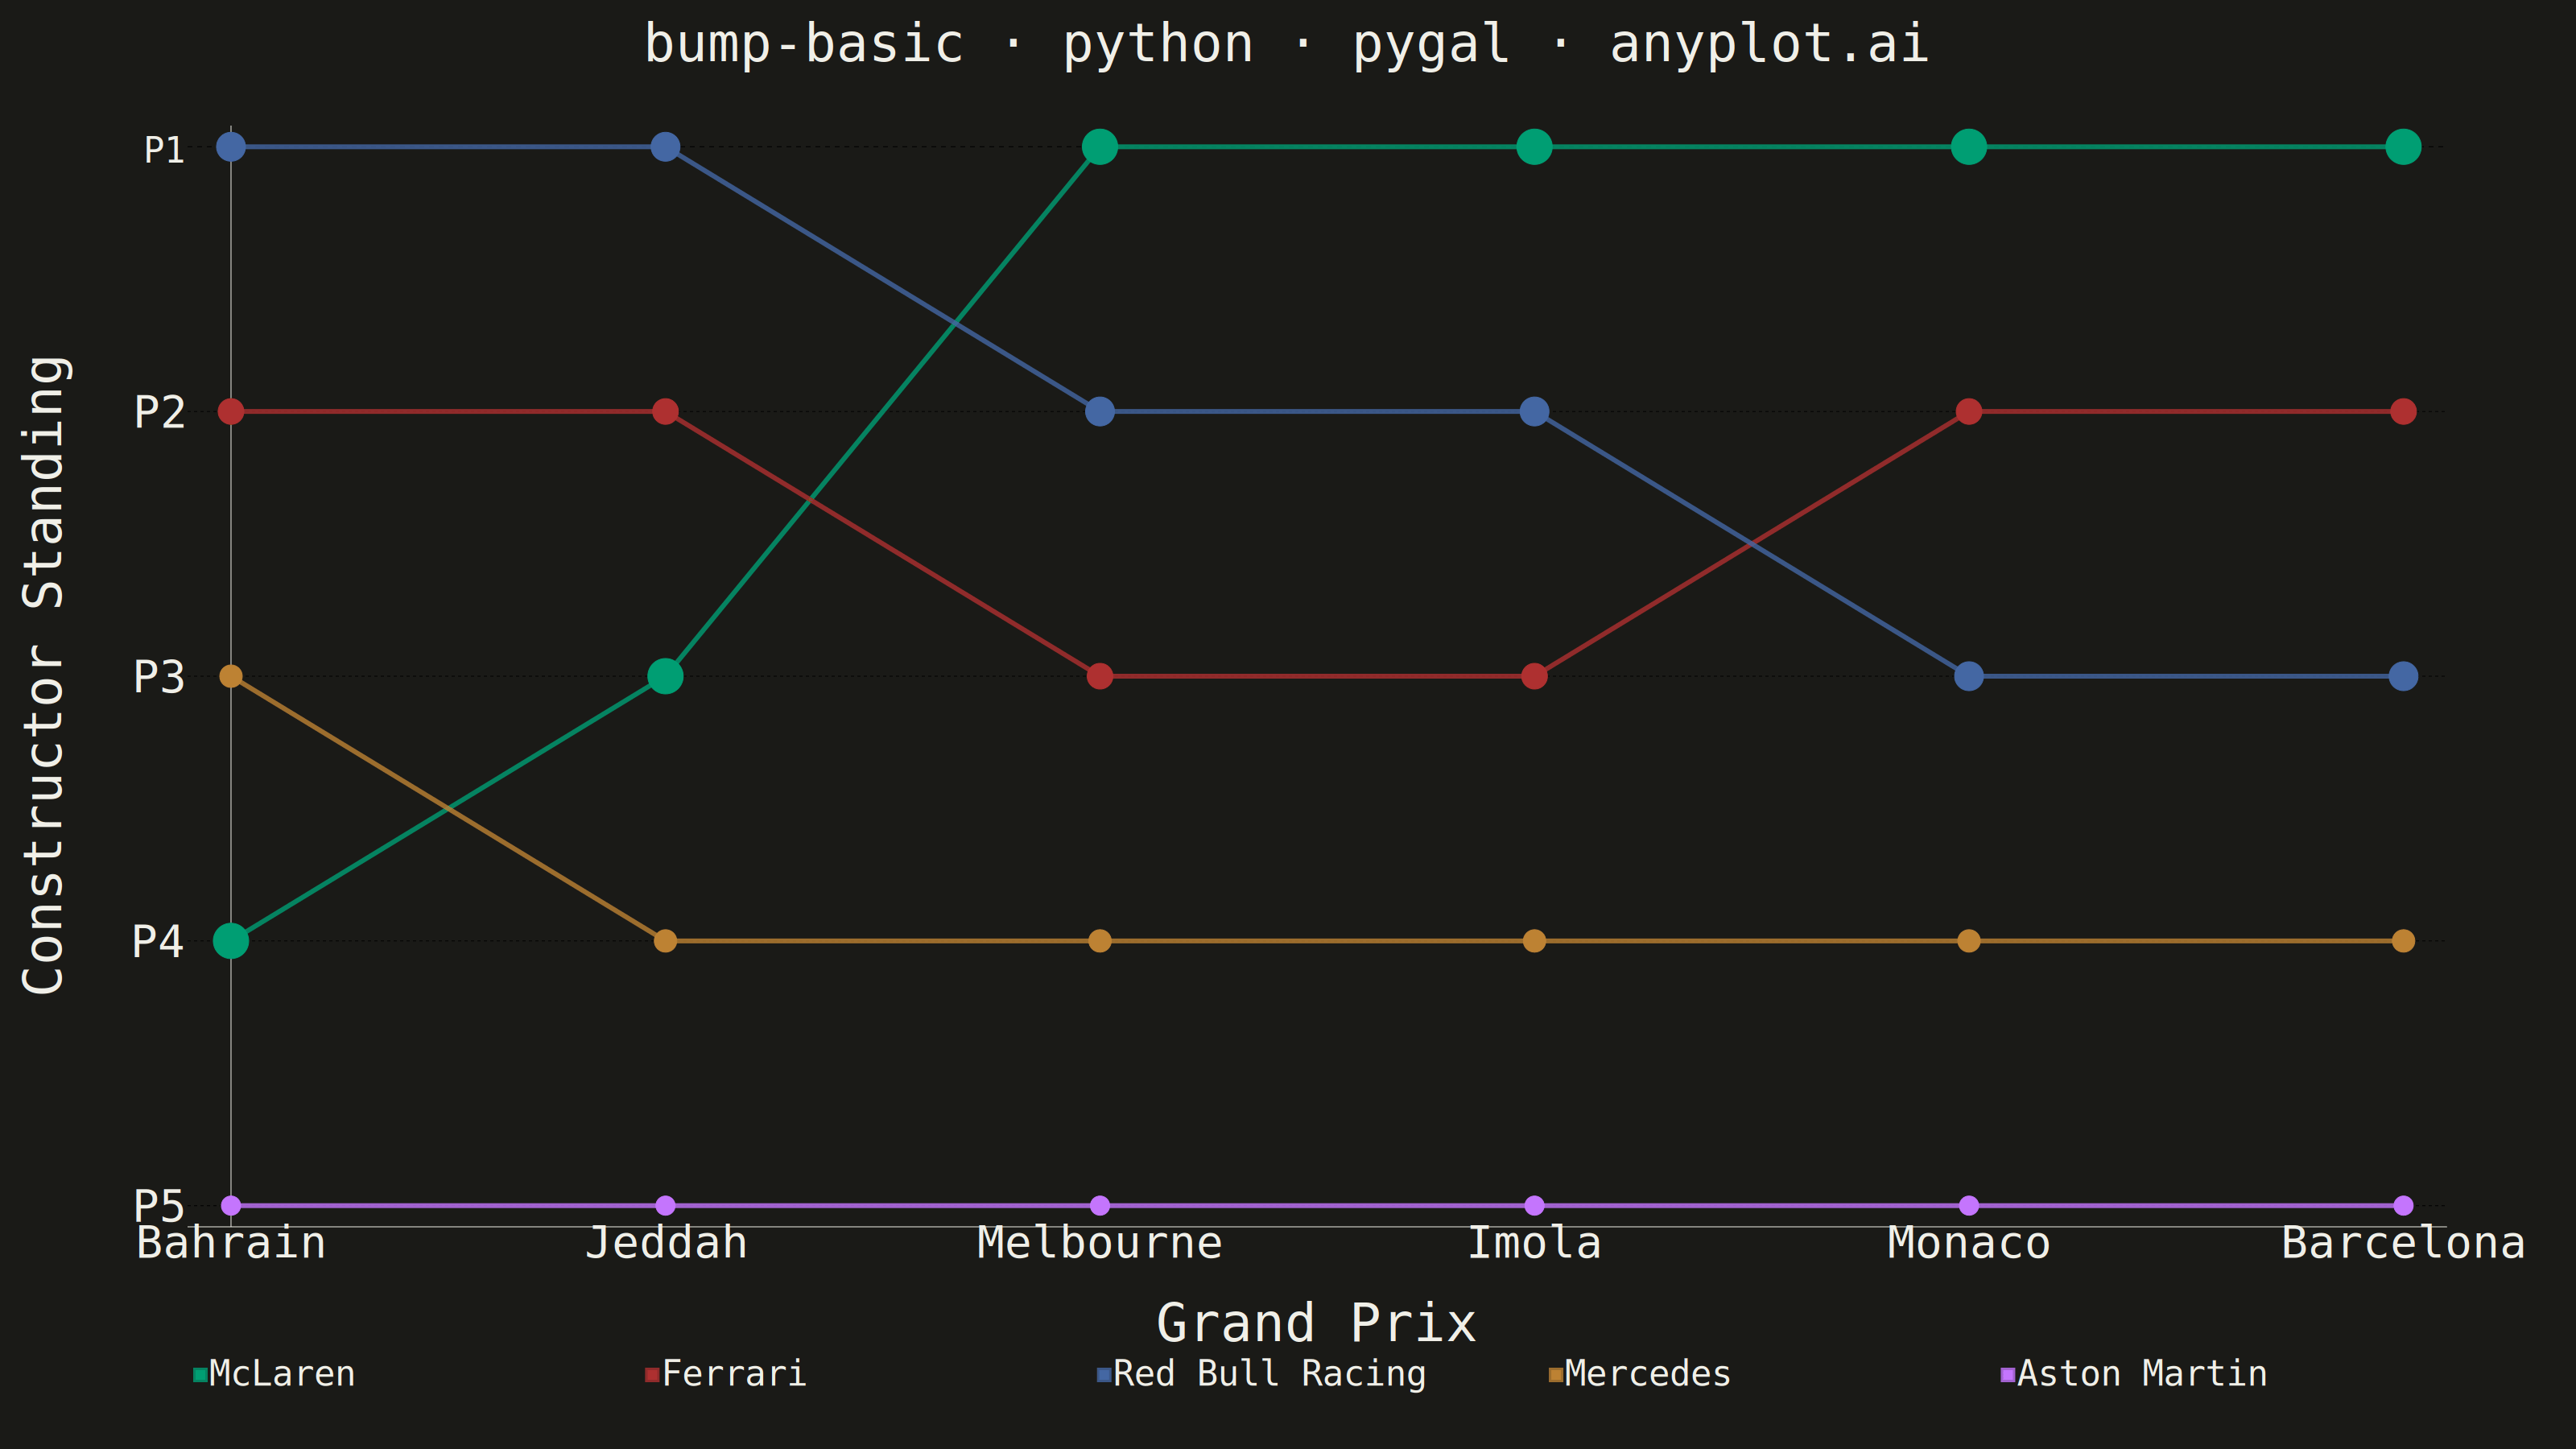
A bump chart visualizes how rankings change over time by plotting rank positions and connecting them with lines. Unlike line charts that show values, bump charts focus specifically on ordinal rankings, making it easy to track position changes, overtakes, and rank stability across time periods.
""" anyplot.ai
bump-basic: Basic Bump Chart
Library: pygal 3.1.0 | Python 3.13.13
Quality: 87/100 | Updated: 2026-05-29
"""

import os

import pygal
from pygal.style import Style


THEME = os.getenv("ANYPLOT_THEME", "light")
PAGE_BG = "#FAF8F1" if THEME == "light" else "#1A1A17"
INK = "#1A1A17" if THEME == "light" else "#F0EFE8"
INK_MUTED = "#6B6A63" if THEME == "light" else "#A8A79F"

# Imprint palette — semantic assignment for F1 teams:
# McLaren (protagonist, rising) → brand green; Ferrari → matte-red (iconic);
# Red Bull → blue (close to livery); others → canonical tail positions
SERIES_COLORS = (
    "#009E73",  # McLaren — brand green, first series
    "#AE3030",  # Ferrari — matte red, semantic: iconic Ferrari red
    "#4467A3",  # Red Bull Racing — blue, close to livery
    "#BD8233",  # Mercedes — ochre
    "#C475FD",  # Aston Martin — lavender
)

# Data — F1 constructor standings across 6 Grand Prix weekends
entities = ["McLaren", "Ferrari", "Red Bull Racing", "Mercedes", "Aston Martin"]
periods = ["Bahrain", "Jeddah", "Melbourne", "Imola", "Monaco", "Barcelona"]

# Rankings (1 = leading); McLaren surges from P4 to lead by Melbourne
rankings = {
    "McLaren": [4, 3, 1, 1, 1, 1],
    "Ferrari": [2, 2, 3, 3, 2, 2],
    "Red Bull Racing": [1, 1, 2, 2, 3, 3],
    "Mercedes": [3, 4, 4, 4, 4, 4],
    "Aston Martin": [5, 5, 5, 5, 5, 5],
}

max_rank = len(entities)

# Y-axis is inverted: rank 1 at top, rank 5 at bottom
inverted_rankings = {e: [max_rank + 1 - r for r in ranks] for e, ranks in rankings.items()}

# Title font size — mandated format is ~40 chars (<67 baseline), no shrink needed
title_str = "bump-basic · python · pygal · anyplot.ai"
n = len(title_str)
ratio = 67 / n if n > 67 else 1.0
title_font_size = max(44, round(66 * ratio))

custom_style = Style(
    background=PAGE_BG,
    plot_background=PAGE_BG,
    foreground=INK,
    foreground_strong=INK,
    foreground_subtle=INK_MUTED,
    colors=SERIES_COLORS,
    title_font_size=title_font_size,
    label_font_size=56,
    major_label_font_size=44,
    legend_font_size=44,
    value_font_size=36,
    stroke_width=6,
    opacity=1.0,
    opacity_hover=1.0,
    transition="200ms ease-in",
)

# Per-series stroke and dot sizes — visual hierarchy: protagonist boldest
stroke_widths = {"McLaren": 18, "Ferrari": 12, "Red Bull Racing": 14, "Mercedes": 10, "Aston Martin": 12}
dot_sizes_map = {"McLaren": 22, "Ferrari": 16, "Red Bull Racing": 18, "Mercedes": 14, "Aston Martin": 16}

chart = pygal.Line(
    width=3200,
    height=1800,
    style=custom_style,
    title=title_str,
    x_title="Grand Prix",
    y_title="Constructor Standing",
    show_dots=True,
    dots_size=14,
    show_x_guides=False,
    show_y_guides=False,
    x_label_rotation=0,
    legend_at_bottom=True,
    legend_at_bottom_columns=5,
    truncate_legend=-1,
    show_legend=True,
    interpolate=None,
    min_scale=1,
    max_scale=max_rank,
    margin_top=80,
    margin_right=160,
    margin_bottom=40,
    margin_left=80,
    value_formatter=lambda v: f"P{max_rank + 1 - int(v)}" if v == int(v) else "",
    tooltip_border_radius=10,
    tooltip_fancy_mode=True,
    human_readable=True,
    pretty_print=True,
)

chart.x_labels = periods

# Dict-format y_labels map inverted values to human-readable rank positions (P1–P5)
chart.y_labels = [{"value": max_rank + 1 - i, "label": f"P{i}"} for i in range(1, max_rank + 1)]

for entity in entities:
    chart.add(
        entity,
        inverted_rankings[entity],
        stroke_style={"width": stroke_widths[entity]},
        dots_size=dot_sizes_map[entity],
    )

# Save
chart.render_to_png(f"plot-{THEME}.png")
chart.render_to_file(f"plot-{THEME}.html")
Runnable source as JSON, for any HTTP client: https://api.anyplot.ai/specs/bump-basic/pygal/code. Any spec id and library id listed in llms-full.txt fit the same URL shape; every URL below is complete and callable.
{
  "spec_id": "bump-basic",
  "language": "python",
  "library": "pygal",
  "page": "https://anyplot.ai/bump-basic/python/pygal",
  "hub": "https://anyplot.ai/bump-basic",
  "code_json": "https://api.anyplot.ai/specs/bump-basic/pygal/code",
  "spec_json": "https://api.anyplot.ai/specs/bump-basic",
  "render_light_png": "https://storage.googleapis.com/anyplot-images/plots/bump-basic/python/pygal/plot-light.png",
  "render_dark_png": "https://storage.googleapis.com/anyplot-images/plots/bump-basic/python/pygal/plot-dark.png",
  "interactive_light_html": "https://storage.googleapis.com/anyplot-images/plots/bump-basic/python/pygal/plot-light.html",
  "interactive_dark_html": "https://storage.googleapis.com/anyplot-images/plots/bump-basic/python/pygal/plot-dark.html",
  "quality_score": 87.0,
  "license": "MIT",
  "guide": "https://anyplot.ai/llms.txt"
}
Part of Basic Bump Chart on anyplot.ai.